Ecosyste.ms: Awesome
An open API service indexing awesome lists of open source software.
https://github.com/napjon/krisk
Statistical Interactive Visualization with pandas+Jupyter integration on top of Echarts.
https://github.com/napjon/krisk
dashboard data-science data-visualization echarts interactive-charts jupyter-notebook python
Last synced: about 1 month ago
JSON representation
Statistical Interactive Visualization with pandas+Jupyter integration on top of Echarts.
- Host: GitHub
- URL: https://github.com/napjon/krisk
- Owner: napjon
- License: bsd-3-clause
- Created: 2016-07-06T13:02:14.000Z (about 8 years ago)
- Default Branch: master
- Last Pushed: 2022-01-20T17:23:04.000Z (over 2 years ago)
- Last Synced: 2024-05-21T17:23:41.399Z (about 2 months ago)
- Topics: dashboard, data-science, data-visualization, echarts, interactive-charts, jupyter-notebook, python
- Language: Jupyter Notebook
- Homepage:
- Size: 1.87 MB
- Stars: 117
- Watchers: 15
- Forks: 21
- Open Issues: 8
-
Metadata Files:
- Readme: README.md
- License: LICENSE
Lists
- awesome-echarts - krisk - Statistical Interactive Visualization with pandas+Jupyter integration on top of Apache ECharts. (Languages / Python)
README
[](https://circleci.com/gh/napjon/krisk)
[](https://pypi.python.org/pypi/krisk/)
[](https://codecov.io/gh/napjon/krisk)

# Overview
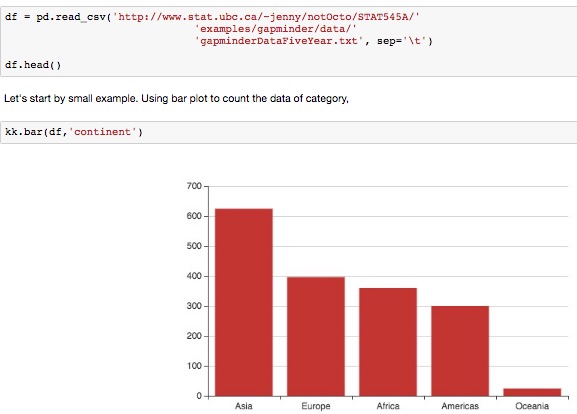
Krisk bring Echarts to Python Data Science Ecosystem, and helpful tools for high level statistical interactive visualization.

# Dependencies
* Python 3.5 (Python 2.7 should be supported, haven't test it yet)
* Jupyter Notebook 4.2.x
* Pandas 0.18.x
* Echarts 3.2.1 (built-in)
# Install
```Python
pip install jupyter pandas krisk
jupyter nbextension install --py krisk --sys-prefix
jupyter nbextension enable --py krisk --sys-prefix
```
# Tutorials
* [Introduction](http://nbviewer.jupyter.org/github/napjon/krisk/blob/master/notebooks/Intro.ipynb)
* [Themes and Colors](http://nbviewer.jupyter.org/github/napjon/krisk/blob/master/notebooks/themes-colors.ipynb)
* [Legend, Title, and Toolbox](http://nbviewer.jupyter.org/github/napjon/krisk/blob/master/notebooks/legend-title-toolbox.ipynb)
* [Resync Data and Reproducible Charts](http://nbviewer.jupyter.org/github/napjon/krisk/blob/master/notebooks/resync-reproducible.ipynb)
* [Declarative Visualization](http://nbviewer.jupyter.org/github/napjon/krisk/blob/master/notebooks/declarative-visualization.ipynb)
* [Waterfall and Barline Chart](http://nbviewer.jupyter.org/github/napjon/krisk/blob/master/notebooks/waterfall-barline.ipynb)
* [Tidy Plot: Time Series and Other Custom Data Manipulation](http://nbviewer.jupyter.org/github/napjon/krisk/blob/master/notebooks/tidy-plot.ipynb)
# What It Does
* Chart Integration with Jupyter Notebook, widgets, and Dashboard.
* Statistical interactive visualization
* Ability backed by Echarts (Toolbox, Transition, Tooltip, etc.)
# What It Doesn't Do
Krisk won't implement all features of Echarts. For more advanced usage, Krisk users can use JSON `option` (or HTML) output produced by Krisk to optimize in Javascript.
Only basic charts are supported for explanation visualization. The plan will support:
* More complex line, bar, scatter, and histogram.
* Geoscatter plot
* Time Series
Of course, contributions are welcome to support all chart types and advanced features.
# Motivation for Another Visualization Library
Krisk is targeted for building interactive dashboard application on top of two key components of Jupyter framework, [ipywidgets](https://ipywidgets.readthedocs.io/en/latest/) and [Jupyter Dashboard](https://github.com/jupyter-incubator/dashboards).
Krisk is also act as tool to support reproducible chart by utilizing pandas DataFrame as data input.
# How to Contribute
To contribute and unit tests your changes, please do the following,
1. Fork this repository
2. Clone this repo and do unit test,
```
pip install coverage pytest
git clone https://github.com/your-username/krisk.git
cd krisk
coverage run --source krisk -m py.test
```
# License
New BSD