Ecosyste.ms: Awesome
An open API service indexing awesome lists of open source software.
https://github.com/TehloWasTaken/HomeDashboard
A requested Github Repo for my Grafana Home Dashboard
https://github.com/TehloWasTaken/HomeDashboard
Last synced: 20 days ago
JSON representation
A requested Github Repo for my Grafana Home Dashboard
- Host: GitHub
- URL: https://github.com/TehloWasTaken/HomeDashboard
- Owner: TehloWasTaken
- Created: 2020-08-25T07:40:37.000Z (almost 4 years ago)
- Default Branch: master
- Last Pushed: 2020-08-25T19:01:38.000Z (almost 4 years ago)
- Last Synced: 2024-02-23T22:41:35.637Z (4 months ago)
- Size: 40 KB
- Stars: 373
- Watchers: 20
- Forks: 25
- Open Issues: 0
-
Metadata Files:
- Readme: README.md
Lists
- principe-awesome-stars - TehloWasTaken/HomeDashboard - A requested Github Repo for my Grafana Home Dashboard (Others)
README
# Grafana Home Dashboard
A requested Github Repo for my Grafana Home Dashboard
# To Start
Even though my Grafana Dashboard itself looks pretty and all, my entire setup is a complete mess to be fair. This is my first time ever really screwing around with Grafana and just seeing what I could do with it. Most of this stuff is ran off of my old gaming rig that I installed with Debian and have running as a home server. Next to that I have a few PI's for stuff like Domoticz, and Pi-Hole.
Before I started on this I had no knowledge of antything like Docker of Proxmox, so all of this stuff is just ran on a single box, without any shielding, containerizing or virtualisation. I know that's probably a blasphemy, but I already have plans for a new home server on which I this time **will** use something like Docker or Proxmox.
Below I've posted all the information and links to what I've used to set this up, I hope I can interest others to start using Grafana. Enjoy!
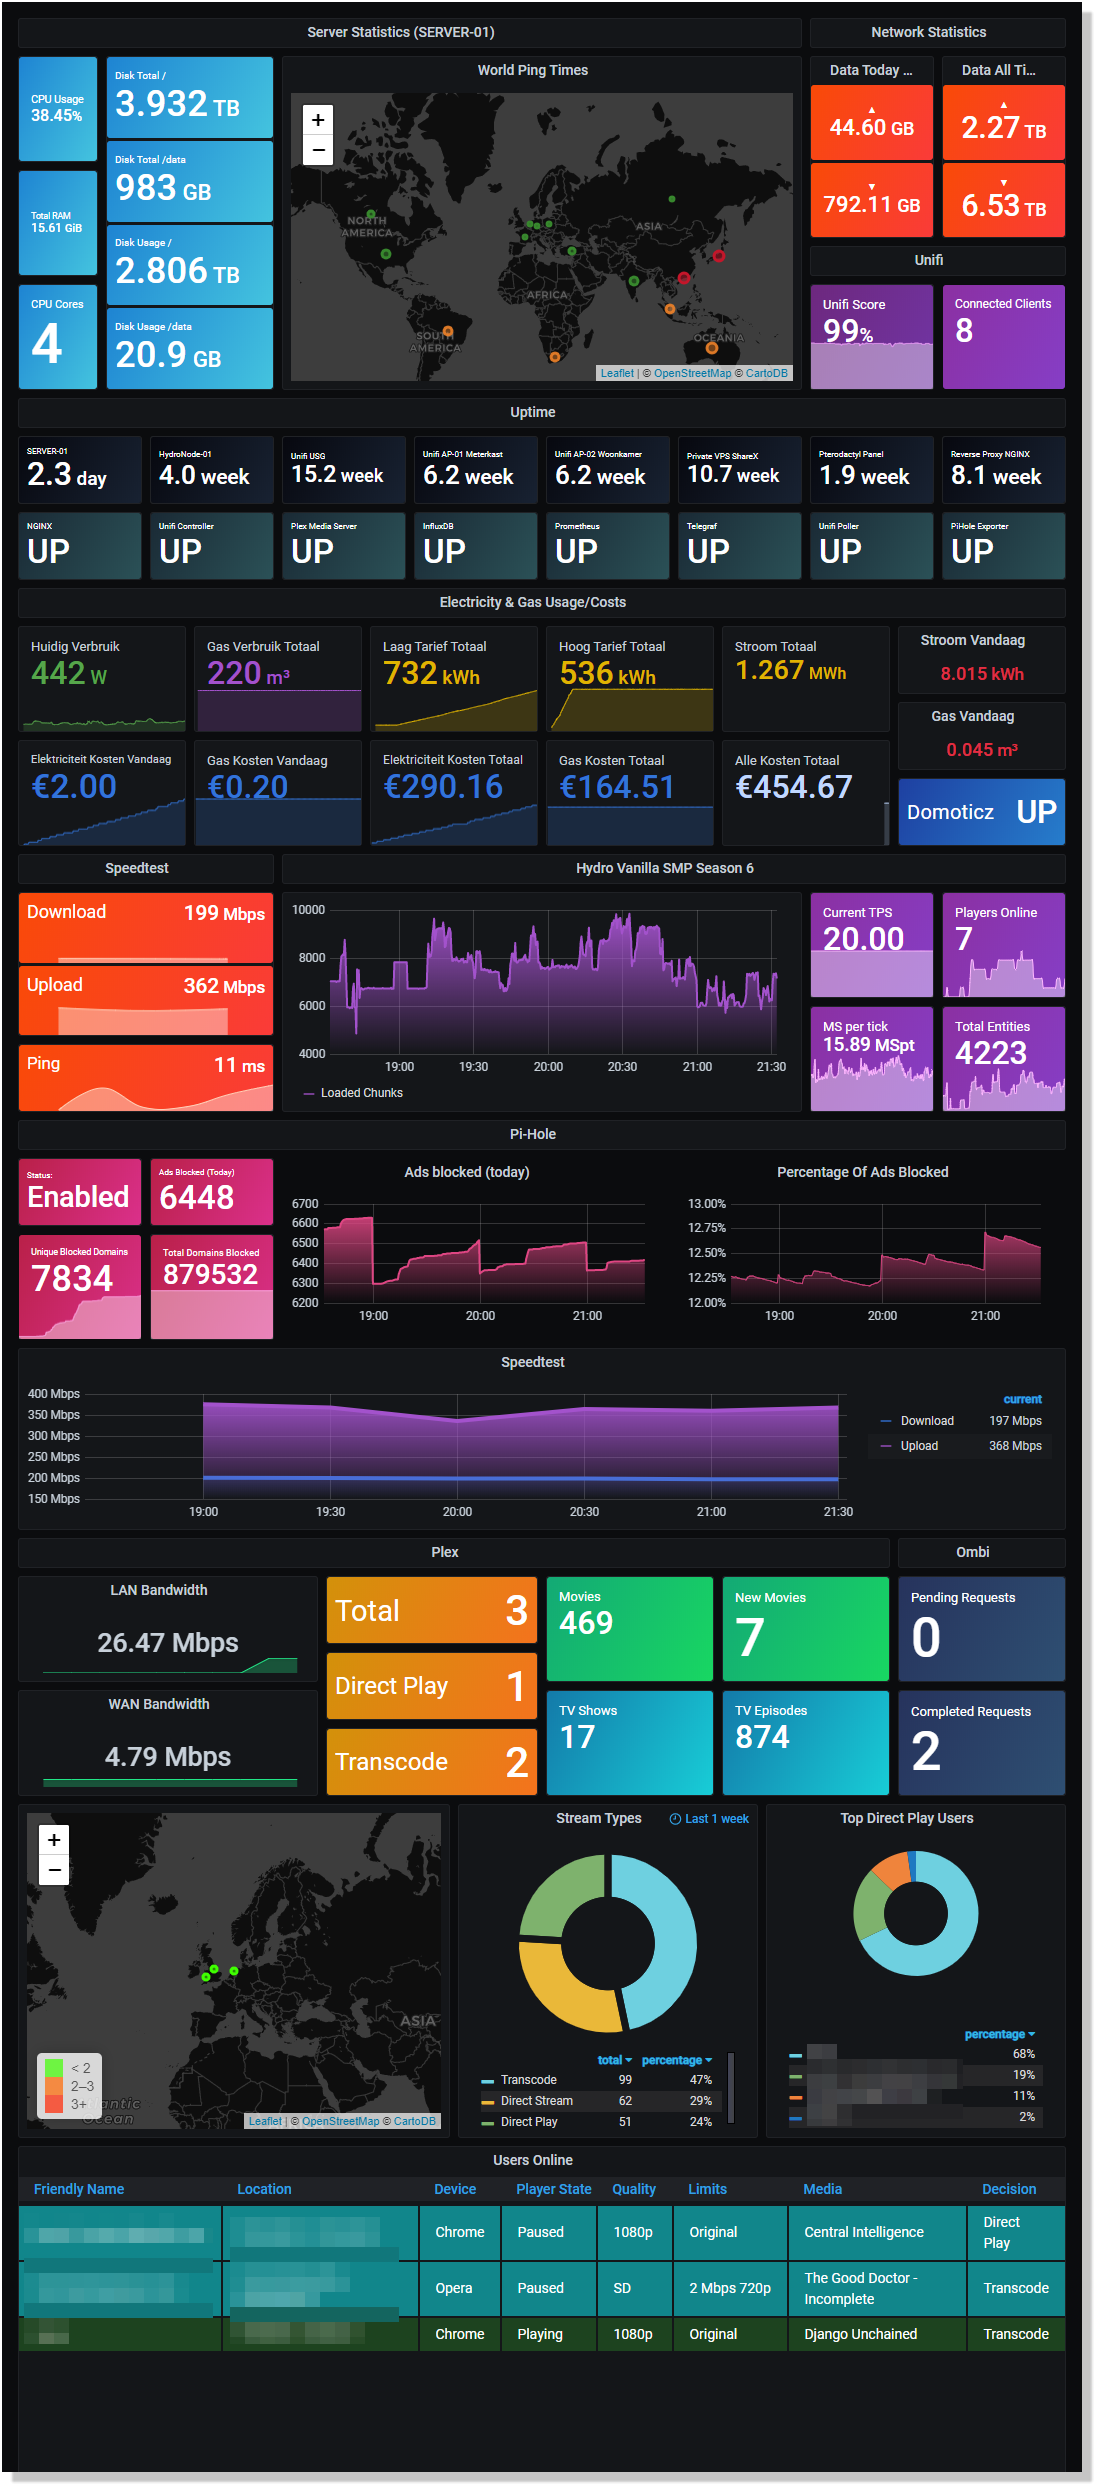
## Currently enabled in my Dashboard
* Stastics from my Home Server
* World Ping Times
* Data used (through Unifi)
* Unifi Score / Clients
* Systemd service uptime monitoring
* P1 Domoticz Gas/Electricity Usage
* Speedtest CLI
* ServerStatistics for information about my private Minecraft Server
* Pi-Hole Exporter
* Plex
* Tautulli (for Plex)
* Ombi (for Plex)
* Radarr / Sonarr (for Plex)
* Varken (this is what ties Plex together with Tautulli, Ombi, Radarr / Sonarr
## Datasources used
* [InfluxDB](https://www.influxdata.com/)
* [Telegraf](https://github.com/influxdata/telegraf)
* [Prometheus](https://prometheus.io/)
(I learned all three along the way, and they all have their benefits for me. Some external tools only support one, so mixing them up was the best way to go about it)
# How does it work
To make all of this happen I made use of a ton of other tools and example dashboards from other HomeLabbers or similar dashboards online. The best way in my opinion to learn about this stuff is to just see it happen elsewhere which will spark the idea for yourself to work on it. For me it was just trying to see what data I could collect (you *will* become a data whore) from my simple home server that I installed with Debian. I was always hard into domotica and other smart home stuff, so I thought I'd give this a try.
Then, how did I make this happen:
I will go by the categories on my Dashboard to explain it as best as possible, as I've properly labeled each one.
## Server Statistics (SERVER-01)
This is my home server. Using Prometheus and [Node Exporter](https://github.com/prometheus/node_exporter) I was able to collect simple data like CPU usage, RAM usage, how much disk space I used etc. This one especially is easy to use for beginners, as Prometheus after setting it up has a web GUI that you can view your metrics in. You can just click away on these metrics and data will appear that has been collected.
The World Ping Times map is made by first using the [worldPing](https://grafana.com/grafana/plugins/raintank-worldping-app) plugin from Grafana. This will visualize the ping data that I input. You can use Telegraf for this, as it has a built-in ping feature.
After installing Telegraf, in it's configuration file you'll see the following (it's a big config file, so you'll scroll for a while)
`# # Ping given url(s) and return statistics`
`[[inputs.ping]]`
Below this, you can input IP addresses or hostnames of place you would like to ping. Below, you can set a timer on how often you want to ping, I've set this pretty slow as I'm using public IP addresses from all over the world and I'd hate to get blocked by them :p
## Network Statistics & Unifi
The data in these 6 blocks is used from my Unifi gear at home. I have a Unifi USG directly connected to my ISP (they support it, yay) after which I have a POE Switch and two access points. I only use Unifi gear which makes it easier for me to collect all the data, but you can easily do this with just a few devices aswell. Most of the data comes from the USG anyway as this is my gateway to the internet.
To get the data out of your Unifi Controller I used [Unifi-Poller](https://github.com/unifi-poller/unifi-poller).
I was **surprised** at how easy this was to setup. You install it, create a read-only user on your Unifi Controller and it will start scraping data right away! Back when I set this up I didn't know about Influx yet, so I set this up with Prometheus (it supports both). This however did allow me to see my metrics before hand in Prometheus' GUI, which made it easier to find the right metrics for the stuff I wanted to use.
With the following metrics you can get your data of the last 24 Hours:
**Upload:**
``increase(unifipoller_device_wan_transmit_bytes_total[24h])``
**Download:**
``increase(unifipoller_device_wan_receive_bytes_total[24h])``
The metrics for the All Time data are exactly the same, I just removed the `increase` and `24h` parts to make it collect the all time data.
I know I can get a LOT more data from Unifi-Poller, but on my Home Dashboard this is all I needed for now. Unifi-Poller is insanely big, and it exports so much data that I didn't even know what to do with it all. They do however have demo dashboards you can use, which will nicely show you all the possible data you can get. You can find these [here](https://grafana.com/grafana/dashboards?search=unifi-poller)
## Uptime
This one is kind off funny, as my current setup isn't the best, and I later found out that Telegraf can do systemd monitoring itself. I myself however used a Python script to get this information, which I then imported into Telegraf to display it in Grafana. Credits to Alexey Nizhegolenko for this one as he is the original creator of this script.
You can find the Python script [here](https://github.com/ratibor78/srvstatus)
Whenever one of my services goes down it will alert me by making the card for the specific service bright red, telling me something is going on. I could have set up alerts for this, but I didn't see the need to do so.
## Electricity & Gas Usage/Costs
I. Absolutely. Love. This. When I moved houses around 4 months ago, into a completely newly built home I found out that my gas/electricity meters are smart meters, and have a P1 Port. This port can be used to plug in a RJ-11 to USB cable, which I have connected to my PI. On this Pi I run a tool called [Domoticz](https://www.domoticz.com/), which is **amazing**, you should really check it out if you're into smart home stuff and have a P1 monitor. Domoticz has built-in support for a P1 monitor, so all you have to do is plug it in, tell Domotizc you have a P1 cable and it will automatically collect all the data for you!
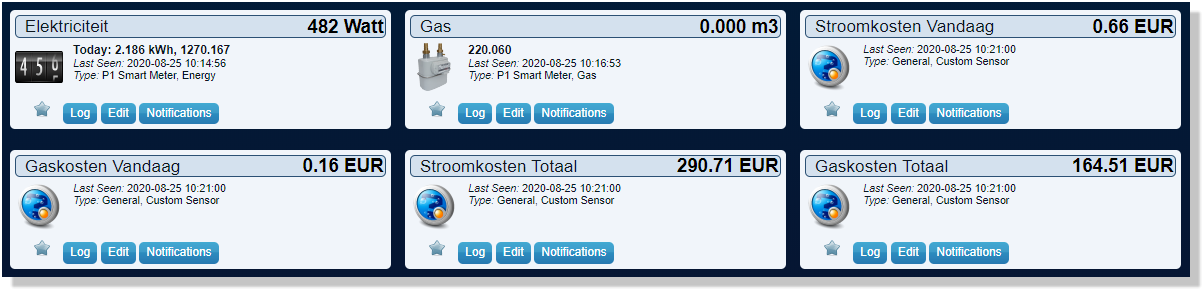
This ofcourse doesn't look as good as Grafana, and since I wanted only a single dashboard for all my data I would have to use another way to pipe this into Grafana. As of recently, Domoticz actually supports data pushing to Influx by itself, which made my life a lot easier. All you do is select the metrics you want to push, and push them to a new Influx Database. In Grafana you will then be able to select the metrics so you can visualise the data. I created a few simple scripts to get some extra metrics, but the standard ones will be more than enough at first!
With this I can easily see how much electricity/gas I've used today, how much it costs and what my alltime high/low usage is.
*Sidenote, if you have solar panels at home and are using these, the P1 monitor will see that you have them and will also collect how much electricity you are giving back to your provider!*
## Speedtest
None of the currently existing speedtest-cli tools I found to work well and store it's data properly, so I made use of an external script to pipe the data from speedtest-cli into an Influx database to visualise it in Grafana. The creator of this script is Dutch, so if you are too you can read his information here. If you are not, the script itself will suffice and maybe Google Translate will help you out ;)
[Link](https://eye-vision.homeip.net/internet-snelheid-meten-en-grafana/)
## Hydro Vanilla SMP Season 6 (Minecraft Server)
The data for my private Minecraft Server has been exported to Grafana using a plugin called ServerStatistics. You can check it out on MC-Market [here](https://www.mc-market.org/resources/4611/)
*it is paid, but if you run a medium size or larger server this will be amazing to have*
This plugin is installed on your Minecraft server, and will export all your data to Prometheus (Influx isn't currently supported :( )
With this you can export an absolute TON of data. I was surprised as to how much it collects, but all of it is really useful. It even has support for some of the more known and frequently used Plugins, so if you use any of those you can even see your data of that. I myself don't run a Bungee network, but it has support for Bungee networks too!
## Pi-Hole
We all know that ad-blockers don't really work on browsers, and they certainly do not work on mobile devices. I remembered that during my IT study I came across a neat tool called Pi-Hole, which would block ads on a network based level. A few months ago I found this again as some of my current friends were using it again, and it got me interested aswell.
For those that don't know, Pi-Hole is a network based adblocker which will act as your DNS server and will block the domains on where ads are coming from. This will result in no ads on all of the devices on your network, as long as you set your primary DNS to your Pi-Hole. You can add your own lists of domains to block, I myself mainly use [this one](https://firebog.net/)
Pi-Hole itself has a really nice dashboard, but once again I wanted to see this in Grafana too. Luckily, [Pi-Hole Exporter](https://github.com/eko/pihole-exporter) exists! With this, you can take all the data from your Pi-Hole and export it to Grafana. For my own dashboard I used a few of the metrics from the default dash that comes with Exporter, which I changed and fit to my own needs.
It is a bit of a pain to setup, so do take your time with this as it is a very tedious process.
## Plex
Now we get to the part that I am most excited about. Before any of this homelab stuff, I was already using Plex. I had used a Plex from a friend of mine for years, but since he wasn't always around I wanted to watch movies at times he wasn't available, and the movies weren't in his library. So, I resulted to creating my own Plex server. Do note, all these movies and shows take up a TON of storage, so be wary of that as next thing you know you're sitting on a 60TB server (lol)
Plex itself cannot communicate with Grafana in any way, there simply isn't a way to do this. To make this work I use an **amazing** tool called [Varken](https://github.com/Boerderij/Varken). This external application was created by a bunch of really smart people, and I want to give full credits to them as Varken is an insanely powerful tool and the amount of stuff it can do is amazing.
Varken on it's own is nice, but extra data is always preferred. To communicate with Plex I have installed [Tautulli](https://github.com/Tautulli/Tautulli). All of the data Tautulli collects from Plex I send to Varken, which then visualised that from my Influx DB in Grafana. It sounds complicated, but if you sit down for a few hours you will have this up and running, guaranteed.
Tautulli and Varken collect a ton of data, and can also collect from external services like Radarr/Sonarr/Lidarr etc. Up untill a week ago I wasn't using these myself, but after now also using Radarr/Sonarr it is really nice to be able to show this data in Grafana aswell. Together with Plex/Radarr/Sonarr I make use of [Ombi](https://ombi.io/), which I use for the people that have access to my Plex. Through Ombi my Plex Members can request movies/tv shows, which will be automatically sent to Radarr/Sonarr to download. After that's done it will be moved to Plex so they can watch it.
I used to do requests for movies/shows through Discord/Whatsapp etc, but after finding Ombi I am relieved that they can just do it themselves, rather then me having to do it manually for them, saved me a ton of time. If you are already running Plex and are sharing your libraries with others and you take requests, I **highly** recommend checking out Ombi as it will most likely save you a ton of time too!
Varken is the key in all of this, as this hooks into everything I talked about above. It can do a lot, and I am only using 10% of what it can do!
# And that's it!
This is how my entire Grafana Dashboard works. I will in the near future upload my own Dashboard to the Grafana Dashboard page, although it is so highly customized to my own needs that it will need a lot of tweaking to work in your own setup. You're welcome to give it a try however ;)