Ecosyste.ms: Awesome
An open API service indexing awesome lists of open source software.
https://github.com/flant/grafana-statusmap
Grafana panel plugin to visualize status of multiple objects over time
https://github.com/flant/grafana-statusmap
grafana grafana-panel grafana-plugin
Last synced: 27 days ago
JSON representation
Grafana panel plugin to visualize status of multiple objects over time
- Host: GitHub
- URL: https://github.com/flant/grafana-statusmap
- Owner: flant
- License: mit
- Created: 2018-09-17T06:43:49.000Z (almost 6 years ago)
- Default Branch: master
- Last Pushed: 2023-02-22T00:16:35.000Z (over 1 year ago)
- Last Synced: 2024-05-19T00:35:52.567Z (about 2 months ago)
- Topics: grafana, grafana-panel, grafana-plugin
- Language: TypeScript
- Size: 2.76 MB
- Stars: 826
- Watchers: 23
- Forks: 42
- Open Issues: 59
-
Metadata Files:
- Readme: README.md
- Changelog: CHANGELOG.md
- License: LICENSE
Lists
- awesome-repositories - flant/grafana-statusmap - Grafana panel plugin to visualize status of multiple objects over time (TypeScript)
- awesome-repositories - flant/grafana-statusmap - Grafana panel plugin to visualize status of multiple objects over time (TypeScript)
- awesome-stars - flant/grafana-statusmap - Grafana panel plugin to visualize status of multiple objects over time (TypeScript)
- awesome-stars - grafana-statusmap
- awesome-stars - flant/grafana-statusmap - Grafana panel plugin to visualize status of multiple objects over time (TypeScript)
- awesome - grafana-statusmap - Grafana panel plugin to visualize status of multiple objects over time (TypeScript)
- my-awesome-stars - flant/grafana-statusmap - Grafana panel plugin to visualize status of multiple objects over time (TypeScript)
README
# Statusmap panel for Grafana
[](https://github.com/flant/grafana-statusmap/releases/latest)
[](https://github.com/flant/grafana-statusmap/discussions)
[](https://t.me/statusmap_ru)
[](https://twitter.com/flant_com)
Panel to show discrete statuses of multiple targets over time.


> Run `docker compose up` and open http://localhost:3000 in browser to see a simple demo.
## Features
* Grouping values into rows and buckets using legend from query
* User defined color mapping
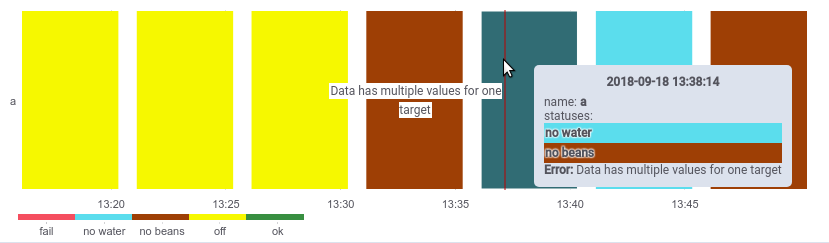
* Multiple values in bucket are displayed via tooltip
* Configurable tooltip items
* Pagination for rows
* Increasing rows/buckets' interval for better visual representation
* Representing null values as empty bucket or zero value
### Supported environment
* Tested with:
- Prometheus
- InfluxDB
- Mysql
- Grafana 7.x, 8.x
* Support for earlier Grafana versions:
- 0.5.x versions should work in Grafana 6.5.x - 6.7.x with timeseries data format
- (0.4.2)[https://github.com/flant/grafana-statusmap/releases/tag/v0.4.2] should work in Grafana 5.4.x - 6.4.x
## Motivation
We had a desperate need to visualize a set of timeseries statuses over time period, so we can
see a history of changes for objects' status. Since we maintain a lot of Kubernetes clusters
(and related infrastructure), our main cases for that are visualization of servers & Kubernetes
pods health states as well as HTTP services health checks. We've tried a variety of Grafana
plugins available (they are listed in *Acknowledgements* below) but none of them could provide
the features and visualization really close to what we've been looking for.
_NB: You can find more details about our journey of creating the plugin in
[this post](https://medium.com/flant-com/statusmap-grafana-plugin-to-visualize-status-over-time-fe6ced391853)._
_Objects_ being visualized with this plugin may be different: not only IT components (e.g. server
hosts and Kubernetes pods) but just anything you can imagine like coffee makers on the picture
above. These objects should have _discrete statuses_ which are sets of predefined values, e.g.
`ok` = 0, `off` = 1, `fail` = 2, etc.
## Configuration
### Datasource notes
To create neat graphs your datasource should return good data. Plugin adjust `$__interval` variable depending on
bucket width in panel options. Your queries should aggregate statuses over `$__interval`.
To make multiple values mode works as expected you should define multiple queries: one query for each possible status.
Plugin doesn't aggregate data in time for now, it only renders input data as buckets. Because of this
data should contain points for each timestamp in time range and equal timestamps for every possible
target (y-axis label). This limitation is addressed by [issue #53](https://github.com/flant/grafana-statusmap/issues/53).
#### Prometheus
To work with data from Prometheus you will need to setup discrete statuses for your objects.
Requirements to store these statuses in metrics are as follows:
* metrics should have two values: `0` and `1`;
* there should be a label with status' value.
When it's done, you can collect all the data via query, e.g.:
```
(max_over_time(coffee_maker_status{status=""}[$__interval]) == 1) *
```
If there was no such status (``) during query's interval, Prometheus would
return nothing. Otherwise, status' value will be returned.
For example, if you have 5 types of statuses and a metric (`coffee_maker_status`) with 5
allowed values (`0`, `1`, `2`, `3`, `4`), you should transform this metric using following rule:
```
- record: coffee_maker_status:discrete
expr: |
count_values("status", coffee_maker_status)
```
That's how `coffee_maker_status` metric with value `3` will be transformed into new metric:
```
coffee_maker_status:discrete{status="3"} 1
```
Now, when Prometheus has `0` and `1` values for each status, all these metrics can be
aggregated, so you will get all available statuses of your objects over time.
#### InfluxDB
Choose 'Time series' for 'Format as' and use `GROUP BY ($__interval)` in query. `$tag_` can be used in 'Alias by' to define y-axis labels.
#### Mysql
Example query with aggregation over `$__interval` is like this (you need one query for each possible status value):
```
SELECT
$__timeGroupAlias(date_insert,$__interval),
name AS metric,
min(statusi) AS "statusi"
FROM coffee_makers
WHERE
$__timeFilter(date_insert) AND statusi=1
GROUP BY 1,2
ORDER BY $__timeGroup(date_insert,$__interval)
```
`metric` column is used as y-axis label.
### Panel
First of all, an individual query for each possible status' value should be created.
Each query should also have similar legend for grouping:

Then, color mapping for status' values should be defined in __Discrete__ color mode:

Use can use presets to define a trafic light colors or 8 colors from [solarized](https://ethanschoonover.com/solarized/) palette:


_Note: __Spectrum__ and __Opacity__ color modes function the same way they do in [Heatmap](https://grafana.com/plugins/heatmap) plugin._
### More options
#### Bucket

__Multiple values__ checkbox specifies how they should be displayed:
* If it's off, multiple values for one bucket are treated as error;
* If it's on, color for such bucket would be determined by the value having least index in color mapping.
__Display nulls__ can be treated as empty buckets or displayed with the color of `0` value.

__Min width__ and __spacing__ are used to specify minimal bucket width and spacing between buckets.
__Rounding__ may be used to round edges.


__Values index__ set to positive number to display only values from specified timeseries.
#### Display

__Show legend__ checkbox toggles legend at the bottom of the panel.
__Rows sort__ can be used to sort labels on Y axis. Metrics — sort y labels as they are defined on Metrics tab. a→z and z→a sort labels descending or ascending in a [natural](https://developer.mozilla.org/ru/docs/Web/JavaScript/Reference/Global_Objects/String/localeCompare) order.
#### Pagination

__Enable pagination__ toggles pagination controls on graph.
__Rows per page__ a number of rows to display on graph.
#### Tooltip

__Show tooltip__ toggles tooltip display on mouse over buckets.
__Freeze on click__ toggles tooltip "freezing" on click. Frozen tooltip can be used to compare data with floating tooltip or to follow URLs.
__Show items__ toggles display of additional items in tooltip.
__Items__ is a list of definitions to display URLs in tooltip.
Each URL has a template, icon, label and formating options: lowercase and date format for variables.

#### Percentual bucket spans
In some cases scenarios, the status panel is used to go from one dashboard to a more specific one, e.g. when performing root/cause analysis. In such cases, the user may want to reduce the scope of the time span, while keeping the desired event centered (to be able to analyse the previous/posterior buckets of time). Those values are introduced through `__bucket_from` and `__bucket_to`.
`__bucket_from`: It's the value of `bucket.from` minus the percentual bucket.
`__bucket_to`: It's the value of `bucket.to` plus the percentual bucket.
## Learn more
* [Changelog](https://github.com/flant/grafana-statusmap/blob/master/CHANGELOG.md)
* Use [GitHub Discussions](https://github.com/flant/grafana-statusmap/discussions) to ask for help.
* [Installation](https://grafana.com/grafana/plugins/flant-statusmap-panel/?tab=installation)
* Setup [development](https://github.com/flant/grafana-statusmap/blob/master/DEVELOPMENT.md) environment to help us improve the plugin.
## Acknowledgements
The first public release of this plugin has been fully made by [Flant](https://flant.com/) engineers. The whole idea has come from Dmitry Stolyarov ([@distol](https://github.com/distol)), initial version has been written by Sergey Gnuskov ([@gsmetal](https://github.com/gsmetal)) and final changes has been made by Ivan Mikheykin ([@diafour](https://github.com/diafour)).
This plugin is based on "Heatmap" panel by Grafana and partly inspired by ideas from Carpet plot, Discrete panel, Status Panel, Status Dot, Status By Group.