Ecosyste.ms: Awesome
An open API service indexing awesome lists of open source software.
https://github.com/qstumn/RadarChart
支持自由定制外观、手势旋转的雷达图表 android radarchart
https://github.com/qstumn/RadarChart
radar-chart radarview
Last synced: 1 day ago
JSON representation
支持自由定制外观、手势旋转的雷达图表 android radarchart
- Host: GitHub
- URL: https://github.com/qstumn/RadarChart
- Owner: qstumn
- License: apache-2.0
- Created: 2016-08-16T05:57:49.000Z (almost 8 years ago)
- Default Branch: master
- Last Pushed: 2017-10-12T05:38:24.000Z (over 6 years ago)
- Last Synced: 2024-05-27T13:43:13.692Z (20 days ago)
- Topics: radar-chart, radarview
- Language: Java
- Homepage:
- Size: 1.78 MB
- Stars: 390
- Watchers: 17
- Forks: 76
- Open Issues: 6
-
Metadata Files:
- Readme: README.md
- License: LICENSE
Lists
- awesome-github-android-ui - RadarChart - 自由定制旋转交互的Android雷达图 (图表(Chart))
- awesome-github-android-ui - RadarChart - 自由定制旋转交互的Android雷达图 (图表(Chart))
- awesome-stars - RadarChart - 支持自由定制外观、手势旋转的雷达图表 android radarchart (Java)
README
# RadarView
[  ](https://bintray.com/qstumn/maven/RadarView/_latestVersion)
一个可以自由定制、旋转交互的Android雷达图Lib
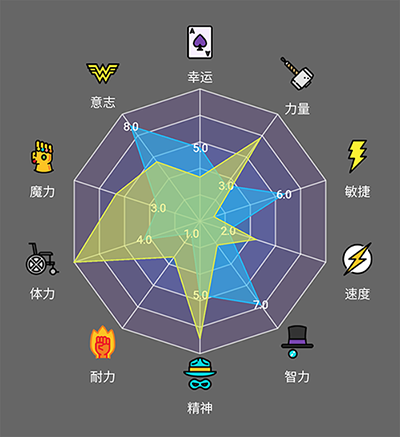
### 一些特性
* 支持手势旋转(可关闭)
* 支持动画的方式添加展现数据
* 支持对各层雷达网添加背景
* 支持自定义雷达网层数
* 支持使用圆形作为雷达网
* 扇区(顶点)个数无限制
* 顶点描述支持图文混排
* 支持添加多组数据
* 数据区支持设置值的描述文字
* 所有的文字、雷达网、线、数据区颜色和大小均可定制

## how to use:
### 1. gradle
```groovy
compile 'q.rorbin:RadarView:1.0.4'
```
VERSION_CODE : [here](https://github.com/qstumn/RadarChart/releases)
### 2. xml
```xml
```
### 3. 属性说明
xml | code | 说明
---|---|---
app:radar_layer | setLayer | 雷达网层数
app:rotation_enable | setRotationEnable | 是否打开手势旋转
app:web_mode | setWebMode | 雷达网模式(多边形、圆形...)
app:max_value | setMaxValue | 最外圈的值
app:vertex_line_color | setVertexLineColor | 顶点连线颜色
app:vertex_line_width | setVertexLineWidth | 顶点连线宽度
app:layer_line_color | setLayerLineColor | 雷达网线条颜色
app:layer_line_width | setLayerLineWidth | 雷达网线条宽度
app:vertex_text | setVertexText | 顶点文字内容(字符串数组)
app:vertex_text_color | setVertexTextColor | 顶点文字颜色
app:vertex_text_size | setVertexTextSize | 顶点文字大小
app:vertex_icon_size | setVertexIconSize | 顶点图片的尺寸限制值
app:vertex_icon_position | setVertexIconPosition | 顶点图片相对于顶点文字的位置
app:vertex_icon_margin | setVertexIconMargin | 顶点图片相对于顶点文字的间距
app:vertex_text_offset | setVertexTextOffset | 顶点图文距最外层网偏移量
app:center_text_color | setCenterTextColor | 中心文字颜色
app:center_text_size | setCenterTextSize | 中心文字大小
app:center_text | setCenterText | 中心文字内容
注:各属性均有默认值
### 4. 方法说明
code | 说明
--- | ---
setLayerColor | 设置雷达网各层颜色
animeValue | 展现一次数据添加动画
addData | 添加数据
removeRadarData | 删除一组数据
clearRadarData | 删除所有数据
setEmptyHint | 设置空数据时的提示
setMaxValue | 设置数据区最大限制值
setMaxValues | 设置数据区各顶点最大限制值
setVertexIconBitmap setVertexIconResid | 设置顶点图片内容
### 5. 添加数据
1. 创建并添加数据
```java
List values = new ArrayList<>();
Collections.addAll(values, 3.2f, 6.7f, 2f, 7f, 5.6f);
RadarData data = new RadarData(values);
mRadarView.addData(data);
```
2. 方法说明
code | 说明
--- | ---
setLabel | 数据的标注
setValue | 设置(更改)数据值
setLineWidth | 设置边线宽度
setValueText | 数据值的描述
setValueTextEnable | 是否显示描述
setValueTextSize | 描述的文字大小
setVauleTextColor | 描述的文字颜色
### 6. 更新计划
添加点击事件接口
# LICENSE
```
Copyright 2016, RorbinQiu
Licensed under the Apache License, Version 2.0 (the "License");
you may not use this file except in compliance with the License.
You may obtain a copy of the License at
http://www.apache.org/licenses/LICENSE-2.0
Unless required by applicable law or agreed to in writing, software
distributed under the License is distributed on an "AS IS" BASIS,
WITHOUT WARRANTIES OR CONDITIONS OF ANY KIND, either express or implied.
See the License for the specific language governing permissions and
limitations under the License.
```