Ecosyste.ms: Awesome
An open API service indexing awesome lists of open source software.
https://github.com/mahendrapaipuri/jupyter-power-usage
Jupyter extension to display CPU and GPU power usage and equivalent CO2 emissions
https://github.com/mahendrapaipuri/jupyter-power-usage
emissions-co2 energy-consumption green-computing jupyter jupyterlab jupyterlab-extension rapl
Last synced: 17 days ago
JSON representation
Jupyter extension to display CPU and GPU power usage and equivalent CO2 emissions
- Host: GitHub
- URL: https://github.com/mahendrapaipuri/jupyter-power-usage
- Owner: mahendrapaipuri
- License: apache-2.0
- Created: 2023-10-01T19:12:20.000Z (9 months ago)
- Default Branch: main
- Last Pushed: 2024-04-14T13:26:00.000Z (3 months ago)
- Last Synced: 2024-04-14T17:40:56.481Z (3 months ago)
- Topics: emissions-co2, energy-consumption, green-computing, jupyter, jupyterlab, jupyterlab-extension, rapl
- Language: TypeScript
- Homepage:
- Size: 358 KB
- Stars: 8
- Watchers: 1
- Forks: 0
- Open Issues: 2
-
Metadata Files:
- Readme: README.md
- Changelog: CHANGELOG.md
- Contributing: CONTRIBUTING.md
- License: LICENSE
Lists
- awesome-green-ai - jupyter-power-usage - black?style=flat&logo=linux)  (🛠 Tools / Monitoring Tools)
README
# jupyter-power-usage

[](https://pypi.python.org/pypi/jupyter-power-usage)
[](https://pypi.python.org/pypi/jupyter-power-usage)
[](https://github.com/jupyter-server/jupyter-resource-usage/issues)
**Try the extension on**
[](https://mybinder.org/v2/gh/mahendrapaipuri/jupyter-power-usage/main)

The objective of this extension is to display power usage of the CPU and/or GPU on which jupyter server is running. Power usage is estimated using [Running Average Power Limit (RAPL)](https://web.eece.maine.edu/~vweaver/projects/rapl/) metrics that are available on Intel processors manufactured after 2012 (since broadwell). It is available on latest AMD processors as well. For the case of GPUs, currently only nVIDIA GPUs are supported and power usage is gathered from `nvidia-smi` tool.
Additionally, the extension is capable of estimating equivalent CO2 emissions. Emissions are estimated based on the current power usage and a emission factor that gives equivalent grams of CO2 power consumed. Currently, the extension supports fetching real time emission factor from [RTE eCO2 mix (only for France)](https://www.rte-france.com/en/eco2mix/co2-emissions) and [Electricty Maps](https://www.electricitymaps.com/?utm_source=api-portal.electricitymaps.com&utm_medium=referral) that provides factor for a lot of countries. If neither RTE eCoCO2 mix nor Electricity Maps can be used, a constant configurable emission factor is available to use. Actually a [value of 475 gCO2.eq/kWh](https://arxiv.org/pdf/2306.08323.pdf) is used as default for this constant factor.
The metrics are displayed in the top bar of JupyterLab and are updated at a configurable interval. The default interval is 5 seconds. RAPL can enforce power limit so as nVIDIA GPUs. If those power limits are enabled and available, they will be displayed in the indicators.
---
**NOTE**
The extension works only on Linux that exposes RAPL metrics. Starting from kernel 5.4, RAPL metrics are accessible [only for root](https://git.kernel.org/pub/scm/linux/kernel/git/stable/linux.git/commit/?h=v5.4.77&id=19f6d91bdad42200aac557a683c17b1f65ee6c94). In this case, the user needs to add read permissions on `/sys/fs/powercap` directory to be able to display power usage indicators in JupyterLab.
If the JupyterLab is running inside a container or VM, ensure that `/sys/fs/powercap` file system exists. If it does not, extension will not work.
The extension is not available for Notebook < 6. It supports JupyterLab >= 3 and Notebook >= 7.
The extension's architecture closes follows the [jupyter-resource-usage](https://github.com/jupyter-server/jupyter-resource-usage) extension and all the credit goes to the contributors and maintainers of the above stated extension.
---
## Installation
### JupyterLab 3.x
You should install the version `<1.0.0` for JupyterLab 3.x compatibility.
```bash
pip install 'jupyter-power-usage<1.0.0'
```
### JupyterLab 4.x and Notebook 7.x
You should install the latest version for JupyterLab 4.x and Notebook 7.x compatibility.
```bash
pip install jupyter-power-usage
```
The extension **does not support** Notebook < 7.
## Configuration
### Server side config
#### Measurement Scope
Currently the extension supports different measurement scopes:
- `process`: Power usage for current process and its children will be reported
- `user`: Power usage for current user processes will be reported
- `system`: Power usage for entire system will be reported.
By default `process` scope is used. The user can change it by CLI flag `--PowerUsageDisplay.measurement_scope` to `jupyter lab` command. Alternatively, it can be configured in `jupyter_server_config.json` in [Jupyter config directory](https://docs.jupyter.org/en/latest/use/jupyter-directories.html#configuration-files).
#### Electricity Maps API token
An API token for electricity maps emission factor. By default API requests are made from jupyter server as they involve including authentication token. These are called proxied requests. If they fail, API requests directly from the browser will be made using the API token configured in the frontend extension. Users should configure the token on the server config as exposing API token in browsers can pose security issues. It can be set on CLI using `--PowerUsageDisplay.emaps_access_token=`.
### Frontend extension config
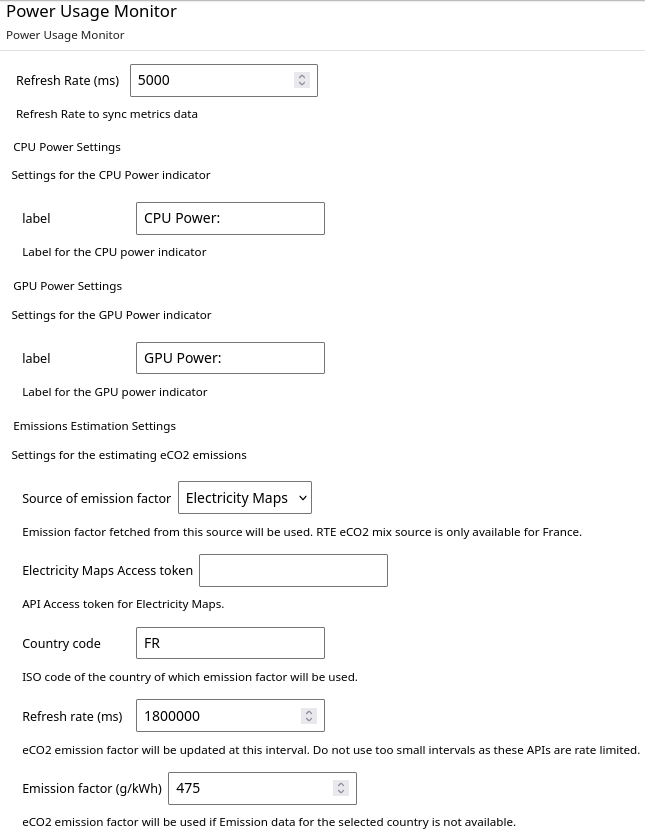
The frontend extension settings can be accessed by `Settings -> Advanced Settings -> Power Usage Monitor` in JupyterLab. Important settings are:
- `Refresh Rate`: Frequency at which power usage is updated in the JupyterLab. Do not use too small intervals as it will end up making too many API calls to update metrics.
- `CPU label` and `GPU label` settings are self explanatory.
**Emissions Estimation Settings**
- `Source of emission factor`: Currently [Electricity Maps](https://www.electricitymaps.com/) and [RTE eCO2 mix](https://www.rte-france.com/en/eco2mix/co2-emissions) are supported. Note that RTE eCO2 mix data is only available for France.
- `Electricity Maps Access token`: An API access token for Electricity Maps (See [Server Config](#electricity-maps-api-token)).
- `Country code`: ISO 3166-1 alpha-2 country code. This will be used only when `Electricity Maps` emission factor source is used.
- `Refresh rate`: This defines how often the emission factor is updated in ms. For [RTE eCO2 mix](https://www.rte-france.com/en/eco2mix/co2-emissions) data, it is updated every 30 min and has a rate limit of 50000 API requests per month.
- `Emission factor`: This constant emission factor is used in the estimation of emissions when country specific data is unavailable.
## Contributing
If you would like to contribute to the project, please read the [`CONTRIBUTING.md`](CONTRIBUTING.md). The `CONTRIBUTING.md` file
explains how to set up a development installation and how to run the test suite.
## Uninstall
```bash
pip uninstall jupyter_power_usage
```
This will uninstall python package and all the frontend related assets.
## Troubleshooting
- If power indicators do not show up in the JupyterLab, try reload the browser tab.
Sometimes network latencies prevent extension to load in time.
- If there are any issues with the server side extension, they will be logged to the
same log that JupyterLab uses.