Ecosyste.ms: Awesome
An open API service indexing awesome lists of open source software.
https://github.com/youngdro/fundSpider
node编写的基金爬虫,可保存基金信息到数据库
https://github.com/youngdro/fundSpider
Last synced: 9 days ago
JSON representation
node编写的基金爬虫,可保存基金信息到数据库
- Host: GitHub
- URL: https://github.com/youngdro/fundSpider
- Owner: youngdro
- Created: 2018-04-26T07:45:20.000Z (about 6 years ago)
- Default Branch: master
- Last Pushed: 2018-07-07T14:15:27.000Z (almost 6 years ago)
- Last Synced: 2024-03-03T01:35:19.160Z (4 months ago)
- Language: JavaScript
- Size: 831 KB
- Stars: 108
- Watchers: 5
- Forks: 26
- Open Issues: 2
-
Metadata Files:
- Readme: README.md
Lists
- awesome-github-star - fundSpider
README
# fundSpider
### node编写的基金爬虫,可保存基金信息到数据库
具体实现过程可在[这篇文章](https://juejin.im/post/5af01d27f265da0b7f447ab6)查看
启动:
`npm install`
`npm run start`
使用express构建本地服务,启动后得到的本地数据接口如下:
>所有基金代码接口:
http://localhost:1234/fetchFundCodes
>基金基本信息接口:
http://localhost:1234/fetchFundInfo/:code
>基金净值变化数据接口:
http://localhost:1234/fetchFundData/:code/:per
得益于以下网页接口:
>所有基金代码网址:
http://fund.eastmoney.com/allfund.html
>基金档案网页地址:
http://fund.eastmoney.com/f10/040008.html
>基金净值变化接口:
http://fund.eastmoney.com/f10/F10DataApi.aspx?type=lsjz&code=040008&sdate=2015-04-26&edate=2018-04-26&per=30
所需要做的便是将这些地址爬取过滤并组合,构成方便自己调用的数据接口。
在批量爬取过程中,由于node的并发特性,单次可取多条基金数据;但是经过测试,一次性并发获取所有共7000多条数据时,并发量过大导致一些请求可能会得不到返回结果,故将单次的并发量控制在1000内,再测试可完整取到所有数据。
>爬取的所有基金基本信息存入mongodb如下:
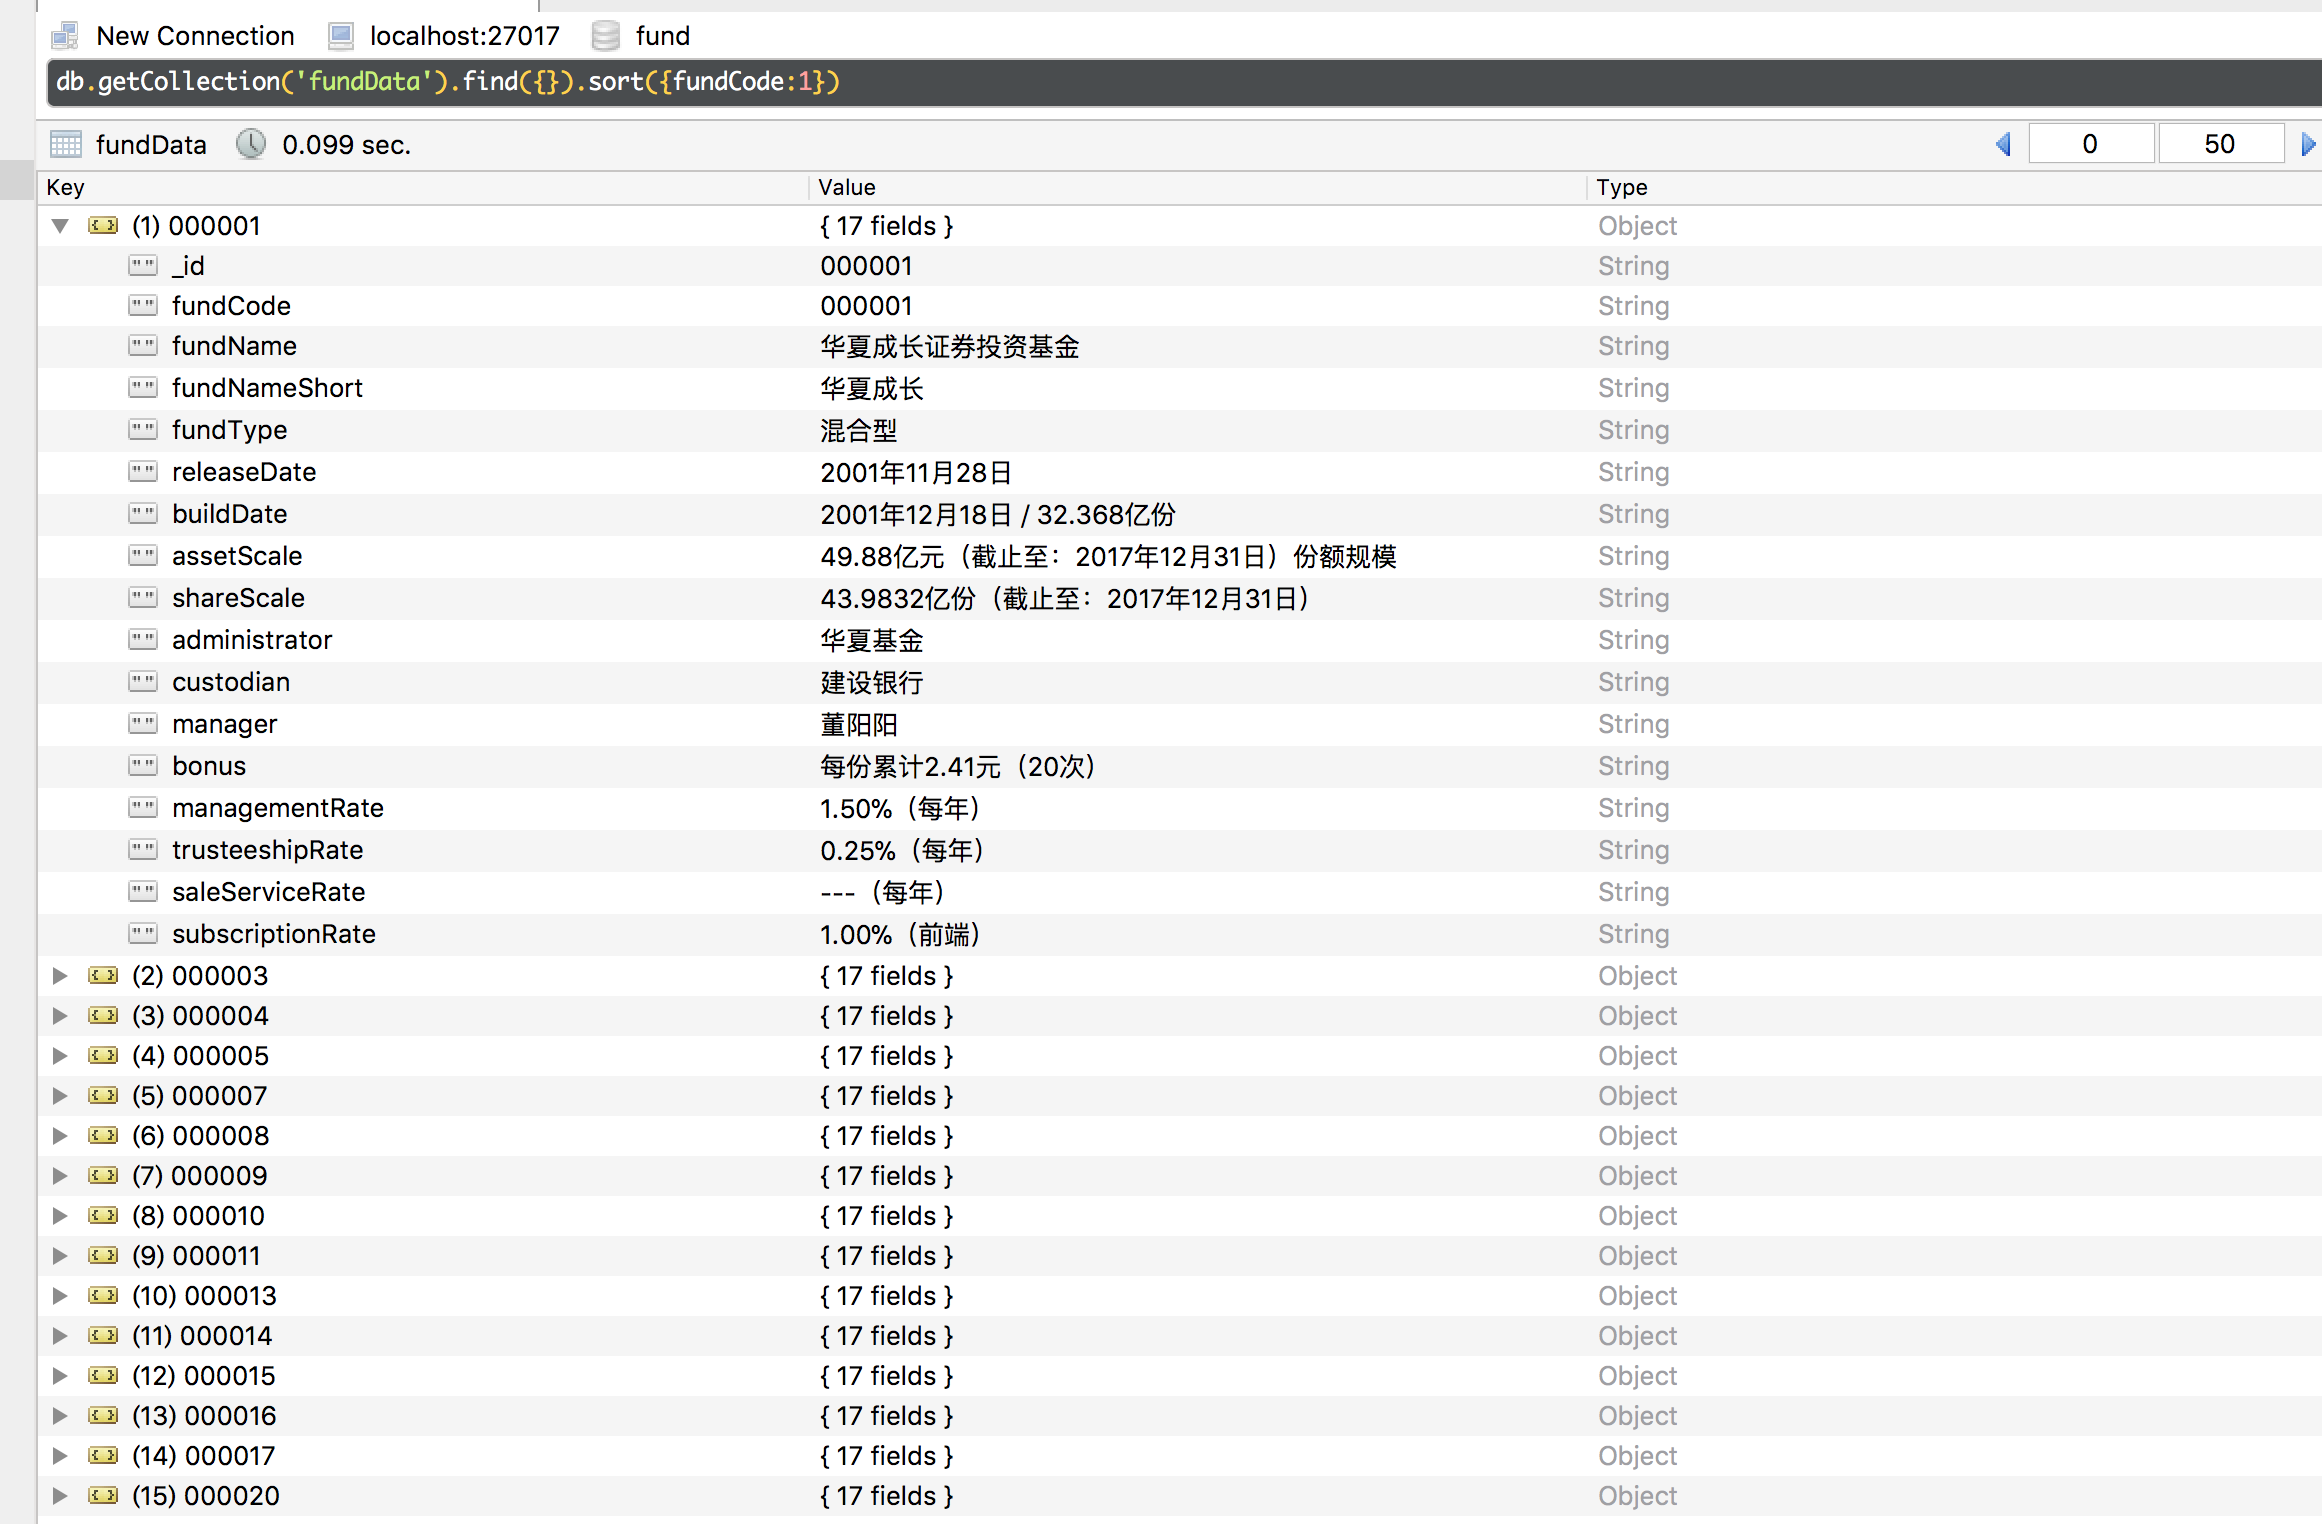
---
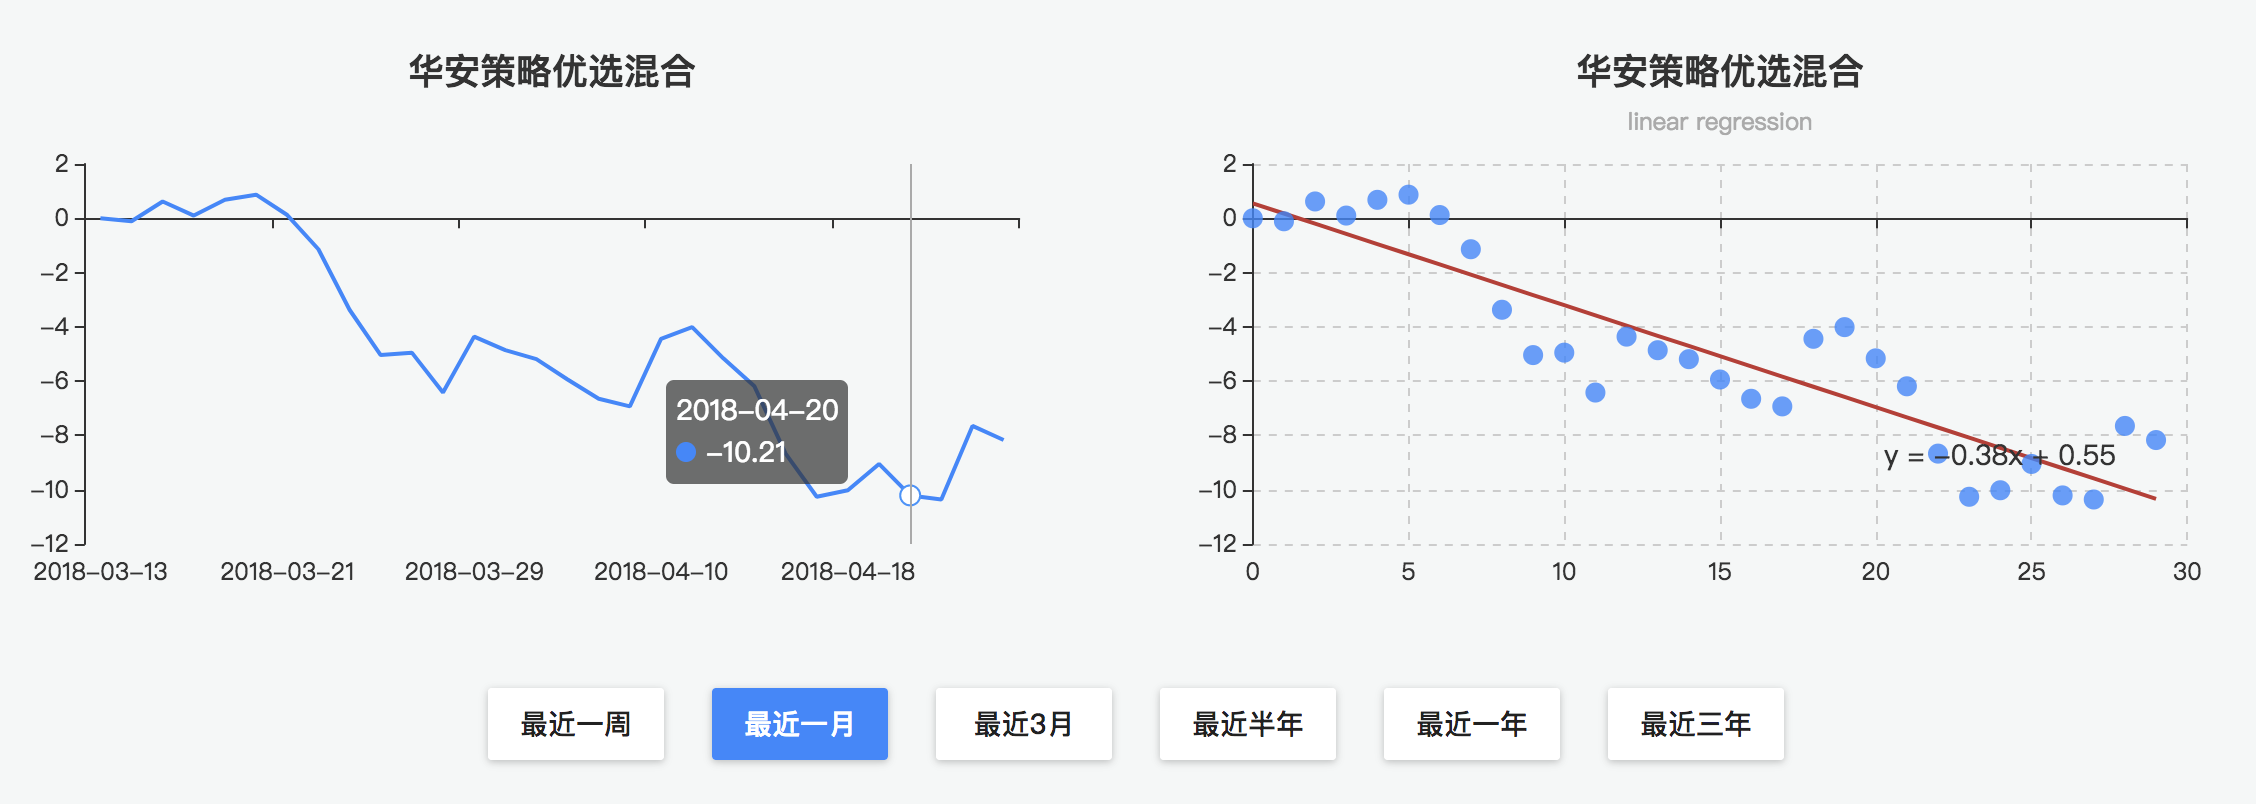
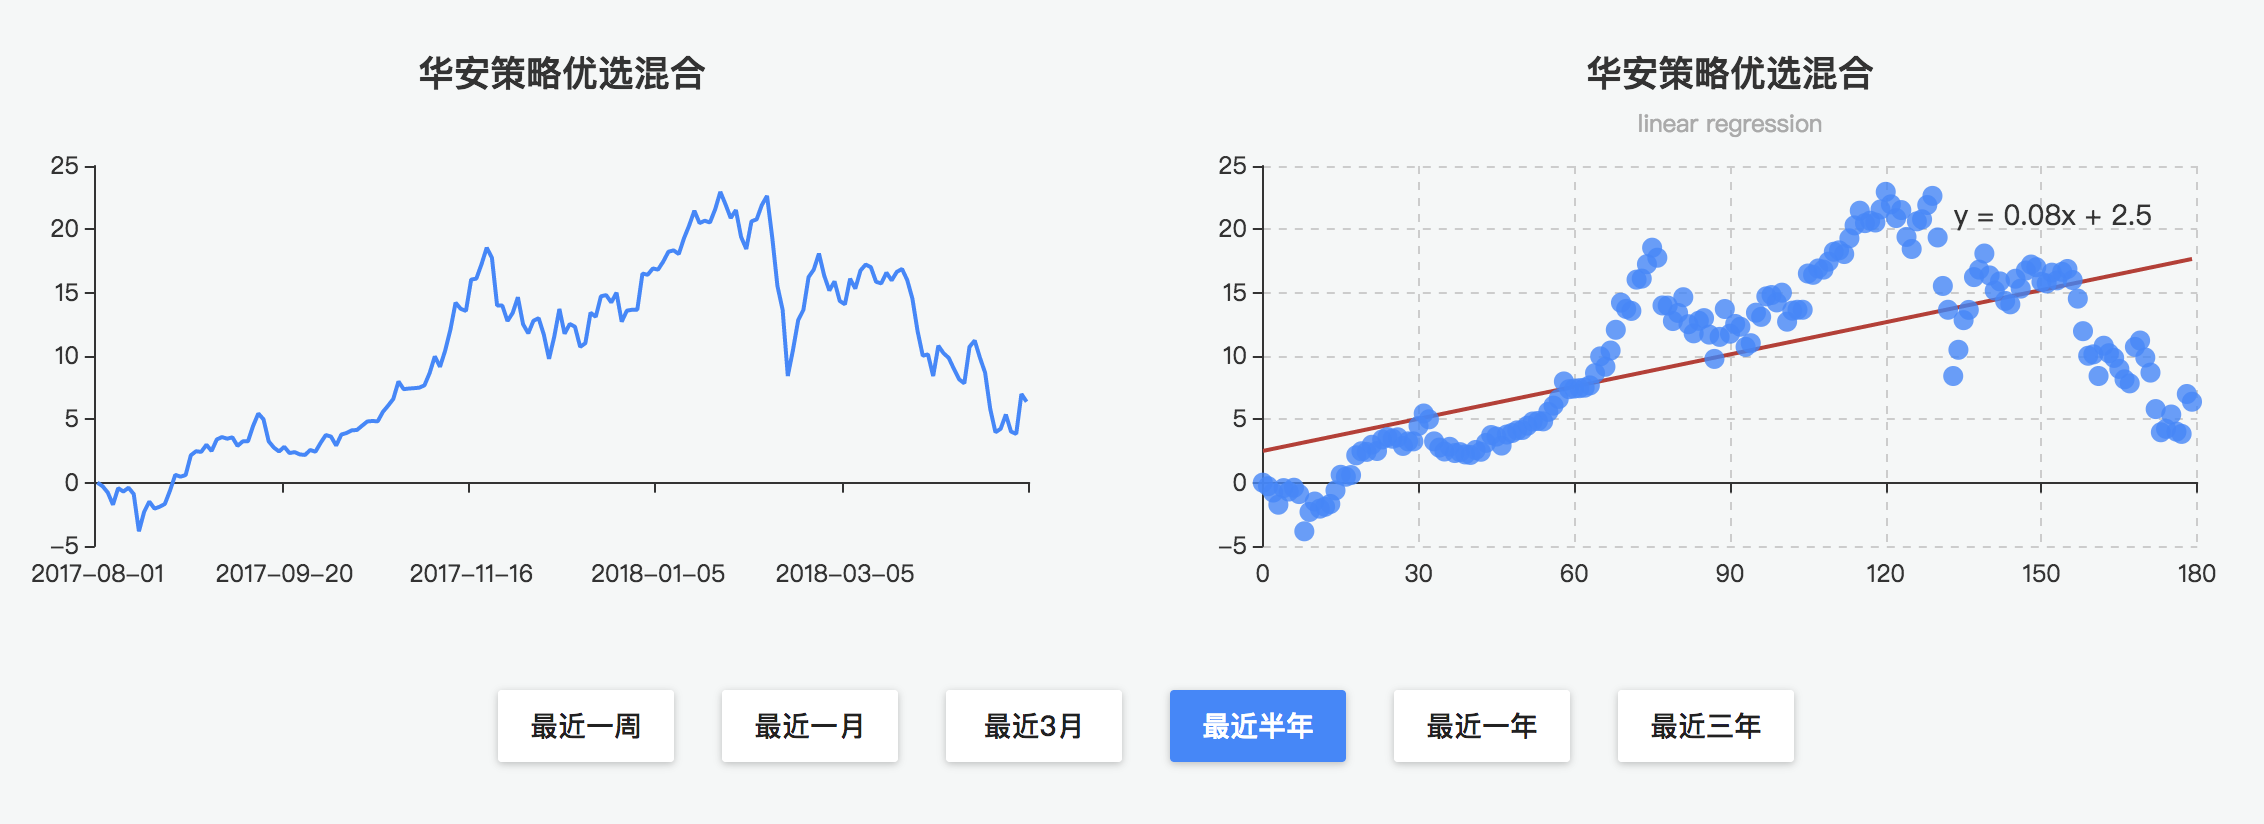
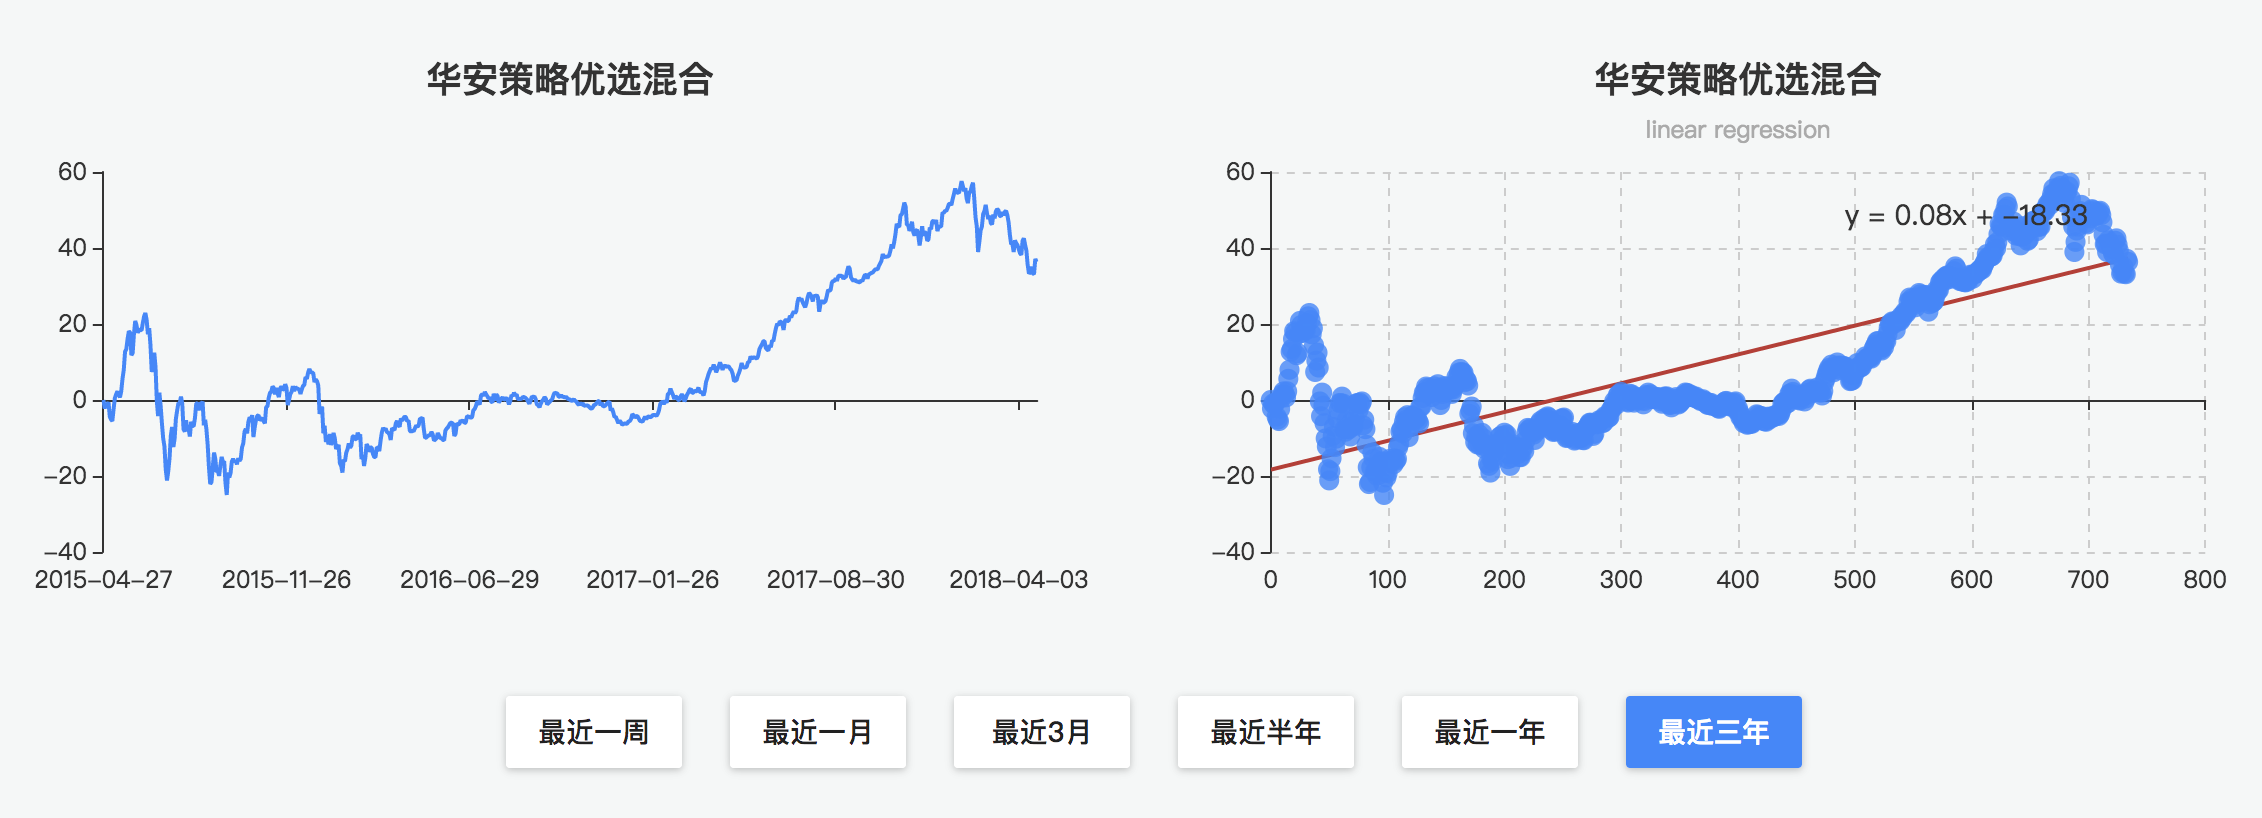
有了所有固定格式的基金数据,不放做个图表呈现出来看看。
使用[Echart](http://echarts.baidu.com/) 绘制基金的增长率变化折线,模仿蚂蚁财富中可分时段查看基金净值相对变化率的形式,除此之外还可加上该时段数据的线性回归分析,根据回归线及其斜率可直观看出该时段内的基金走势;当然,数学大神还可以加以利用,做高阶的曲线拟合,甚至做数据预测。(实不相瞒,下一步的目标是做成简单的基金预测筛选推荐,保住自己的韭菜苗...)
`前端侧获取基金数据后还需做简单处理`
效果如下: