Ecosyste.ms: Awesome
An open API service indexing awesome lists of open source software.
https://github.com/everestate/chartjs-plugin-waterfall
Makes waterfall charts easy with chartjs-2
https://github.com/everestate/chartjs-plugin-waterfall
Last synced: 3 months ago
JSON representation
Makes waterfall charts easy with chartjs-2
- Host: GitHub
- URL: https://github.com/everestate/chartjs-plugin-waterfall
- Owner: everestate
- License: mit
- Created: 2021-02-05T16:23:37.000Z (over 3 years ago)
- Default Branch: master
- Last Pushed: 2021-02-05T17:50:32.000Z (over 3 years ago)
- Last Synced: 2024-02-15T01:42:44.220Z (4 months ago)
- Language: JavaScript
- Homepage:
- Size: 63.5 KB
- Stars: 15
- Watchers: 2
- Forks: 4
- Open Issues: 1
-
Metadata Files:
- Readme: README.md
- License: LICENSE.md
Lists
- awesome - waterfall
README
### Installation
`npm install --save chartjs-plugin-waterfall`
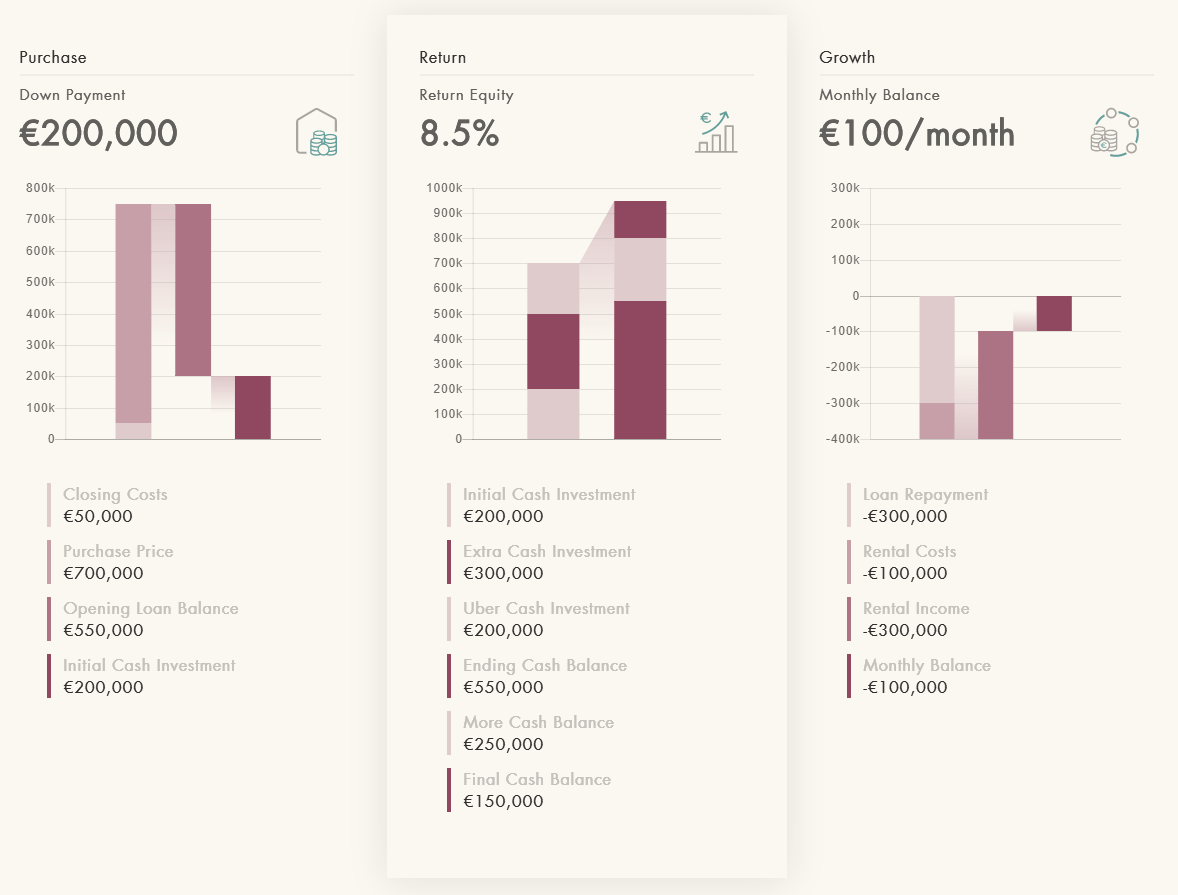
Here's what it looks like:

### Usage
Just import the plugin and add it to any chart that you want to be a waterfall chart like so:
`import waterFallPlugin from 'chartjs-plugin-waterfall';`
```js
var chart = new Chart(ctx, {
plugins: [waterFallPlugin]
});
```
Example gist by @EdwinChua: https://gist.github.com/EdwinChua/0a5d66dc561fe7d3866021b18a320585
See the [plugins](http://www.chartjs.org/docs/latest/developers/plugins.html) documentation for more info.
### How it works
This plugin works by checking if any of your datasets contain a property called `dummyStack` that is set to true.
The `stack` property must be used in conjunction with `dummyStack` for this plugin to work properly.
If `dummyStack` is true then it hides the label, tooltip and sets the color invisible. When you use stacking with this it creates the affect
of a floating bar as shown in the image above that we can use for waterfall charts as chartjs-2 doesn't support waterfall charts
by default.
E.g:
```js
const data = {
datasets: [
{
label: 'Closing Costs',
data: [50],
backgroundColor: '#e8cdd7',
stack: 'stack 1',
},
{
label: 'Purchase Price',
data: [700],
backgroundColor: '#d29baf',
stack: 'stack 1',
},
{
data: [200],
waterfall: {
dummyStack: true,
},
stack: 'stack 2',
},
{
label: 'Opening Loan Balance',
data: [550],
backgroundColor: '#bb6987',
stack: 'stack 2',
},
{
label: 'Initial Cash Investment',
data: [200],
backgroundColor: '#a53860',
stack: 'stack 3',
},
],
};
```
This dataset will give us the look in the image above.
### Options
The plugin options can be changed at 3 different levels:
globally: Chart.defaults.global.plugins.waterfall.*
per chart: options.plugins.waterfall.*
per dataset: dataset.waterfall.* (not all options)
The default chart options are:
```js
options: {
plugins: {
waterFallPlugin: {
stepLines: {
enabled: true,
startColorStop: 0,
endColorStop: 0.6,
startColor: 'rgba(0, 0, 0, 0.55)',
endColor: 'rgba(0, 0, 0, 0)',
diagonalStepLines: true,
},
},
},
}
```
Dataset options:
`dummyStack`: (boolean) If true then hides the tooltip, legend and sets the color to transparent.
Global/Chart options:
`stepLines.enabled`: (boolean) If true then it shows the step-lines going from one bar to another.
Global/Chart/Dataset options:
`stepLines.startColorStop`: (number) Used as the offset value in the first [`addColorStop`](https://developer.mozilla.org/en-US/docs/Web/API/CanvasGradient/addColorStop) method call.
`stepLines.startColor`: (string) Used as the color value in the first [`addColorStop`](https://developer.mozilla.org/en-US/docs/Web/API/CanvasGradient/addColorStop) method call.
`stepLines.endColorStop`: (number) Used as the offset value in the second [`addColorStop`](https://developer.mozilla.org/en-US/docs/Web/API/CanvasGradient/addColorStop) method call.
`stepLines.endColor`: (string) Used as the color value in the second [`addColorStop`](https://developer.mozilla.org/en-US/docs/Web/API/CanvasGradient/addColorStop) method call.
For lines going from bar to bar that you need maximum customization over, see [chartjs-plugin-custom-lines](https://github.com/everestate/chartjs-plugin-custom-lines).
### Caveats
- Multiple values in `data` currently are not supported by this plugin.
- The invisible dummy stacks are removed from the [tooltip](http://www.chartjs.org/docs/latest/configuration/tooltip.html#filter-callback)
and [legend](http://www.chartjs.org/docs/latest/configuration/legend.html#legend-label-configuration) by default using the `filter` method.
If you are providing your own filter method, using a custom tooltip or legend of your own then you will have to manually hide them because it will overwrite this plugins.
E.g. This is how this plugin hides them, so you could do it this way:
```js
filter: function(legendItem, chartData) {
var currentDataset = chartData.datasets[legendItem.datasetIndex];
return !currentDataset.dummyStack;
}
```