Ecosyste.ms: Awesome
An open API service indexing awesome lists of open source software.
https://github.com/giginet/xcprofiler
:chart_with_upwards_trend: CLI to profile compilation time of Swift project
https://github.com/giginet/xcprofiler
Last synced: about 2 months ago
JSON representation
:chart_with_upwards_trend: CLI to profile compilation time of Swift project
- Host: GitHub
- URL: https://github.com/giginet/xcprofiler
- Owner: giginet
- License: mit
- Created: 2016-12-21T08:25:30.000Z (over 7 years ago)
- Default Branch: master
- Last Pushed: 2019-10-11T07:34:17.000Z (over 4 years ago)
- Last Synced: 2024-04-20T06:41:28.986Z (2 months ago)
- Language: Ruby
- Homepage:
- Size: 1.05 MB
- Stars: 331
- Watchers: 8
- Forks: 13
- Open Issues: 6
-
Metadata Files:
- Readme: README.md
- License: LICENSE
Lists
- awesome-swift - xcprofiler - Command line utility to profile compilation time. (Benchmark / Vim)
- awesome-swift - xcprofiler - Command line utility to profile compilation time. (Benchmark / Vim)
- awesome-swifty - xcprofiler - Command line utility to profile compilation time. (Benchmark / Vim)
- awesome-swift4 - xcprofiler - Command line utility to profile compilation time. (Benchmark / Vim)
- awesome-swifte - xcprofiler - Command line utility to profile compilation time. (Benchmark / Vim)
- fucking-awesome-swift - xcprofiler - Command line utility to profile compilation time. (Benchmark / Vim)
- awesome-swiftxx - xcprofiler - Command line utility to profile compilation time. (Benchmark / Vim)
- awesome-stars - giginet/xcprofiler - :chart_with_upwards_trend: CLI to profile compilation time of Swift project (Ruby)
- awesome-stars - giginet/xcprofiler - :chart_with_upwards_trend: CLI to profile compilation time of Swift project (Ruby)
- awesome-swiftqq - xcprofiler - Command line utility to profile compilation time. (Benchmark / Vim)
- awesome-swift - xcprofiler - Command line utility to profile compilation time. (Benchmark / Vim)
- awesome-swift - xcprofiler - CLI to profile compilation time of Swift project ` 📝 2 years ago ` (Benchmark [🔝](#readme))
README
# xcprofiler
[](https://travis-ci.org/giginet/xcprofiler)
[](https://coveralls.io/github/giginet/xcprofiler?branch=master)
[](https://badge.fury.io/rb/xcprofiler)
[](https://badge.fury.io/rb/xcprofiler)
[](LICENSE)
Command line utility to profile compilation time of Swift project.
This tool is developed in working time for Cookpad.
## Installation
```
gem install xcprofiler
```
xcprofiler is tested on latest Ruby 2.3/2.4.
## Usage
1. Add `-Xfrontend -debug-time-function-bodies` build flags in `Build Settings` -> `Other Swift Flags` section of your Xcode project.

2. Build your project
3. Execute `xcprofiler`
```
$ xcprofiler [PRODUCT_NAME or ACTIVITY_LOG_PATH] [options]
```
`xcprofiler` searches the latest build log on your DerivedData directory.
You can also specify the `.xcactivitylog`.
```
$ xcprofiler MyApp
$ xcprofiler ~/Library/Developer/Xcode/DerivedData/MyApp-xxxxxxxxxxx/Logs/Build/0761C73D-3B6C-449A-BE89-6D11DAB748FE.xcactivitylog
```
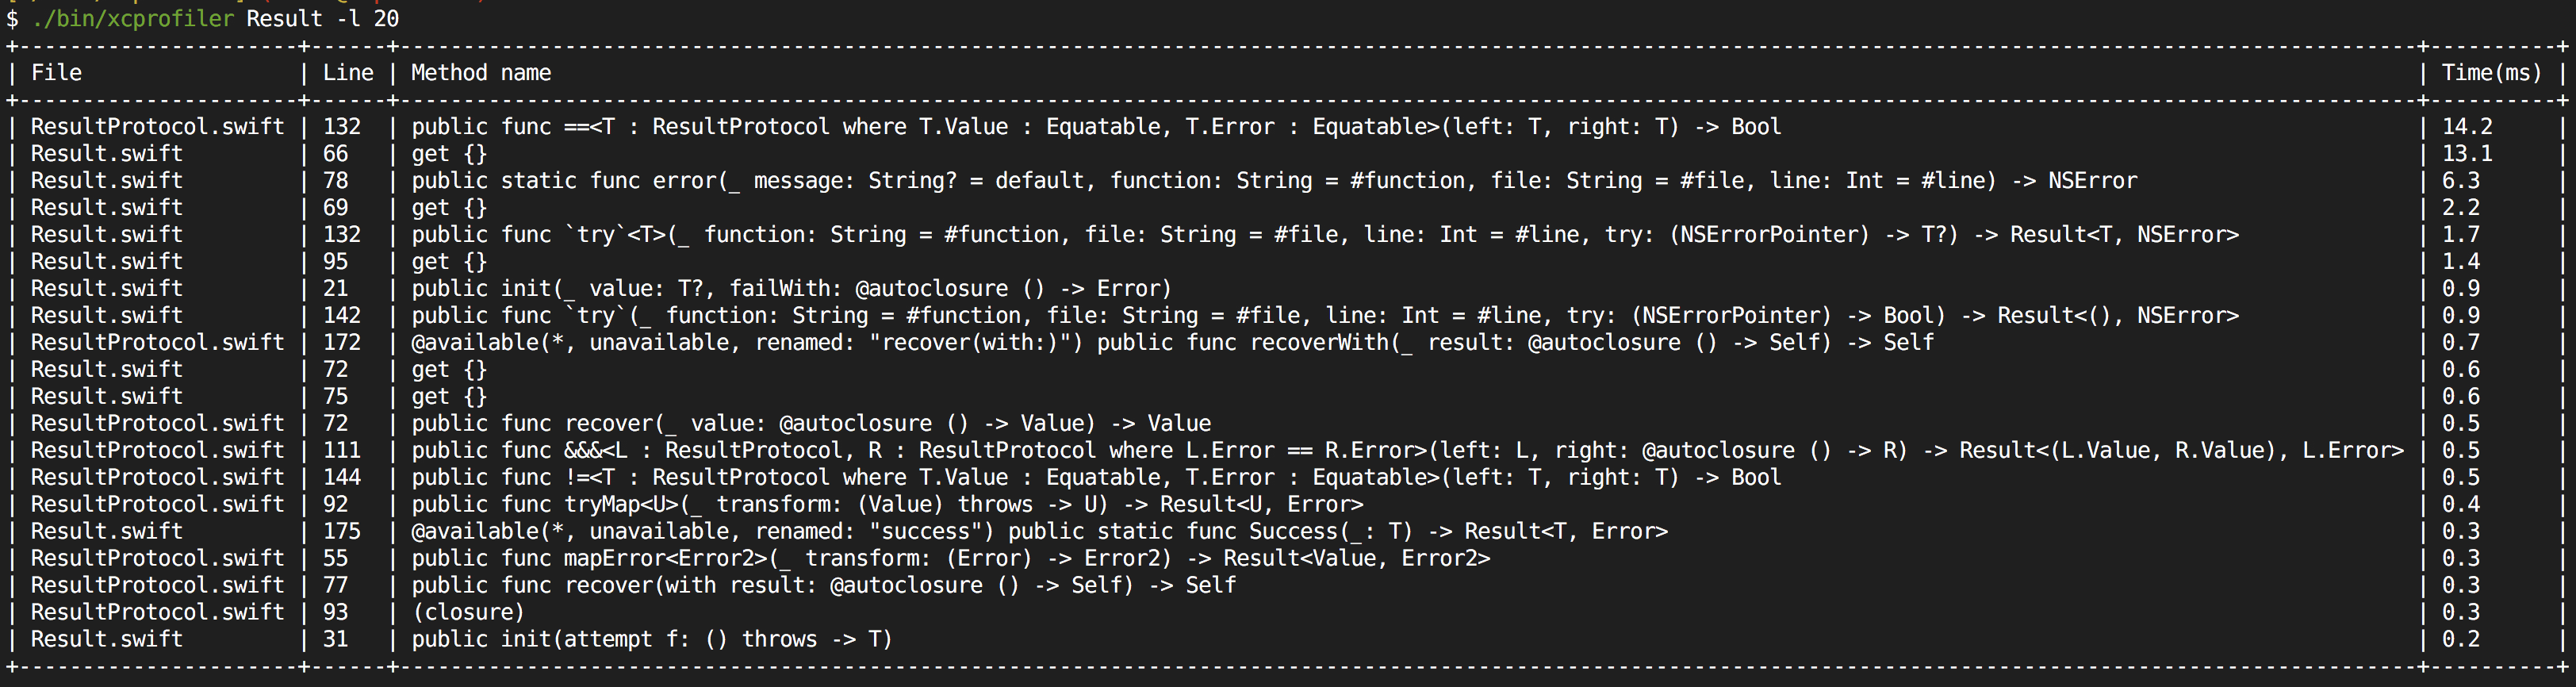
Sample output is here
```
+----------------------+------+---------------------------------------------------------------------------------------------------------------------------------------------------------------+----------+
| File | Line | Method name | Time(ms) |
+----------------------+------+---------------------------------------------------------------------------------------------------------------------------------------------------------------+----------+
| ResultProtocol.swift | 132 | public func ==(left: T, right: T) -> Bool | 14.2 |
| Result.swift | 66 | get {} | 13.1 |
| Result.swift | 78 | public static func error(_ message: String? = default, function: String = #function, file: String = #file, line: Int = #line) -> NSError | 6.3 |
| Result.swift | 69 | get {} | 2.2 |
| Result.swift | 132 | public func `try`(_ function: String = #function, file: String = #file, line: Int = #line, try: (NSErrorPointer) -> T?) -> Result | 1.7 |
| Result.swift | 95 | get {} | 1.4 |
| Result.swift | 21 | public init(_ value: T?, failWith: @autoclosure () -> Error) | 0.9 |
| Result.swift | 142 | public func `try`(_ function: String = #function, file: String = #file, line: Int = #line, try: (NSErrorPointer) -> Bool) -> Result<(), NSError> | 0.9 |
| ResultProtocol.swift | 172 | @available(*, unavailable, renamed: "recover(with:)") public func recoverWith(_ result: @autoclosure () -> Self) -> Self | 0.7 |
| Result.swift | 72 | get {} | 0.6 |
| Result.swift | 75 | get {} | 0.6 |
| ResultProtocol.swift | 72 | public func recover(_ value: @autoclosure () -> Value) -> Value | 0.5 |
| ResultProtocol.swift | 111 | public func &&&(left: L, right: @autoclosure () -> R) -> Result<(L.Value, R.Value), L.Error> | 0.5 |
| ResultProtocol.swift | 144 | public func !=(left: T, right: T) -> Bool | 0.5 |
| ResultProtocol.swift | 92 | public func tryMap(_ transform: (Value) throws -> U) -> Result | 0.4 |
| Result.swift | 175 | @available(*, unavailable, renamed: "success") public static func Success(_: T) -> Result | 0.3 |
| ResultProtocol.swift | 55 | public func mapError(_ transform: (Error) -> Error2) -> Result | 0.3 |
| ResultProtocol.swift | 77 | public func recover(with result: @autoclosure () -> Self) -> Self | 0.3 |
| ResultProtocol.swift | 93 | (closure) | 0.3 |
| Result.swift | 31 | public init(attempt f: () throws -> T) | 0.2 |
+----------------------+------+---------------------------------------------------------------------------------------------------------------------------------------------------------------+----------+
```
### Available Options
|option|shorthand|description|
|------|---------|-----------|
|--limit|-l|Limit for display|
|--threshold||Threshold of time to display (ms)|
|--show-invalids||Show invalid location results|
|--order|-o|Sort order (default,time,file)|
|--derived-data-path||Root path of DerivedData directory|
|--truncate-at|-t|Truncate the method name with specified length|
|--no-unique||Show the duplicated results|
## Use custom reporters
You can use reporters to output tracking logs.
```ruby
require 'xcprofiler'
profiler = Xcprofiler::Profiler.by_product_name('MyApp')
profiler.reporters = [
Xcprofiler::StandardOutputReporter.new(limit: 20, order: :time),
Xcprofiler::JSONReporter.new(output_path: 'result.json'),
Xcprofiler::BlockReporter.new do |executions|
do_something(executions)
end,
]
profiler.report!
```
You can also implement your own reporters.
See implementation of [built-in reporters](https://github.com/giginet/xcprofiler/tree/master/lib/xcprofiler/reporters) for detail.
## danger-xcprofiler
You can integrate xcprofiler to [danger](https://github.com/danger/danger).
https://github.com/giginet/danger-xcprofiler
## License
MIT License
## Contributing
Bug reports and pull requests are welcome on GitHub at https://github.com/giginet/xcprofiler.