Ecosyste.ms: Awesome
An open API service indexing awesome lists of open source software.
https://github.com/AppPear/ChartView
ChartView made in SwiftUI
https://github.com/AppPear/ChartView
chart charts ios swift swiftui
Last synced: about 2 months ago
JSON representation
ChartView made in SwiftUI
- Host: GitHub
- URL: https://github.com/AppPear/ChartView
- Owner: AppPear
- License: mit
- Created: 2019-06-12T18:38:58.000Z (about 5 years ago)
- Default Branch: master
- Last Pushed: 2023-11-30T00:38:51.000Z (7 months ago)
- Last Synced: 2024-03-30T19:21:24.854Z (3 months ago)
- Topics: chart, charts, ios, swift, swiftui
- Language: Swift
- Homepage:
- Size: 4.6 MB
- Stars: 5,181
- Watchers: 101
- Forks: 644
- Open Issues: 99
-
Metadata Files:
- Readme: README.md
- License: LICENSE
Lists
- awesome-swift - ChartView - Swift package for displaying beautiful charts effortlessly (Libs / Chart)
- awesome-stars - ChartView
- awesome-stars - ChartView
- awesome-swiftui-libraries - ChartView - ChartView made in SwiftUI (Chart / Content)
- awesome-swifte - ChartView - Swift package for displaying beautiful charts effortlessly (Libs / Chart)
- awesome-swifty - ChartView - Swift package for displaying beautiful charts effortlessly (Libs / Chart)
- awesome-swift4 - ChartView - Swift package for displaying beautiful charts effortlessly (Libs / Chart)
- awesome-swiftui - ChartView - ChartView made in SwiftUI (UI / Chart)
- fucking-awesome-swift - ChartView - Swift package for displaying beautiful charts effortlessly (Libs / Chart)
- my-awesome-stars - AppPear/ChartView - ChartView made in SwiftUI (Swift)
- awesome-stars - AppPear/ChartView - ChartView made in SwiftUI (Swift)
- awesome-github-star - ChartView
- awesome-starts - AppPear/ChartView - ChartView made in SwiftUI (Swift)
- awesome-swiftxx - ChartView - Swift package for displaying beautiful charts effortlessly (Libs / Chart)
- awesome-swiftqq - ChartView - Swift package for displaying beautiful charts effortlessly (Libs / Chart)
- awesome-swift - ChartView - Swift package for displaying beautiful charts effortlessly (Libs / Chart)
- artsz-awesome - AppPear/ChartView - ChartView made in SwiftUI (Swift)
- awesome-stars - AppPear/ChartView - ChartView made in SwiftUI (Swift)
- awesome-stars - ChartView - ChartView made in SwiftUI (Swift)
- awesome-swiftui - ChartView made in SwiftUI
- fucking-about-SwiftUI - ChartView in SwiftUI
- awesome-swift - ChartView - ChartView made in SwiftUI ` 📝 3 months ago ` (Chart [🔝](#readme))
README
# SwiftUICharts
Swift package for displaying charts effortlessly.
## V2 Beta is here 🎉🎉🎉
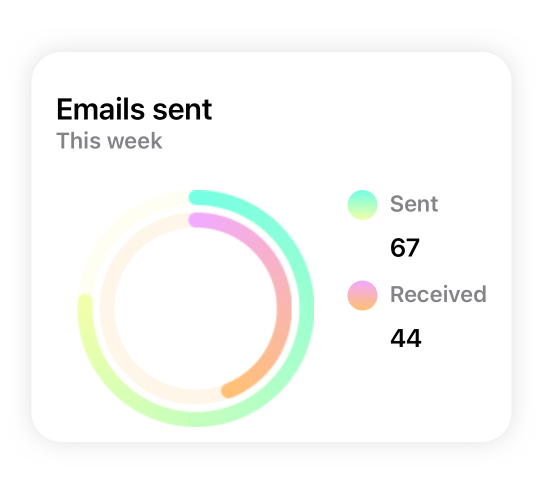
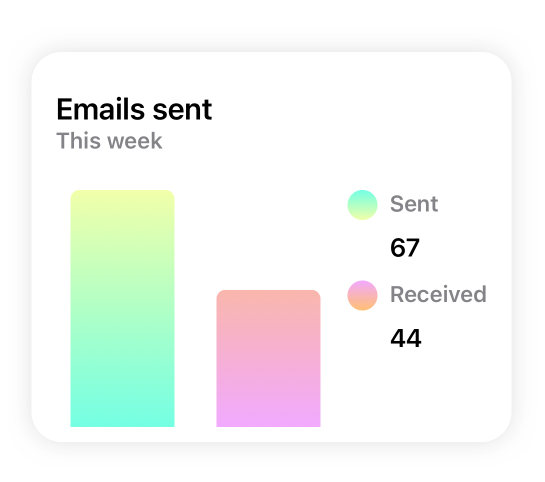
V2 focuses on providing a strong and easy to use base, on which you can build your beautiful custom charts. It provides basic building blocks, like a chart view (bar, pie, line and ring chart), grid view, card view, interactive label for displaying the curent chart value.
So you decide, whether you build a fully fledged interactive view, or just display a bare bone chart
* [How to install SwiftUI ChartView](https://github.com/AppPear/ChartView/wiki/How-to-install-SwiftUI-ChartView)
* [How to create your first chart](https://github.com/AppPear/ChartView/wiki/How-to-create-your-first-chart)
### It supports interactions and animations


### It is fully customizable, and works together with native SwiftUI elements well

## Original (stable) version:

### Usage
It supports:
* Line charts
* Bar charts
* Pie charts
### Slack
Join our Slack channel for day to day conversation and more insights:
[Slack invite link](https://join.slack.com/t/swiftuichartview/shared_invite/zt-g6mxioq8-j3iUTF1YKX7D23ML3qcc4g)
### Installation:
It requires iOS 13 and Xcode 11!
In Xcode go to `File -> Swift Packages -> Add Package Dependency` and paste in the repo's url: `https://github.com/AppPear/ChartView`
### Usage:
import the package in the file you would like to use it: `import SwiftUICharts`
You can display a Chart by adding a chart view to your parent view:
### Demo
Added an example project, with **iOS, watchOS** target: https://github.com/AppPear/ChartViewDemo
## Line charts
**LineChartView with multiple lines!**
First release of this feature, interaction is disabled for now, I'll figure it out how could be the best to interact with multiple lines with a single touch.

Usage:
```swift
MultiLineChartView(data: [([8,32,11,23,40,28], GradientColors.green), ([90,99,78,111,70,60,77], GradientColors.purple), ([34,56,72,38,43,100,50], GradientColors.orngPink)], title: "Title")
```
Gradient colors are now under the `GradientColor` struct you can create your own gradient by `GradientColor(start: Color, end: Color)`
Available preset gradients:
* orange
* blue
* green
* blu
* bluPurpl
* purple
* prplPink
* prplNeon
* orngPink
**Full screen view called LineView!!!**
```swift
LineView(data: [8,23,54,32,12,37,7,23,43], title: "Line chart", legend: "Full screen") // legend is optional, use optional .padding()
```
Adopts to dark mode automatically


You can add your custom darkmode style by specifying:
```swift
let myCustomStyle = ChartStyle(...)
let myCutsomDarkModeStyle = ChartStyle(...)
myCustomStyle.darkModeStyle = myCutsomDarkModeStyle
```
**Line chart is interactive, so you can drag across to reveal the data points**
You can add a line chart with the following code:
```swift
LineChartView(data: [8,23,54,32,12,37,7,23,43], title: "Title", legend: "Legendary") // legend is optional
```
**Turn drop shadow off by adding to the Initialiser: `dropShadow: false`**
## Bar charts
**[New feature] you can display labels also along values and points for each bar to descirbe your data better!**
**Bar chart is interactive, so you can drag across to reveal the data points**
You can add a bar chart with the following code:
Labels and points:
```swift
BarChartView(data: ChartData(values: [("2018 Q4",63150), ("2019 Q1",50900), ("2019 Q2",77550), ("2019 Q3",79600), ("2019 Q4",92550)]), title: "Sales", legend: "Quarterly") // legend is optional
```
Only points:
```swift
BarChartView(data: ChartData(points: [8,23,54,32,12,37,7,23,43]), title: "Title", legend: "Legendary") // legend is optional
```
**ChartData** structure
Stores values in data pairs (actually tuple): `(String,Double)`
* you can have duplicate values
* keeps the data order
You can initialise ChartData multiple ways:
* For integer values: `ChartData(points: [8,23,54,32,12,37,7,23,43])`
* For floating point values: `ChartData(points: [2.34,3.14,4.56])`
* For label,value pairs: `ChartData(values: [("2018 Q4",63150), ("2019 Q1",50900)])`
You can add different formats:
* Small `ChartForm.small`
* Medium `ChartForm.medium`
* Large `ChartForm.large`
```swift
BarChartView(data: ChartData(points: [8,23,54,32,12,37,7,23,43]), title: "Title", form: ChartForm.small)
```
For floating point numbers, you can set a custom specifier:
```swift
BarChartView(data: ChartData(points:[1.23,2.43,3.37]) ,title: "A", valueSpecifier: "%.2f")
```
For integers you can disable by passing: `valueSpecifier: "%.0f"`
You can set your custom image in the upper right corner by passing in the initialiser: `cornerImage:Image(systemName: "waveform.path.ecg")`
**Turn drop shadow off by adding to the Initialiser: `dropShadow: false`**
### You can customize styling of the chart with a ChartStyle object:
Customizable:
* background color
* accent color
* second gradient color
* text color
* legend text color
```swift
let chartStyle = ChartStyle(backgroundColor: Color.black, accentColor: Colors.OrangeStart, secondGradientColor: Colors.OrangeEnd, chartFormSize: ChartForm.medium, textColor: Color.white, legendTextColor: Color.white )
...
BarChartView(data: [8,23,54,32,12,37,7,23,43], title: "Title", style: chartStyle)
```
You can access built-in styles:
```swift
BarChartView(data: [8,23,54,32,12,37,7,23,43], title: "Title", style: Styles.barChartMidnightGreen)
```
#### All styles available as a preset:
* barChartStyleOrangeLight
* barChartStyleOrangeDark
* barChartStyleNeonBlueLight
* barChartStyleNeonBlueDark
* barChartMidnightGreenLight
* barChartMidnightGreenDark


### You can customize the size of the chart with a ChartForm object:
**ChartForm**
* `.small`
* `.medium`
* `.large`
* `.detail`
```swift
BarChartView(data: [8,23,54,32,12,37,7,23,43], title: "Title", form: ChartForm.small)
```
### You can choose whether bar is animated or not after completing your gesture.
If you want to animate back movement after completing your gesture, you set `animatedToBack` as `true`.
### WatchOS support for Bar charts:

## Pie charts
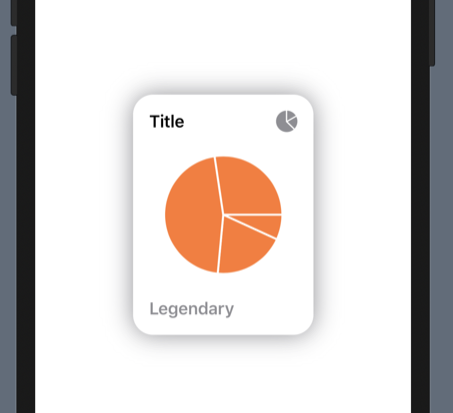
You can add a pie chart with the following code:
```swift
PieChartView(data: [8,23,54,32], title: "Title", legend: "Legendary") // legend is optional
```
**Turn drop shadow off by adding to the Initialiser: `dropShadow: false`**