Ecosyste.ms: Awesome
An open API service indexing awesome lists of open source software.
https://github.com/pyecharts/pyecharts
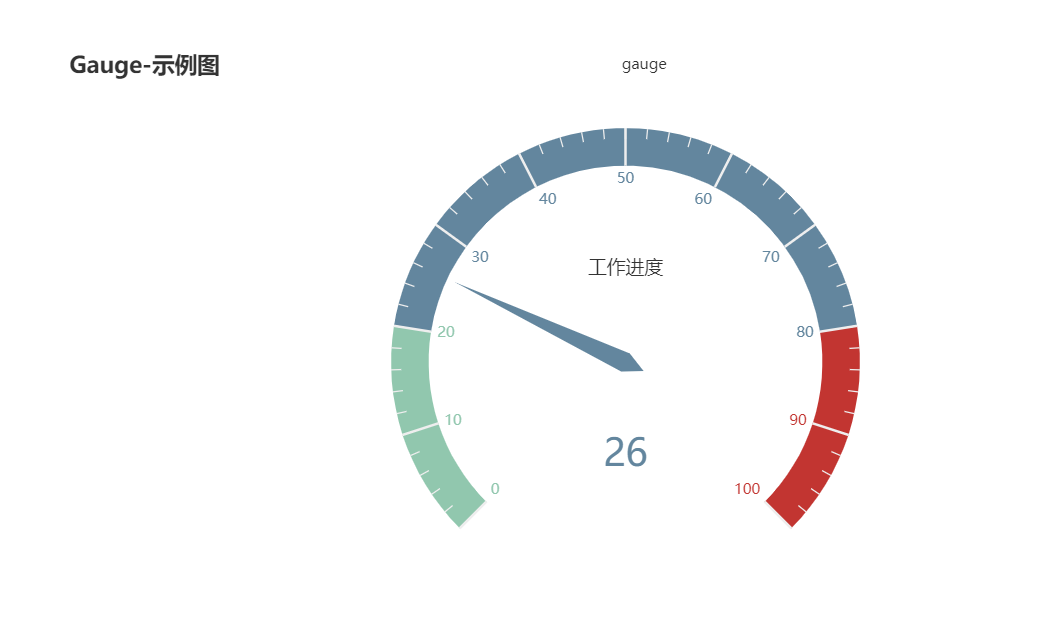
🎨 Python Echarts Plotting Library
https://github.com/pyecharts/pyecharts
echarts python
Last synced: about 2 months ago
JSON representation
🎨 Python Echarts Plotting Library
- Host: GitHub
- URL: https://github.com/pyecharts/pyecharts
- Owner: pyecharts
- License: mit
- Created: 2017-06-22T02:50:25.000Z (almost 7 years ago)
- Default Branch: master
- Last Pushed: 2024-03-27T09:20:02.000Z (3 months ago)
- Last Synced: 2024-05-02T02:57:06.400Z (about 2 months ago)
- Topics: echarts, python
- Language: Python
- Homepage: https://pyecharts.org
- Size: 94.7 MB
- Stars: 14,459
- Watchers: 379
- Forks: 2,829
- Open Issues: 14
-
Metadata Files:
- Readme: README.en.md
- Funding: .github/FUNDING.yml
- License: LICENSE
Lists
- awesome-python-data-science - pyecharts - Migrated from [Echarts](https://github.com/apache/echarts), a charting and visualization library, to Python's interactive visual drawing library.<img height="20" src="img/pyecharts.png" alt="pyecharts"> <img height="20" src="img/echarts.png" alt="echarts"> (Visualization / Interactive plots)
- awesome-jupyter - pyecharts - Python interface for the [ECharts](https://github.com/apache/incubator-echarts) visualization library. (Visualization)
- fintech-awesome-libraries - pyecharts - a charting and visualization library, to Python's interactive visual drawing library. (Data Visualization / Interactive plots)
- awesome-stars - pyecharts/pyecharts - 🎨 Python Echarts Plotting Library (Python)
- awesome-echarts - pyecharts - Python Apache ECharts Plotting Library. (Languages / Python)
- awesome-python-machine-learning-resources - GitHub - 1% open · ⏱️ 25.04.2022): (数据可视化)
- awesome-github-star - pyecharts
- -awesome-jupyter - pyecharts - Python interface for the [ECharts](https://github.com/apache/incubator-echarts) visualization library. (Visualization)
- awesome-stars - pyecharts
- awesome - pyecharts/pyecharts - 🎨 Python Echarts Plotting Library (Python)
- awesome-stars - pyecharts
- awesome-stenudd - pyecharts - 🎨 Python Echarts Plotting Library (Python)
- awesome-stars - pyecharts/pyecharts - 🎨 Python Echarts Plotting Library (Python)
- awesome-python-data-science - pyecharts - Migrated from [Echarts](https://github.com/apache/echarts), a charting and visualization library, to Python's interactive visual drawing library.<img height="20" src="img/pyecharts.png" alt="pyecharts"> <img height="20" src="img/echarts.png" alt="echarts"> (Visualization / Interactive plots)
- awesome-stars - pyecharts - 🎨 Python Echarts Plotting Library (Python)
- awesome-stars - pyecharts/pyecharts - 🎨 Python Echarts Plotting Library (Python)
- awesome-stars - pyecharts/pyecharts - 🎨 Python Echarts Plotting Library (Python)
- awesome-list - pyecharts - A Python visualization interface for Apache ECharts. (Data Visualization / Data Management)
- awesome-stars - pyecharts/pyecharts - `★14593` 🎨 Python Echarts Plotting Library (Python)
- awesome-dataviz - pyechars - Python binding for Echarts library. (Python tools / Misc)
- awesome - pyecharts/pyecharts - 🎨 Python Echarts Plotting Library (Python)
- awesome-stars - pyecharts/pyecharts - `★14439` 🎨 Python Echarts Plotting Library (Python)
- my-awesome-stars - pyecharts/pyecharts - 🎨 Python Echarts Plotting Library (Python)
README

pyecharts
Python ❤️ ECharts = pyecharts


## 📣 Introduction
[Apache ECharts](https://github.com/apache/echarts) is easy-to-use, highly interactive and highly performant javascript visualization library under Apache license. Since its first public release in 2013, it now dominates over 74% of Chinese web front-end market. Yet Python is an expressive language and is loved by data science community. Combining the strength of both technologies, [pyecharts](https://github.com/pyecharts/pyecharts) is born.
## ✨ Feature highlights
* Simple API, Sleek and method chaining
* Support 30 + popular charts
* Suppot data science tools: Jupyter Notebook, JupyterLab, nteract
* Integrate with Flask,Django at ease
* Easy to use and highly configurable
* Detailed documentation and examples.
* More than 400+ geomaps assets for geograpic information processing
## ⏳ Version
v0.5.x is not compatible with V1, which is a completely new version, see [ISSUE#892](https://github.com/pyecharts/pyecharts/issues/892), [ISSUE#1033](https://github.com/pyecharts/). pyecharts/issues/1033).
### V0.5.x
> Support for Python 2.7, 3.4+
At the discretion of the development team, version 0.5.x will no longer be maintained. Version 0.5.x code is located in the *05x* branch and documentation is located at [05x-docs.pyecharts.org](http://05x-docs.pyecharts.org).
### V1
> Python 3.6+ only
The new version series will start with v1.0.0, documented at [pyecharts.org](https://pyecharts.org); examples at [gallery.pyecharts.org](https://gallery.pyecharts.org)
### V2
> Python 3.6+ only
The new version is based on Echarts 5.4.1+ for rendering, and the documentation and examples are in the same location as V1.
## 🔰 Installation
**pip install**
```shell
$ pip install pyecharts
```
**Install from source**
```shell
$ git clone https://github.com/pyecharts/pyecharts.git
$ cd pyecharts
$ pip install -r requirements.txt
$ python setup.py install
```
## 📝 Usage
### Local computer
#### HTML
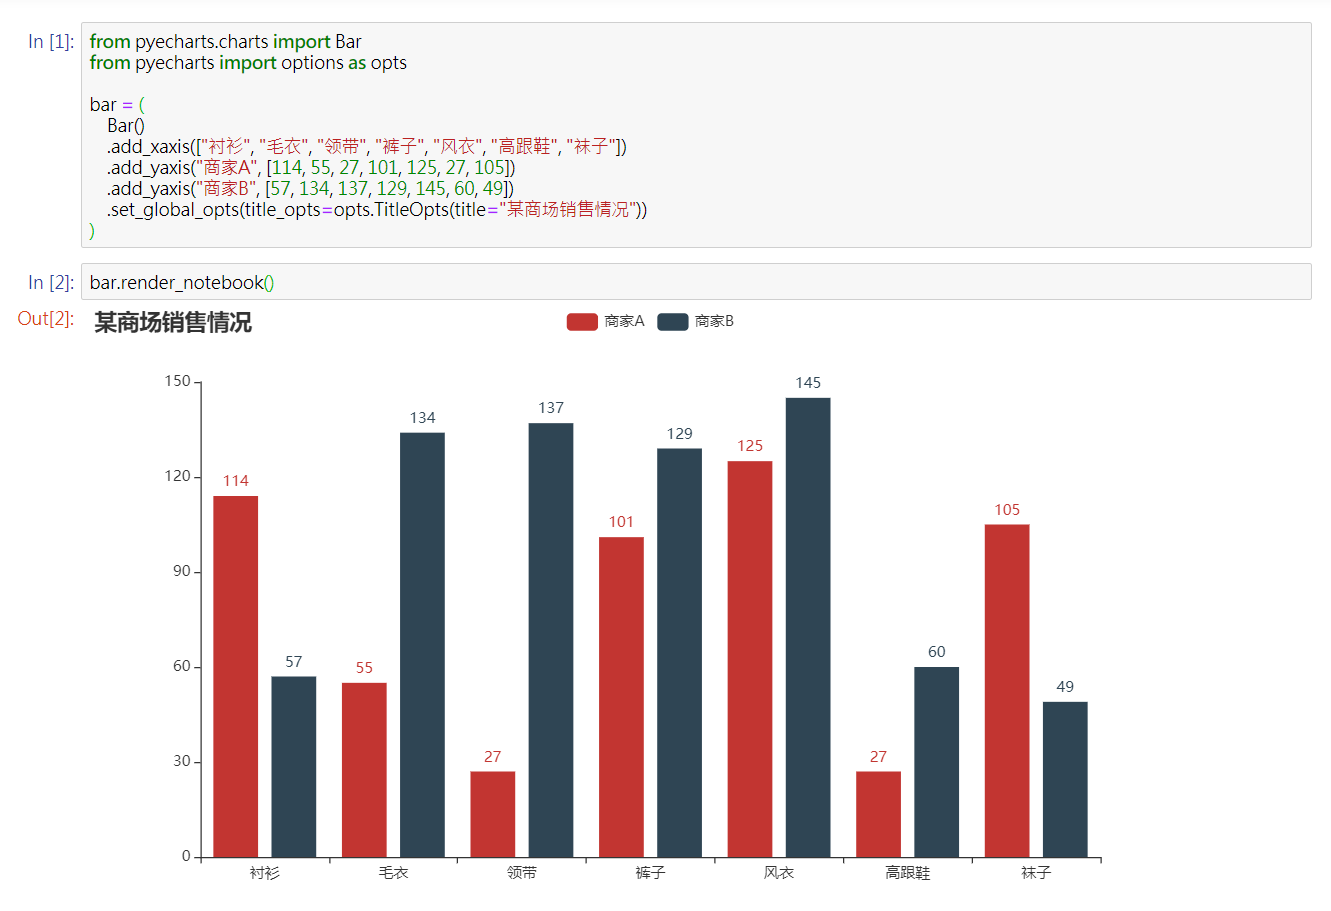
```python
from pyecharts.charts import Bar
from pyecharts import options as opts
bar = (
Bar()
.add_xaxis(["衬衫", "毛衣", "领带", "裤子", "风衣", "高跟鞋", "袜子"])
.add_yaxis("商家A", [114, 55, 27, 101, 125, 27, 105])
.add_yaxis("商家B", [57, 134, 137, 129, 145, 60, 49])
.set_global_opts(title_opts=opts.TitleOpts(title="某商场销售情况"))
)
bar.render()
```

#### image
```python
from pyecharts.render import make_snapshot
# needs to configure selenium
make_snapshot(bar.render(), "bar.png")
```

### Notebook
#### Jupyter Notebook
#### JupyterLab

#### Web framework

## 🔖 Demo


For more documentation, please visit
* [Chinese documentation](https://pyecharts.org/#/zh-cn/)
* [English Documentation](https://pyecharts.org/#/en-us/)
* [Example Documentation](https://gallery.pyecharts.org/)
## ⛏ Software development
### Unit tests
```shell
$ pip install -r test/requirements.txt
$ make
```
### Team development
[Travis CI](https://travis-ci.org/) and [AppVeyor](https://ci.appveyor.com/) is place for continuous integration.
### Coding styles
[flake8](http://flake8.pycqa.org/en/latest/index.html), [Codecov](https://codecov.io/) and [pylint](https://www.pylint.org/) are used
## 😉 Author
pyecharts are co-maintained by:
* [@chenjiandongx](https://github.com/chenjiandongx)
* [@chfw](https://github.com/chfw)
* [@kinegratii](https://github.com/kinegratii)
* [@sunhailin-Leo](https://github.com/sunhailin-Leo)
For more contributors, please visit [pyecharts/graphs/contributors](https://github.com/pyecharts/pyecharts/graphs/contributors)
## 💌 Donation
To develop and maintain pyecharts, it took me a lot of overnights. If you think pyecharts has helped you, please consider buying me a coffee:


Please also buy the other maintainer a coffee if you think their work helped you too [donation details](http://pyecharts.org/#/zh-cn/donate)
## 📃 License
MIT [©chenjiandongx](https://github.com/chenjiandongx)