Ecosyste.ms: Awesome
An open API service indexing awesome lists of open source software.
https://github.com/Ijeamakaanyene/tidytuesday
Tracking my #TidyTuesday submissions
https://github.com/Ijeamakaanyene/tidytuesday
Last synced: 3 months ago
JSON representation
Tracking my #TidyTuesday submissions
- Host: GitHub
- URL: https://github.com/Ijeamakaanyene/tidytuesday
- Owner: Ijeamakaanyene
- Created: 2020-01-28T02:52:19.000Z (over 4 years ago)
- Default Branch: master
- Last Pushed: 2021-02-24T06:31:35.000Z (over 3 years ago)
- Last Synced: 2024-01-20T15:44:15.004Z (5 months ago)
- Homepage:
- Size: 26.8 MB
- Stars: 31
- Watchers: 3
- Forks: 3
- Open Issues: 0
-
Metadata Files:
- Readme: README.md
Lists
- awesome-r-dataviz - by Ijeamakaanyene
README
# TidyTuesday Submissions
Tracking my #TidyTuesday submissions. Here is to getting better at `ggplot`!
For more information about TidyTuesday, check out the rfordatascience tidytuesday repo.
Dates: 02/22/2021 - 02/26/2021
Output: 2021-07
BLS: Earnings and Employment
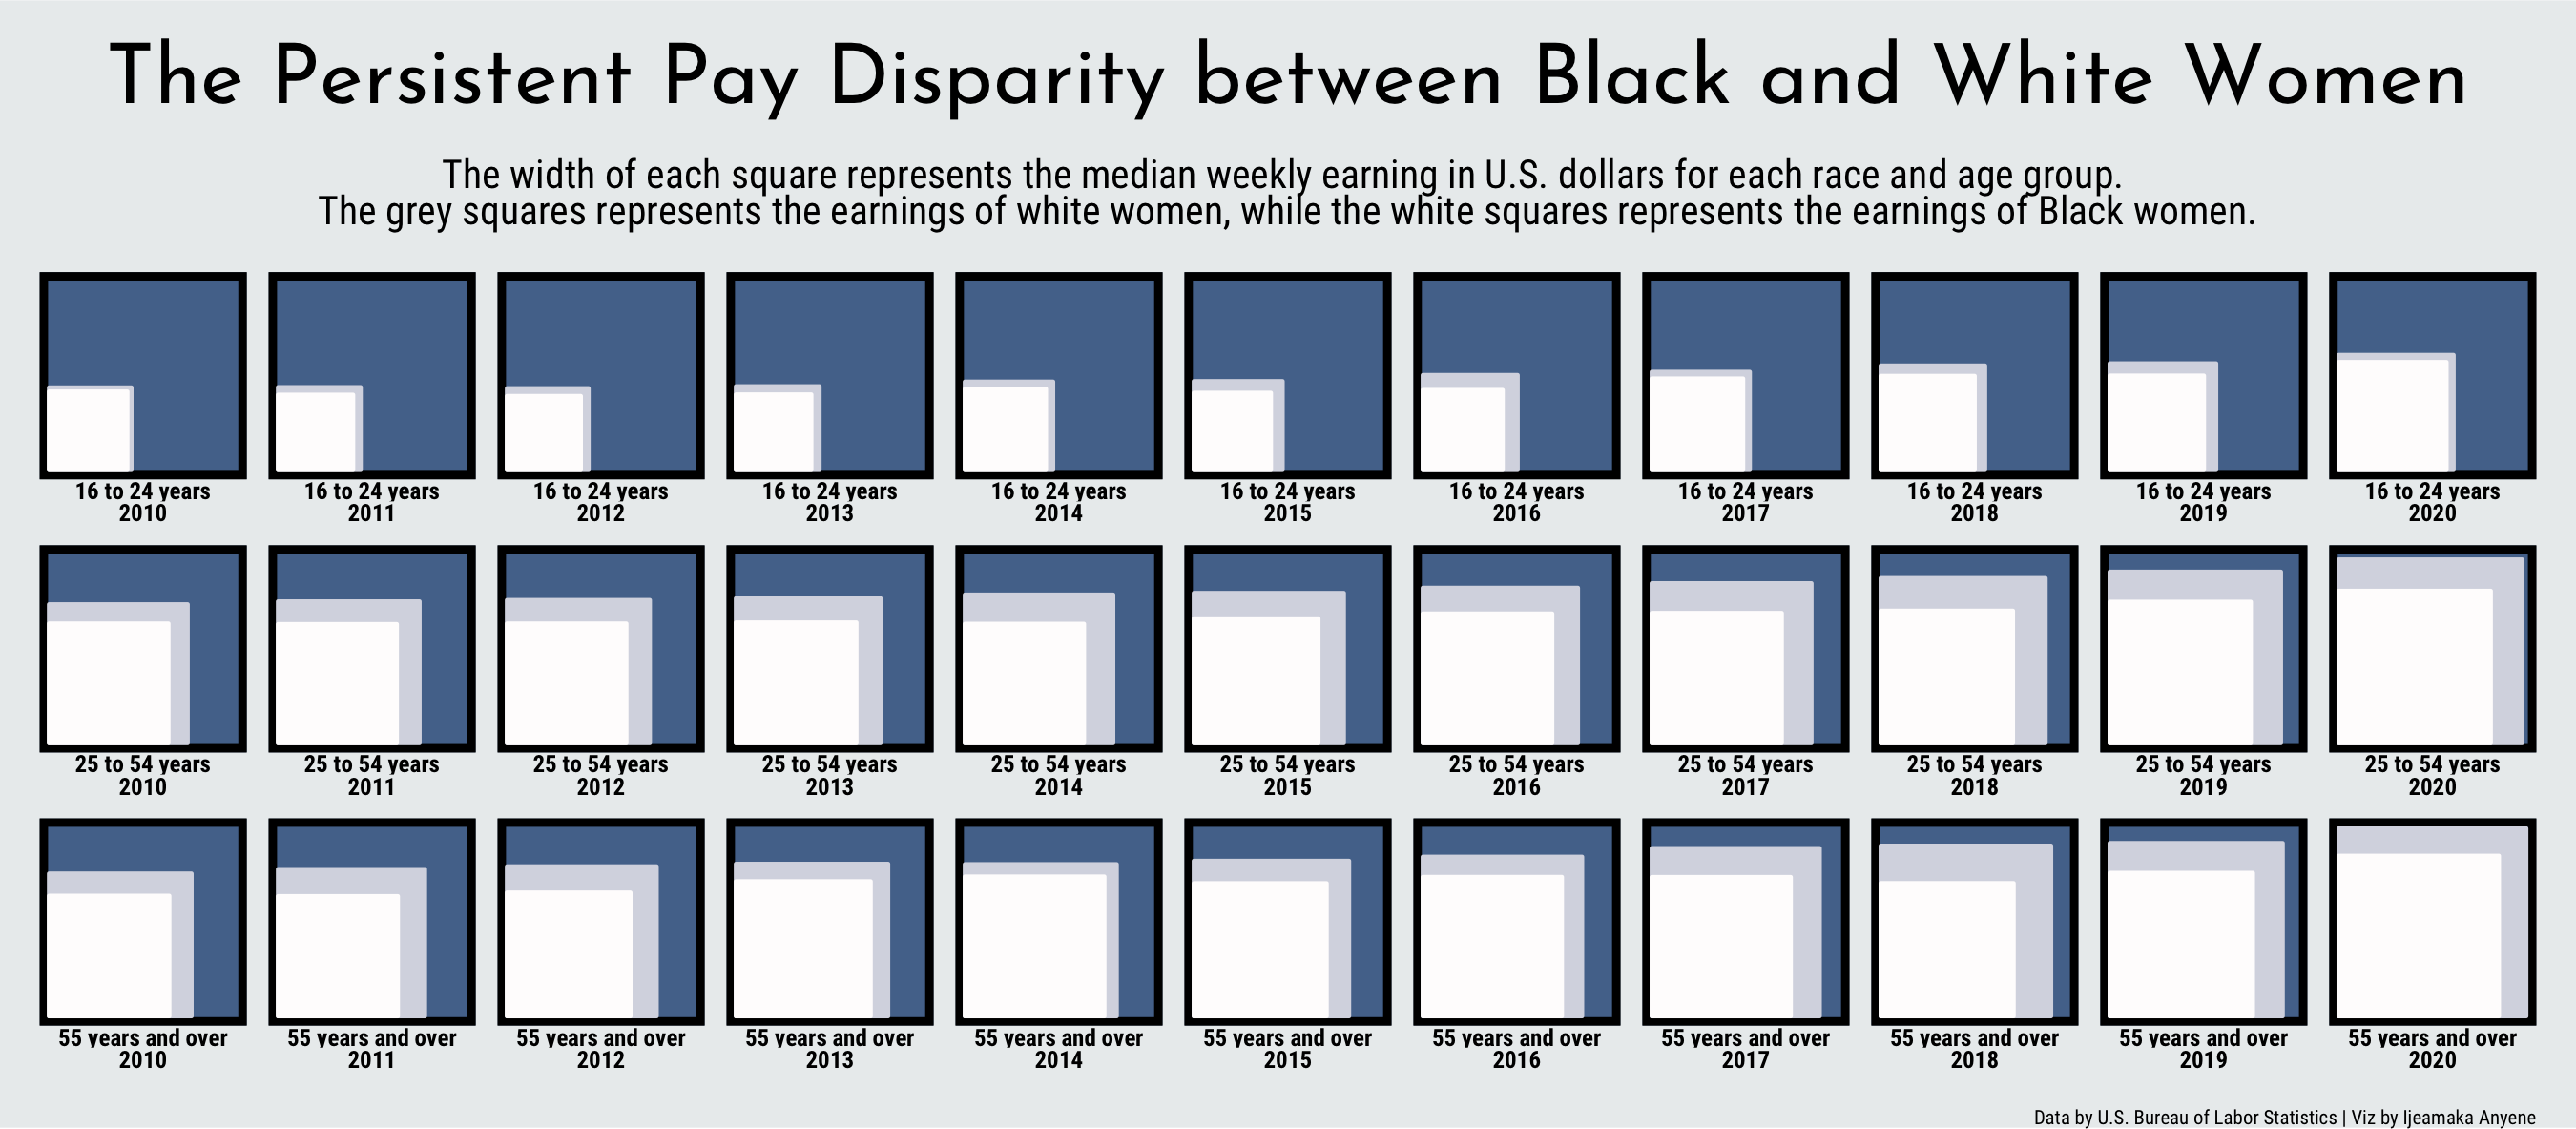
Dates: 02/15/2021 - 02/19/2021
Output: 2021-06
W.E.B. Du Bois Recreations
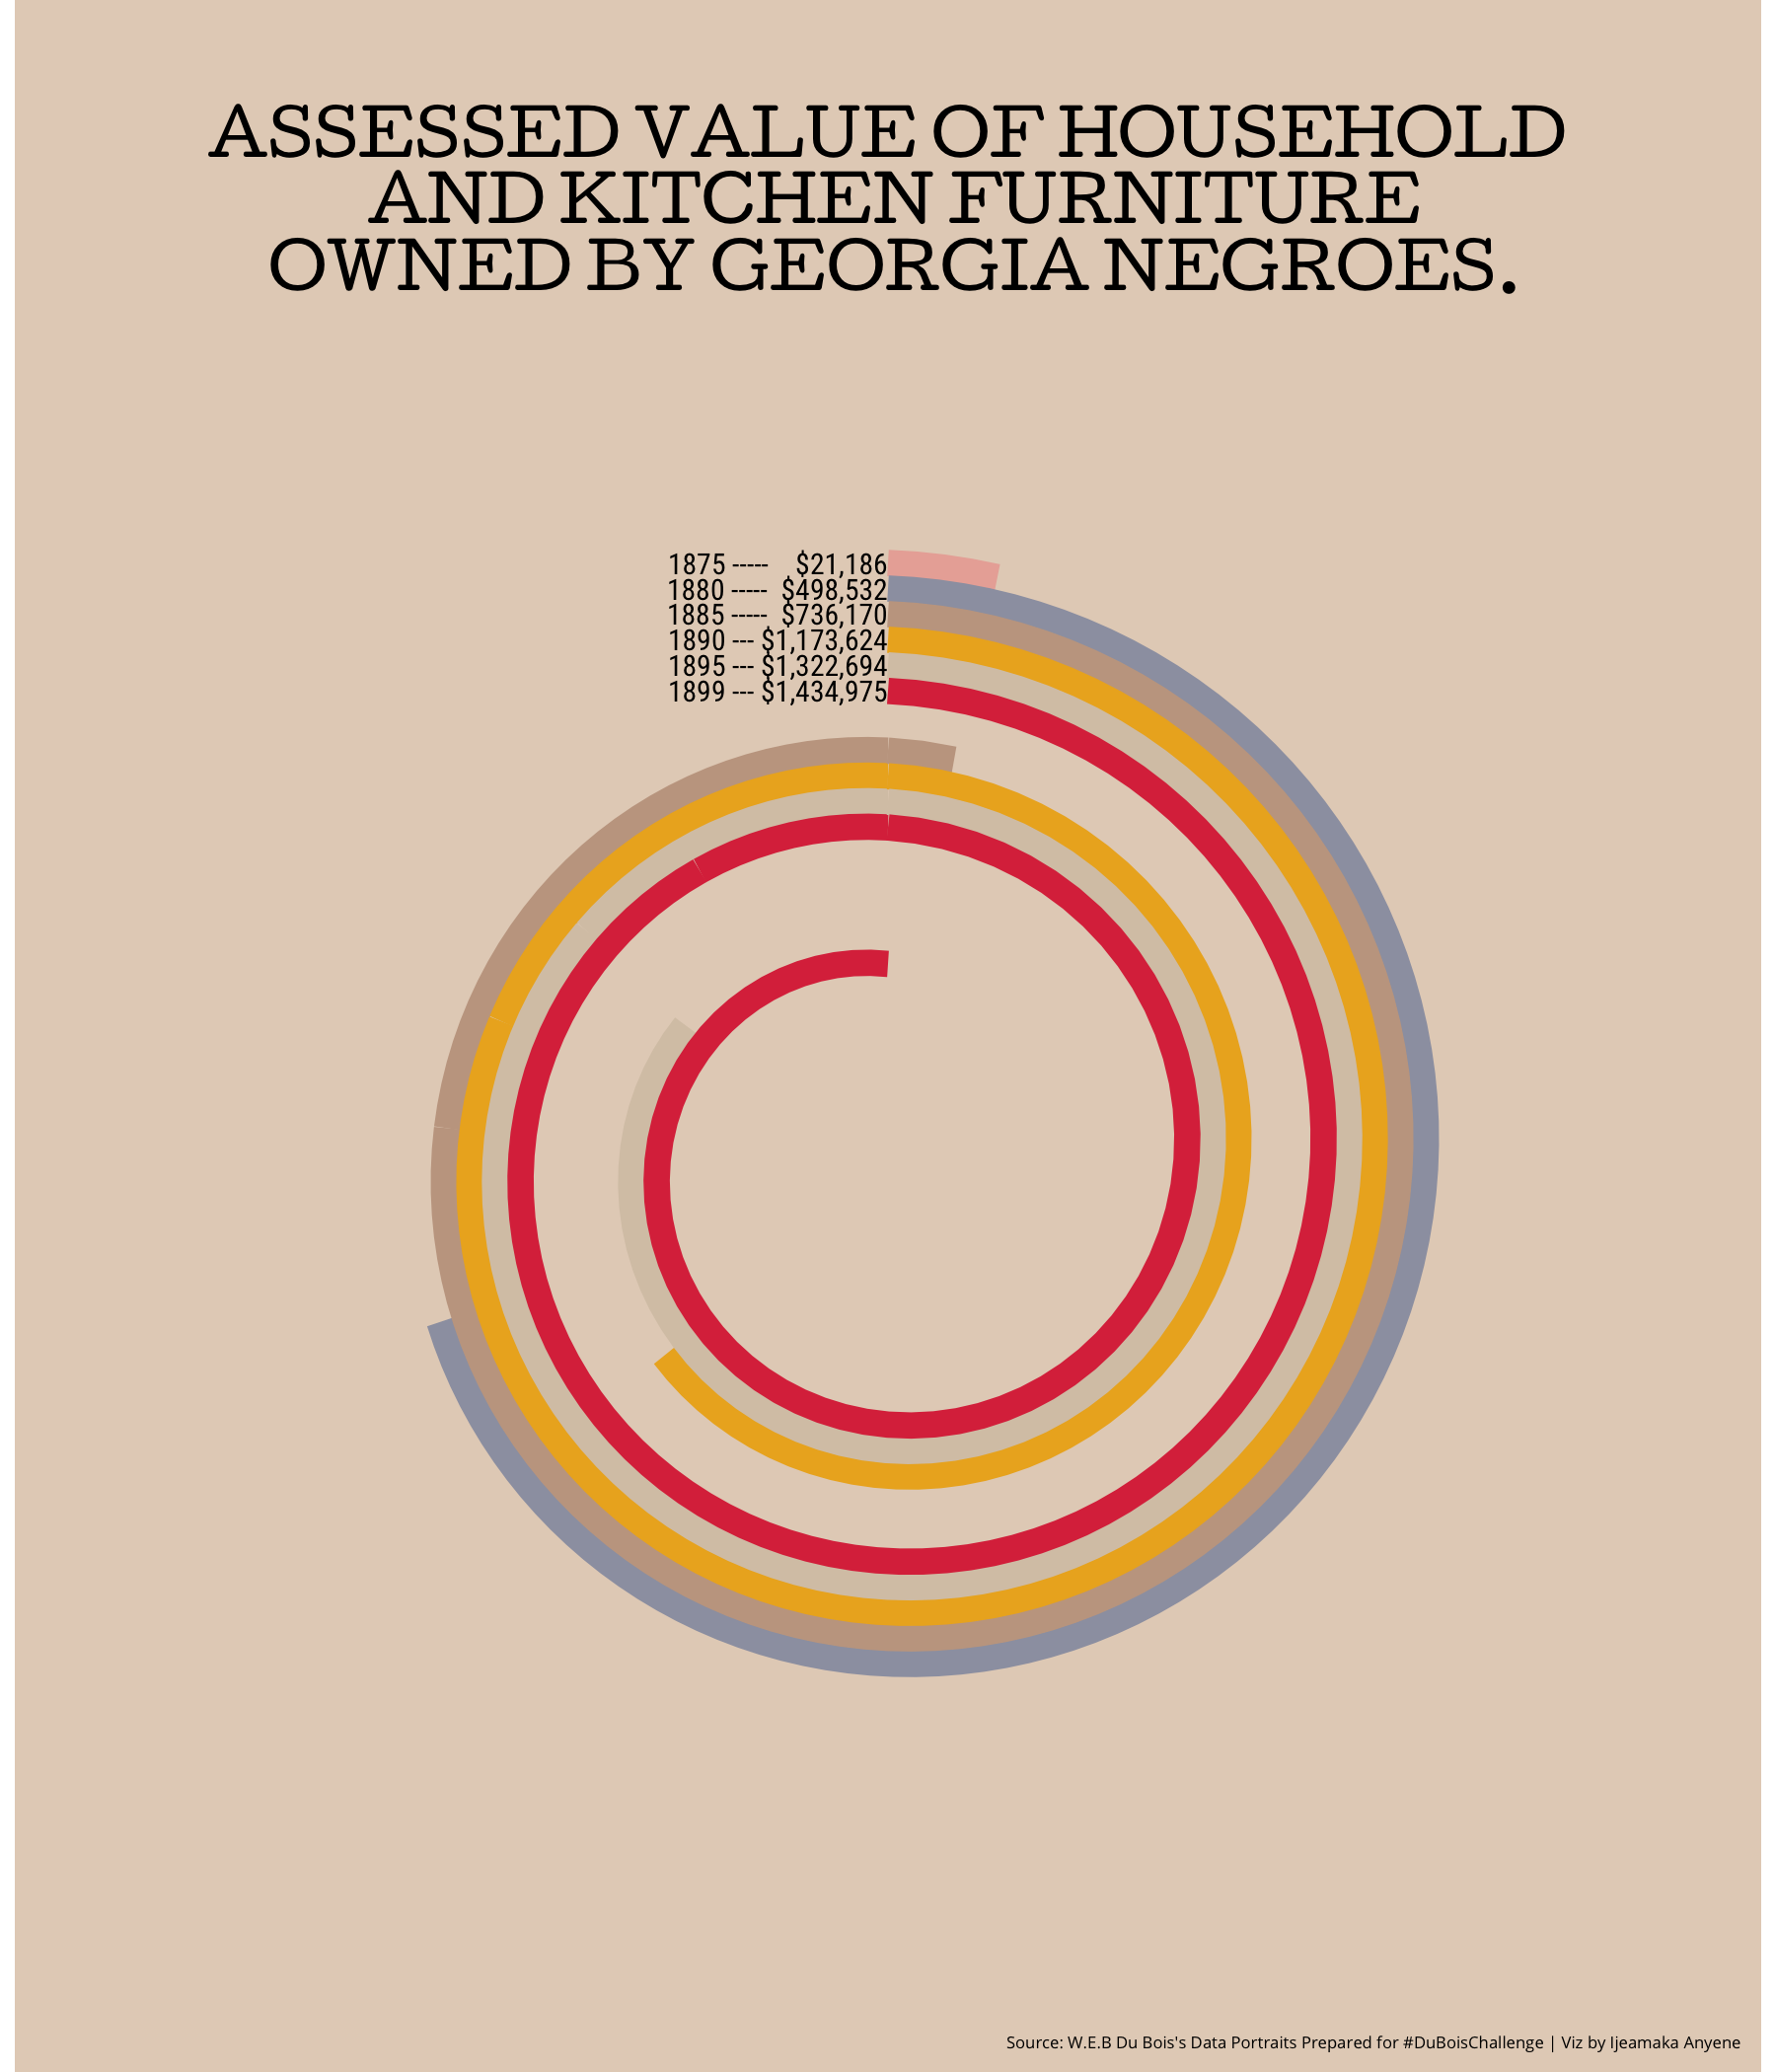
Dates: 02/08/2021 - 02/12/2021
Output: 2021-05
Black Student Loan Debt
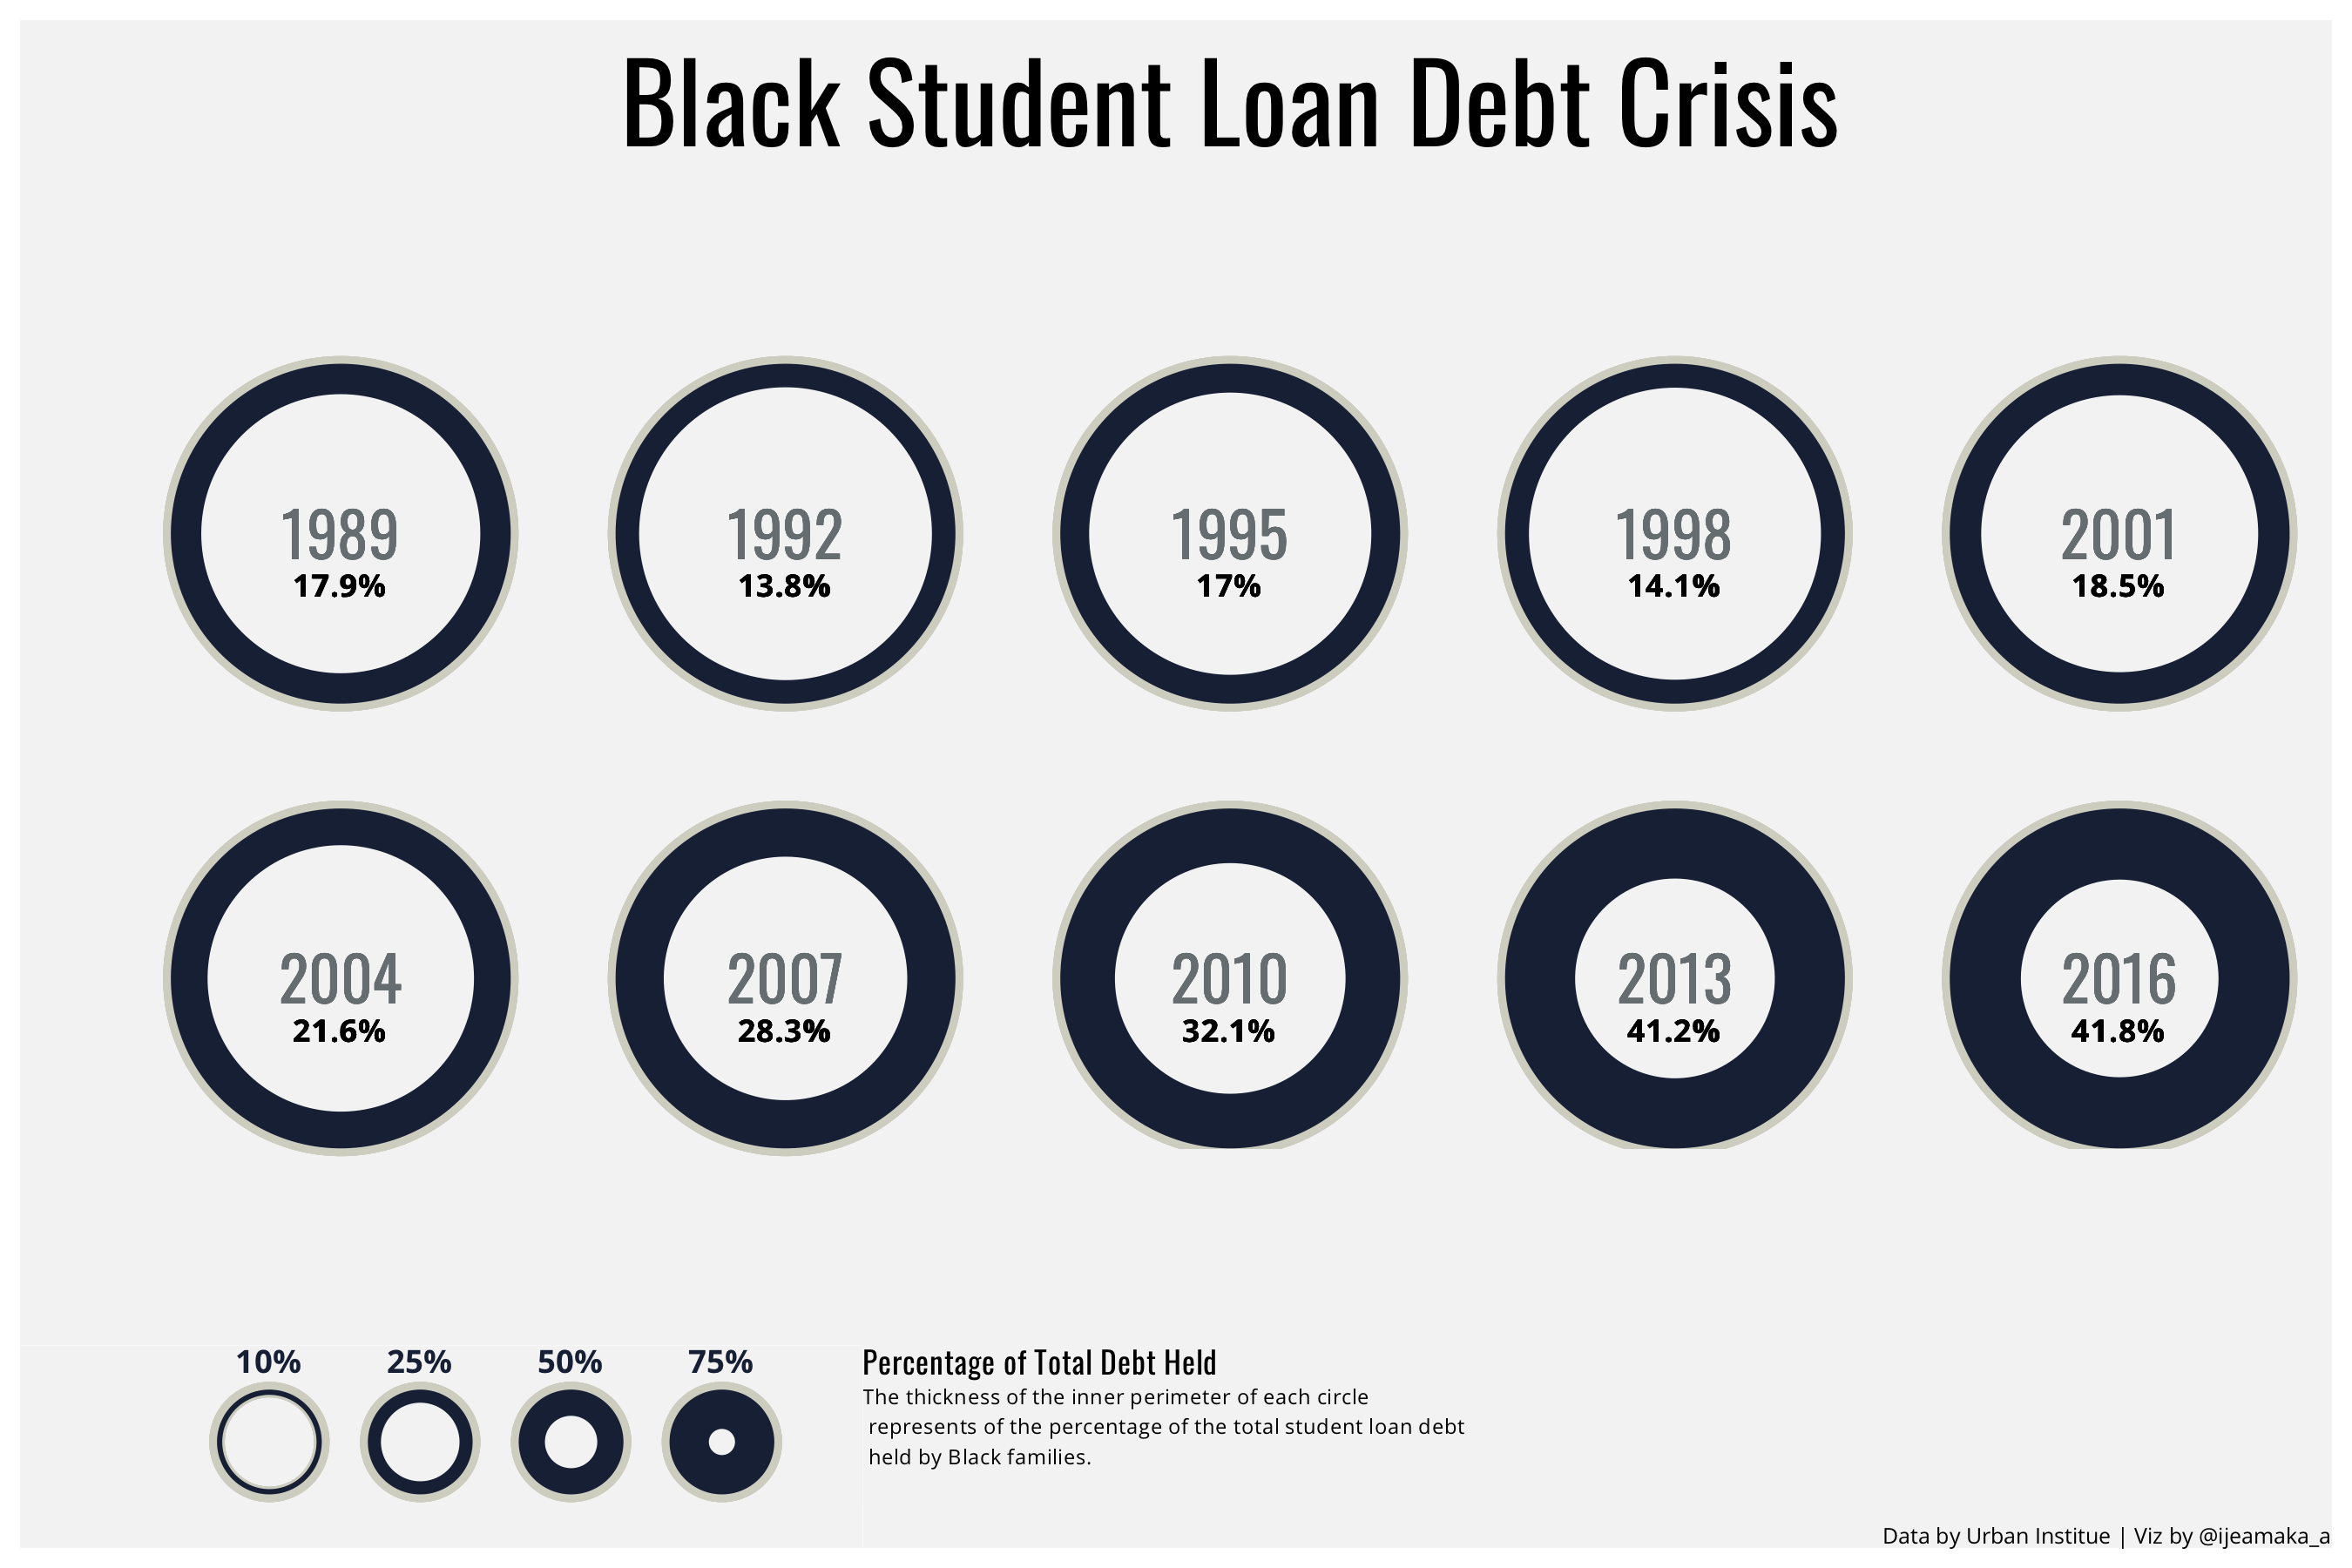
Dates: 02/01/2021 - 02/05/2021
Output: 2021-04
HBCU Enrollment
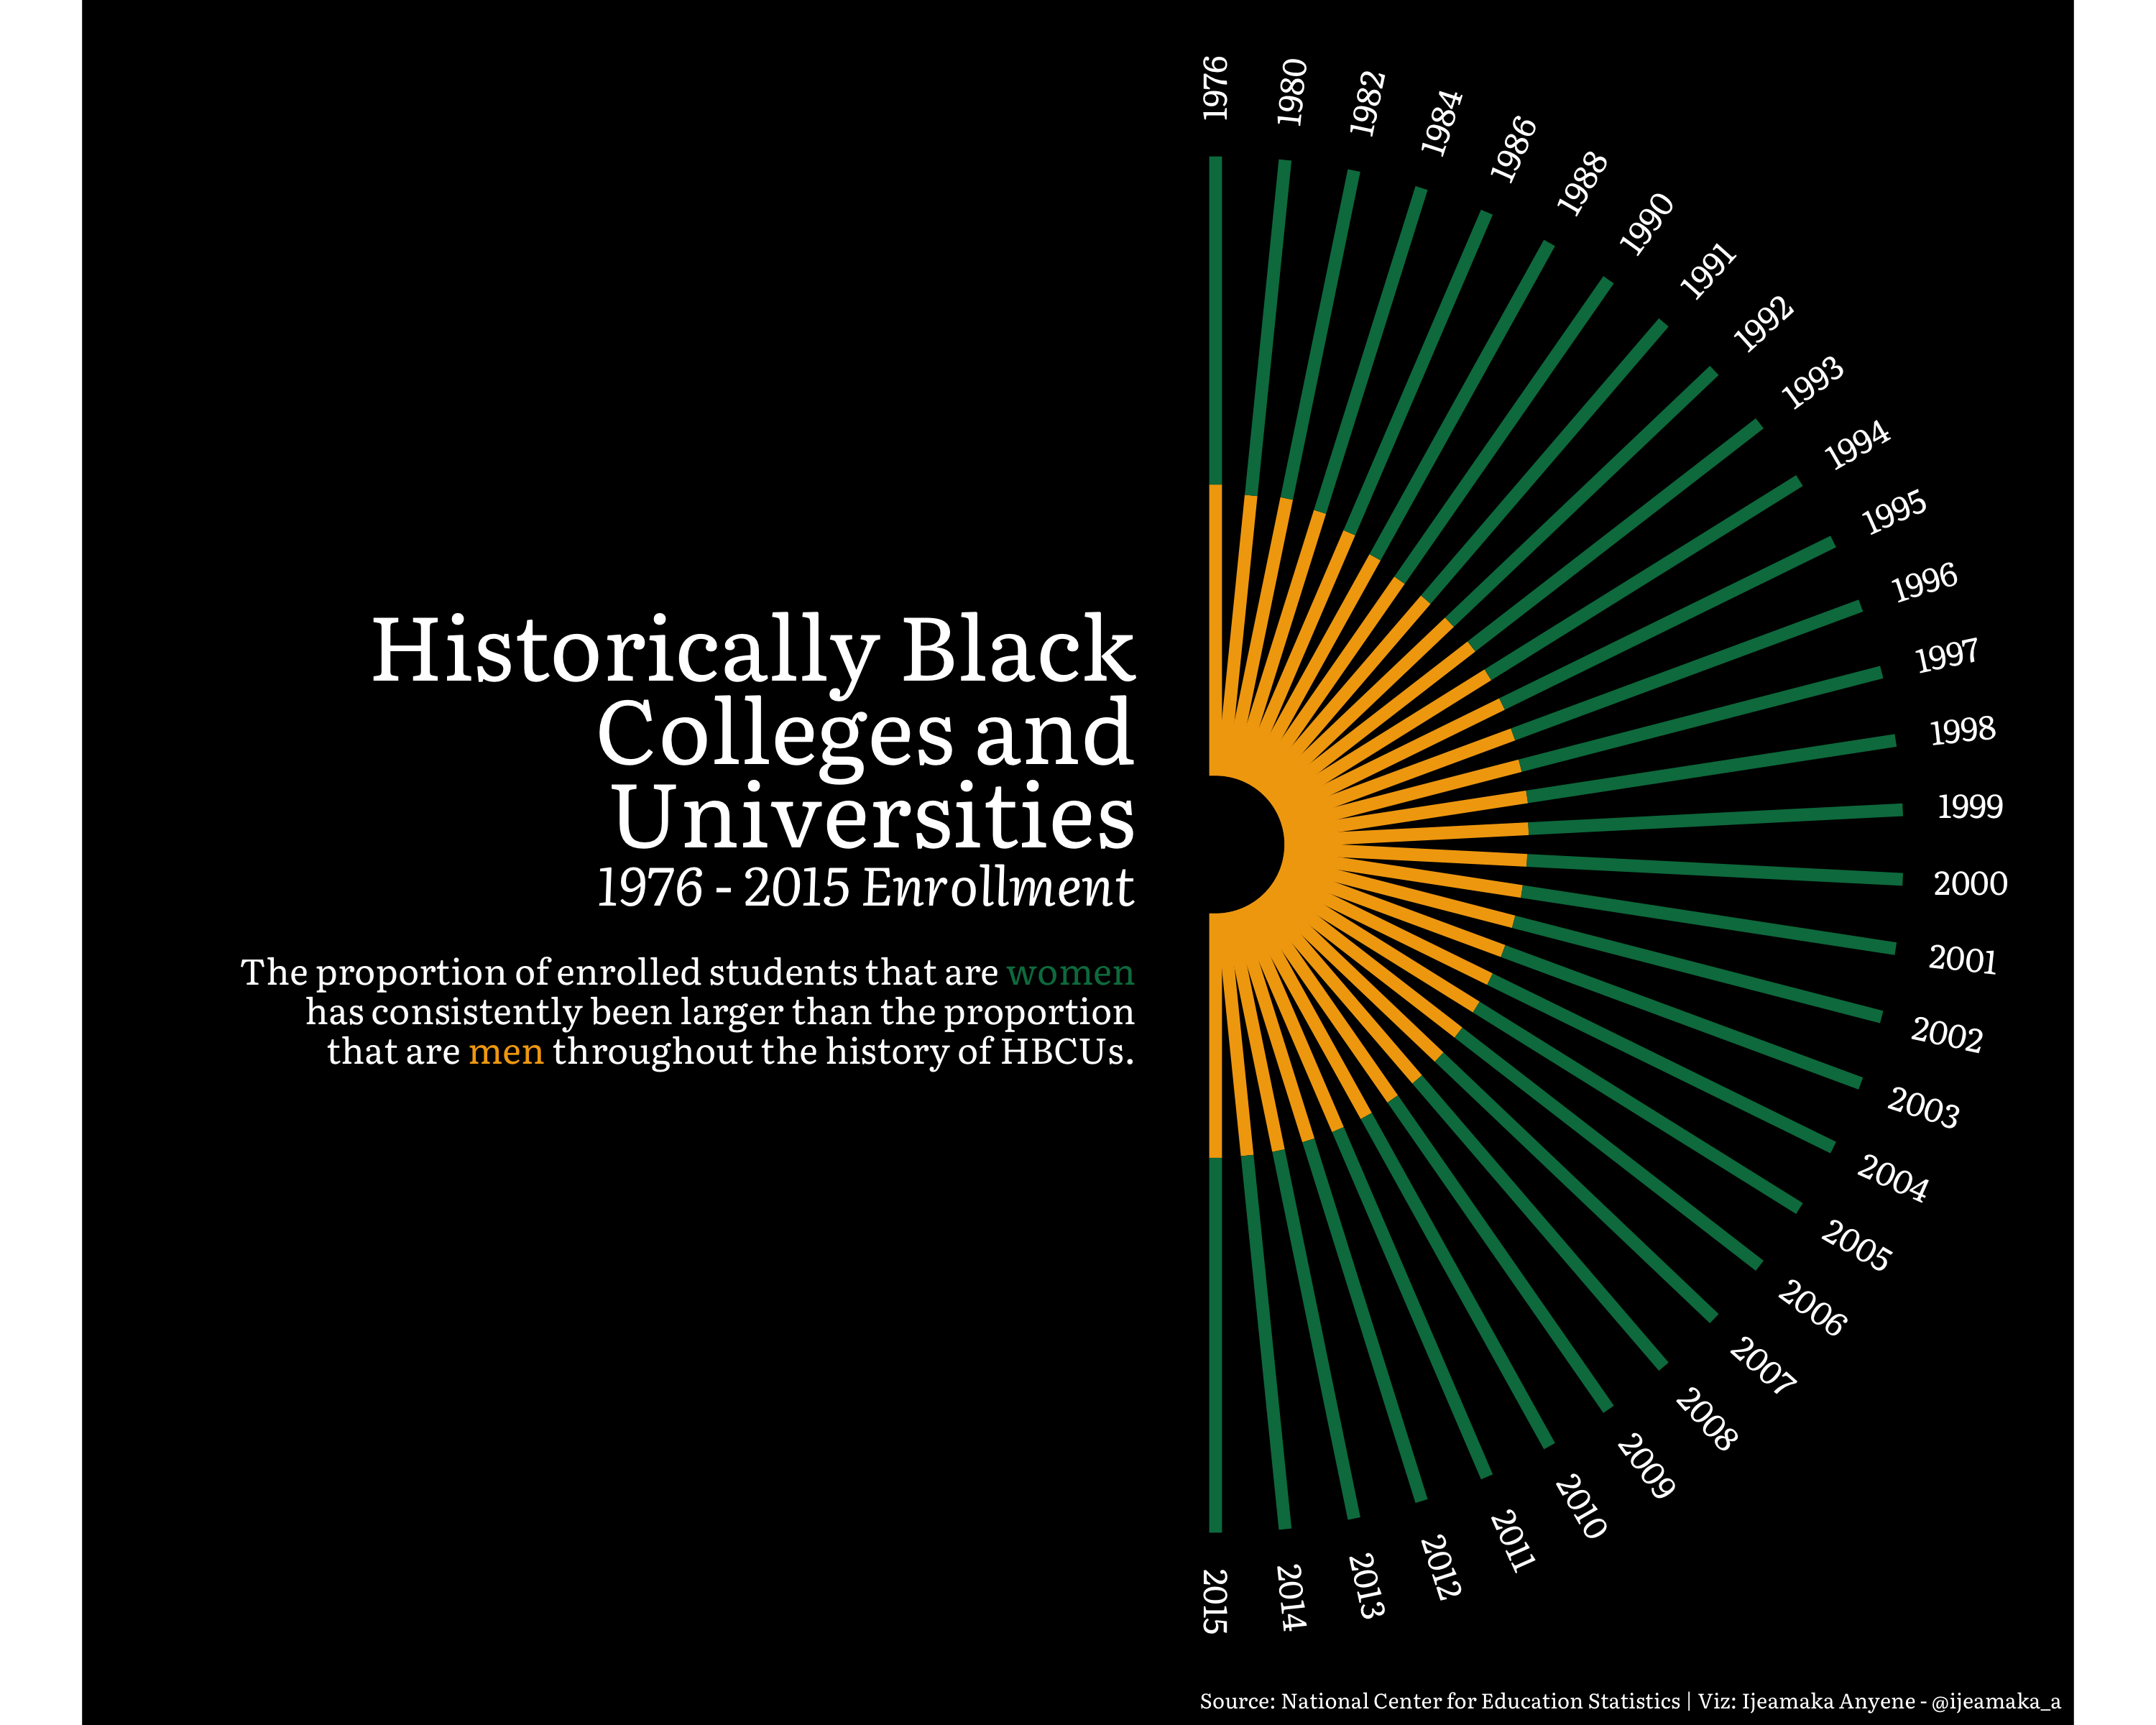
Dates: 01/24/2021 - 01/30/2021
Output: 2021-03
Break Free From Plastic
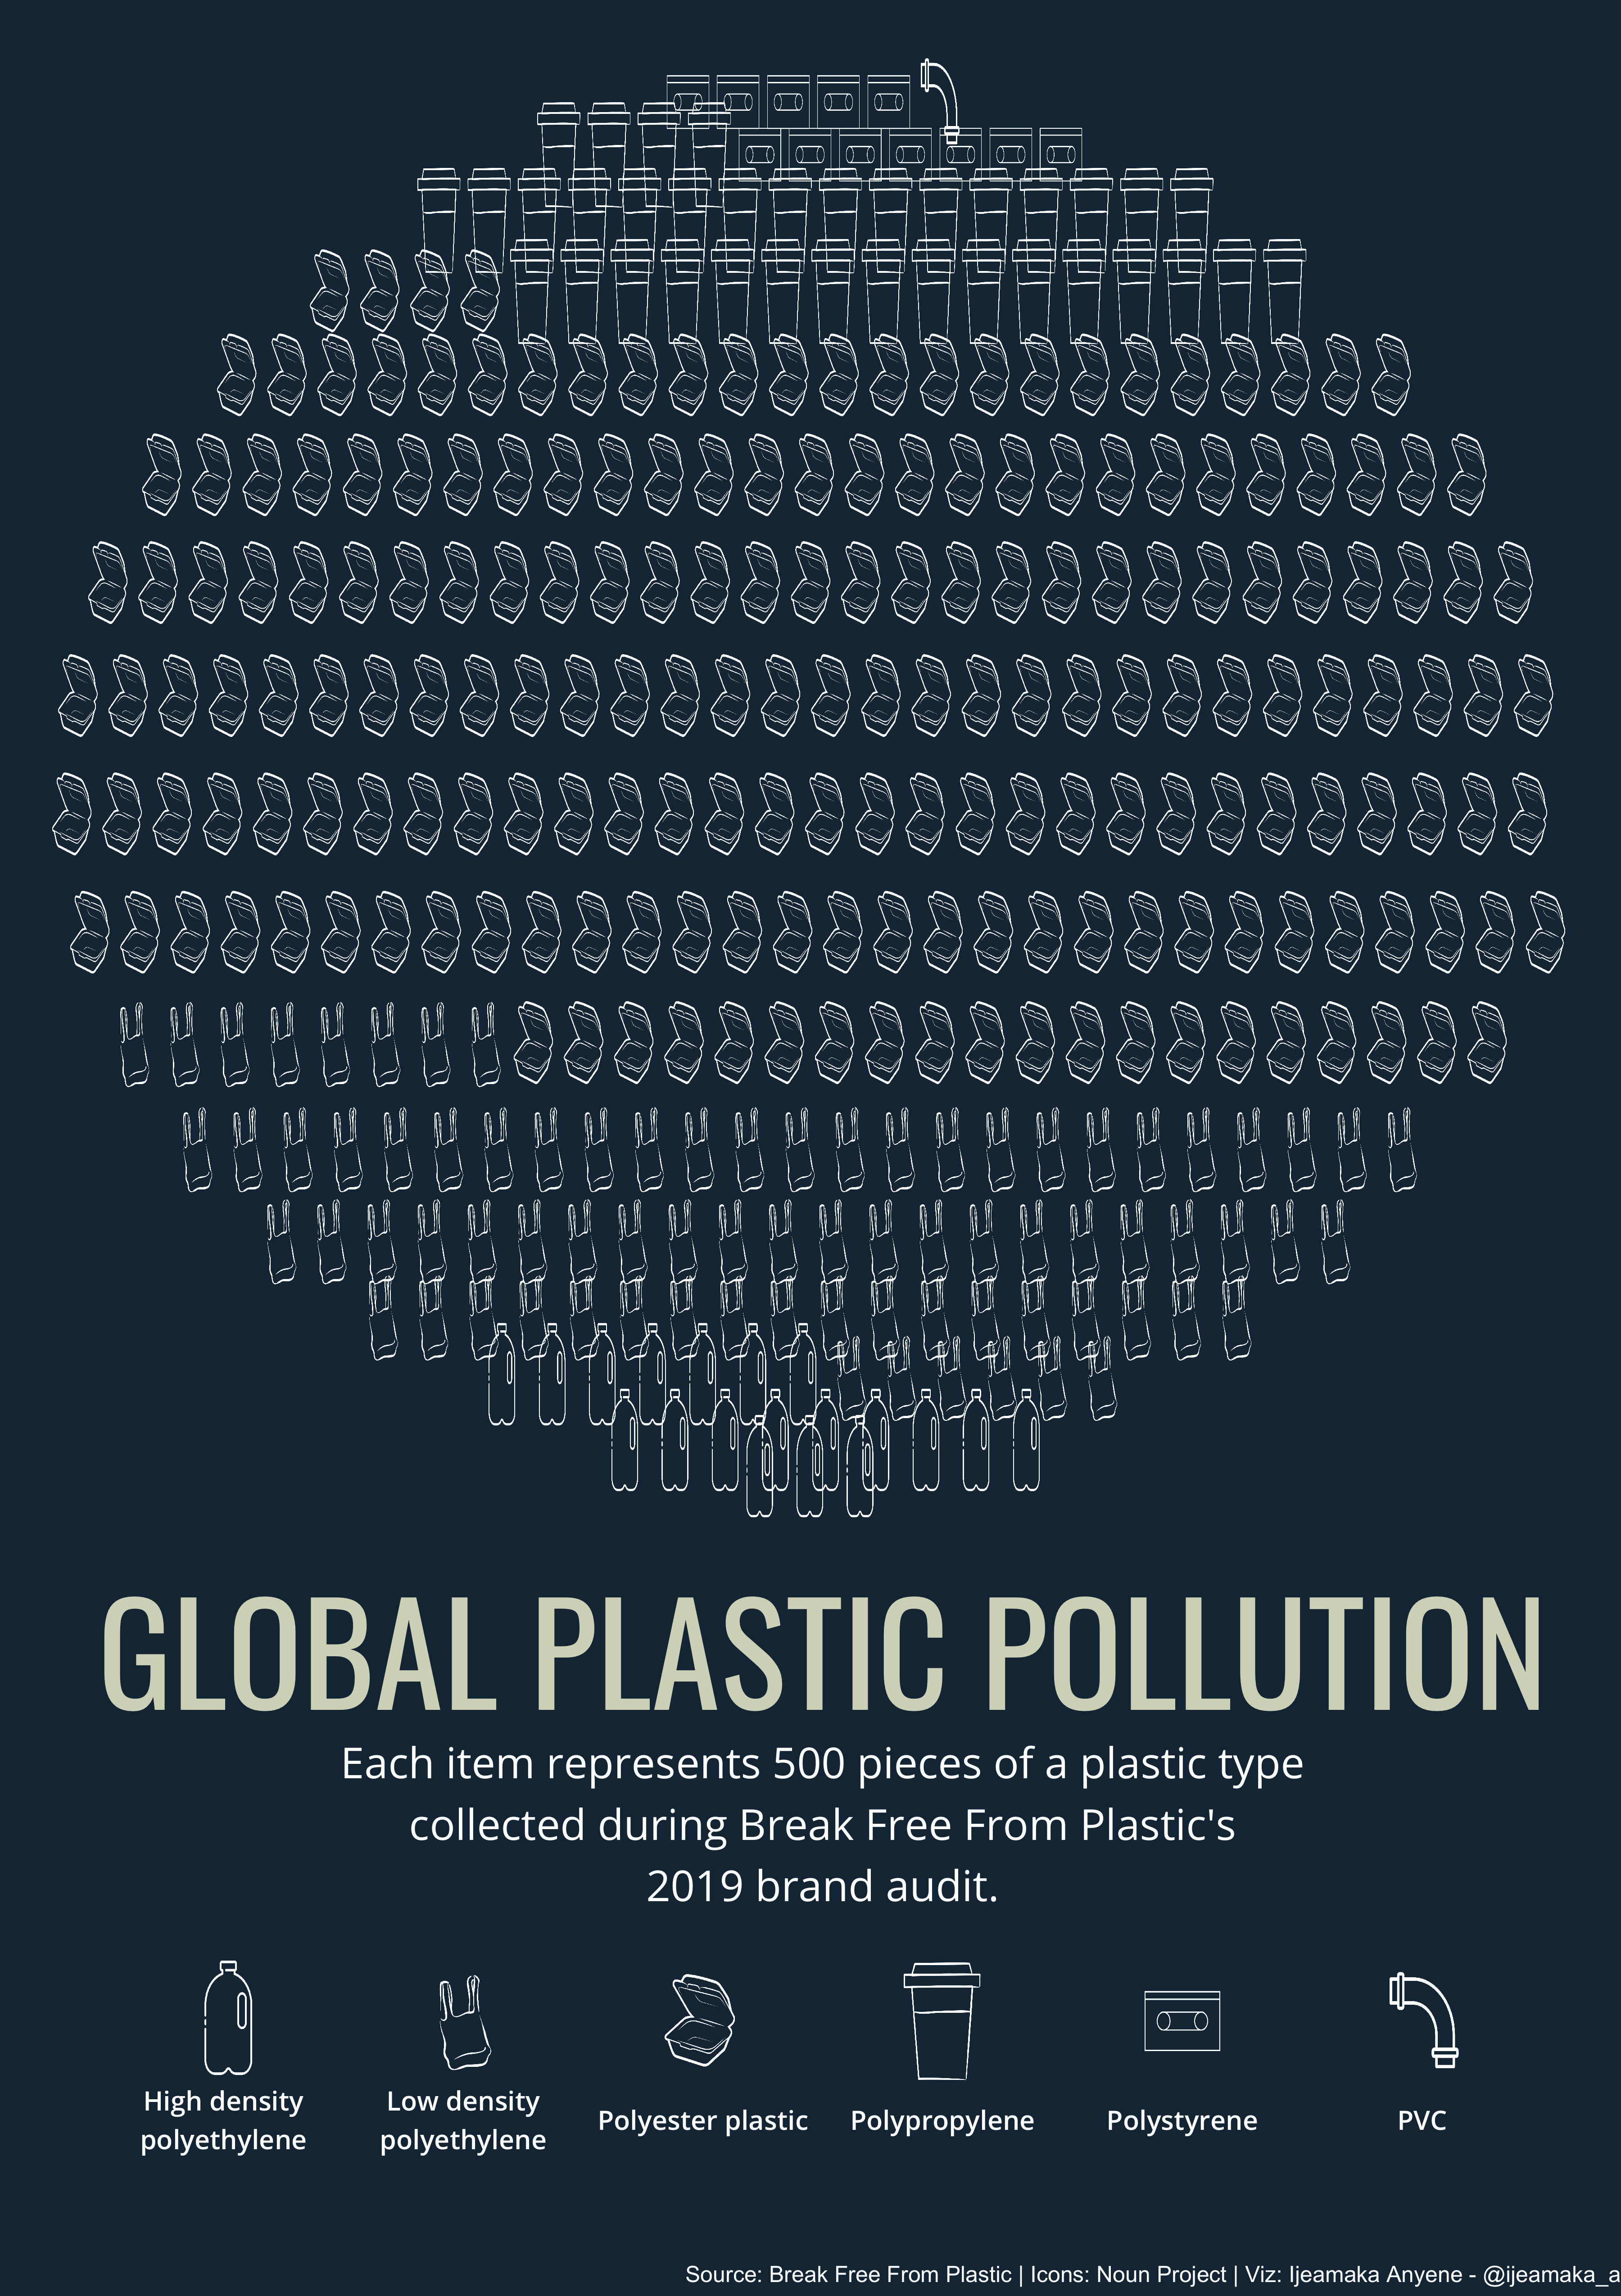
Dates: 01/10/2021 - 01/16/2021
Output: 2021-02
Tate Art Musuem
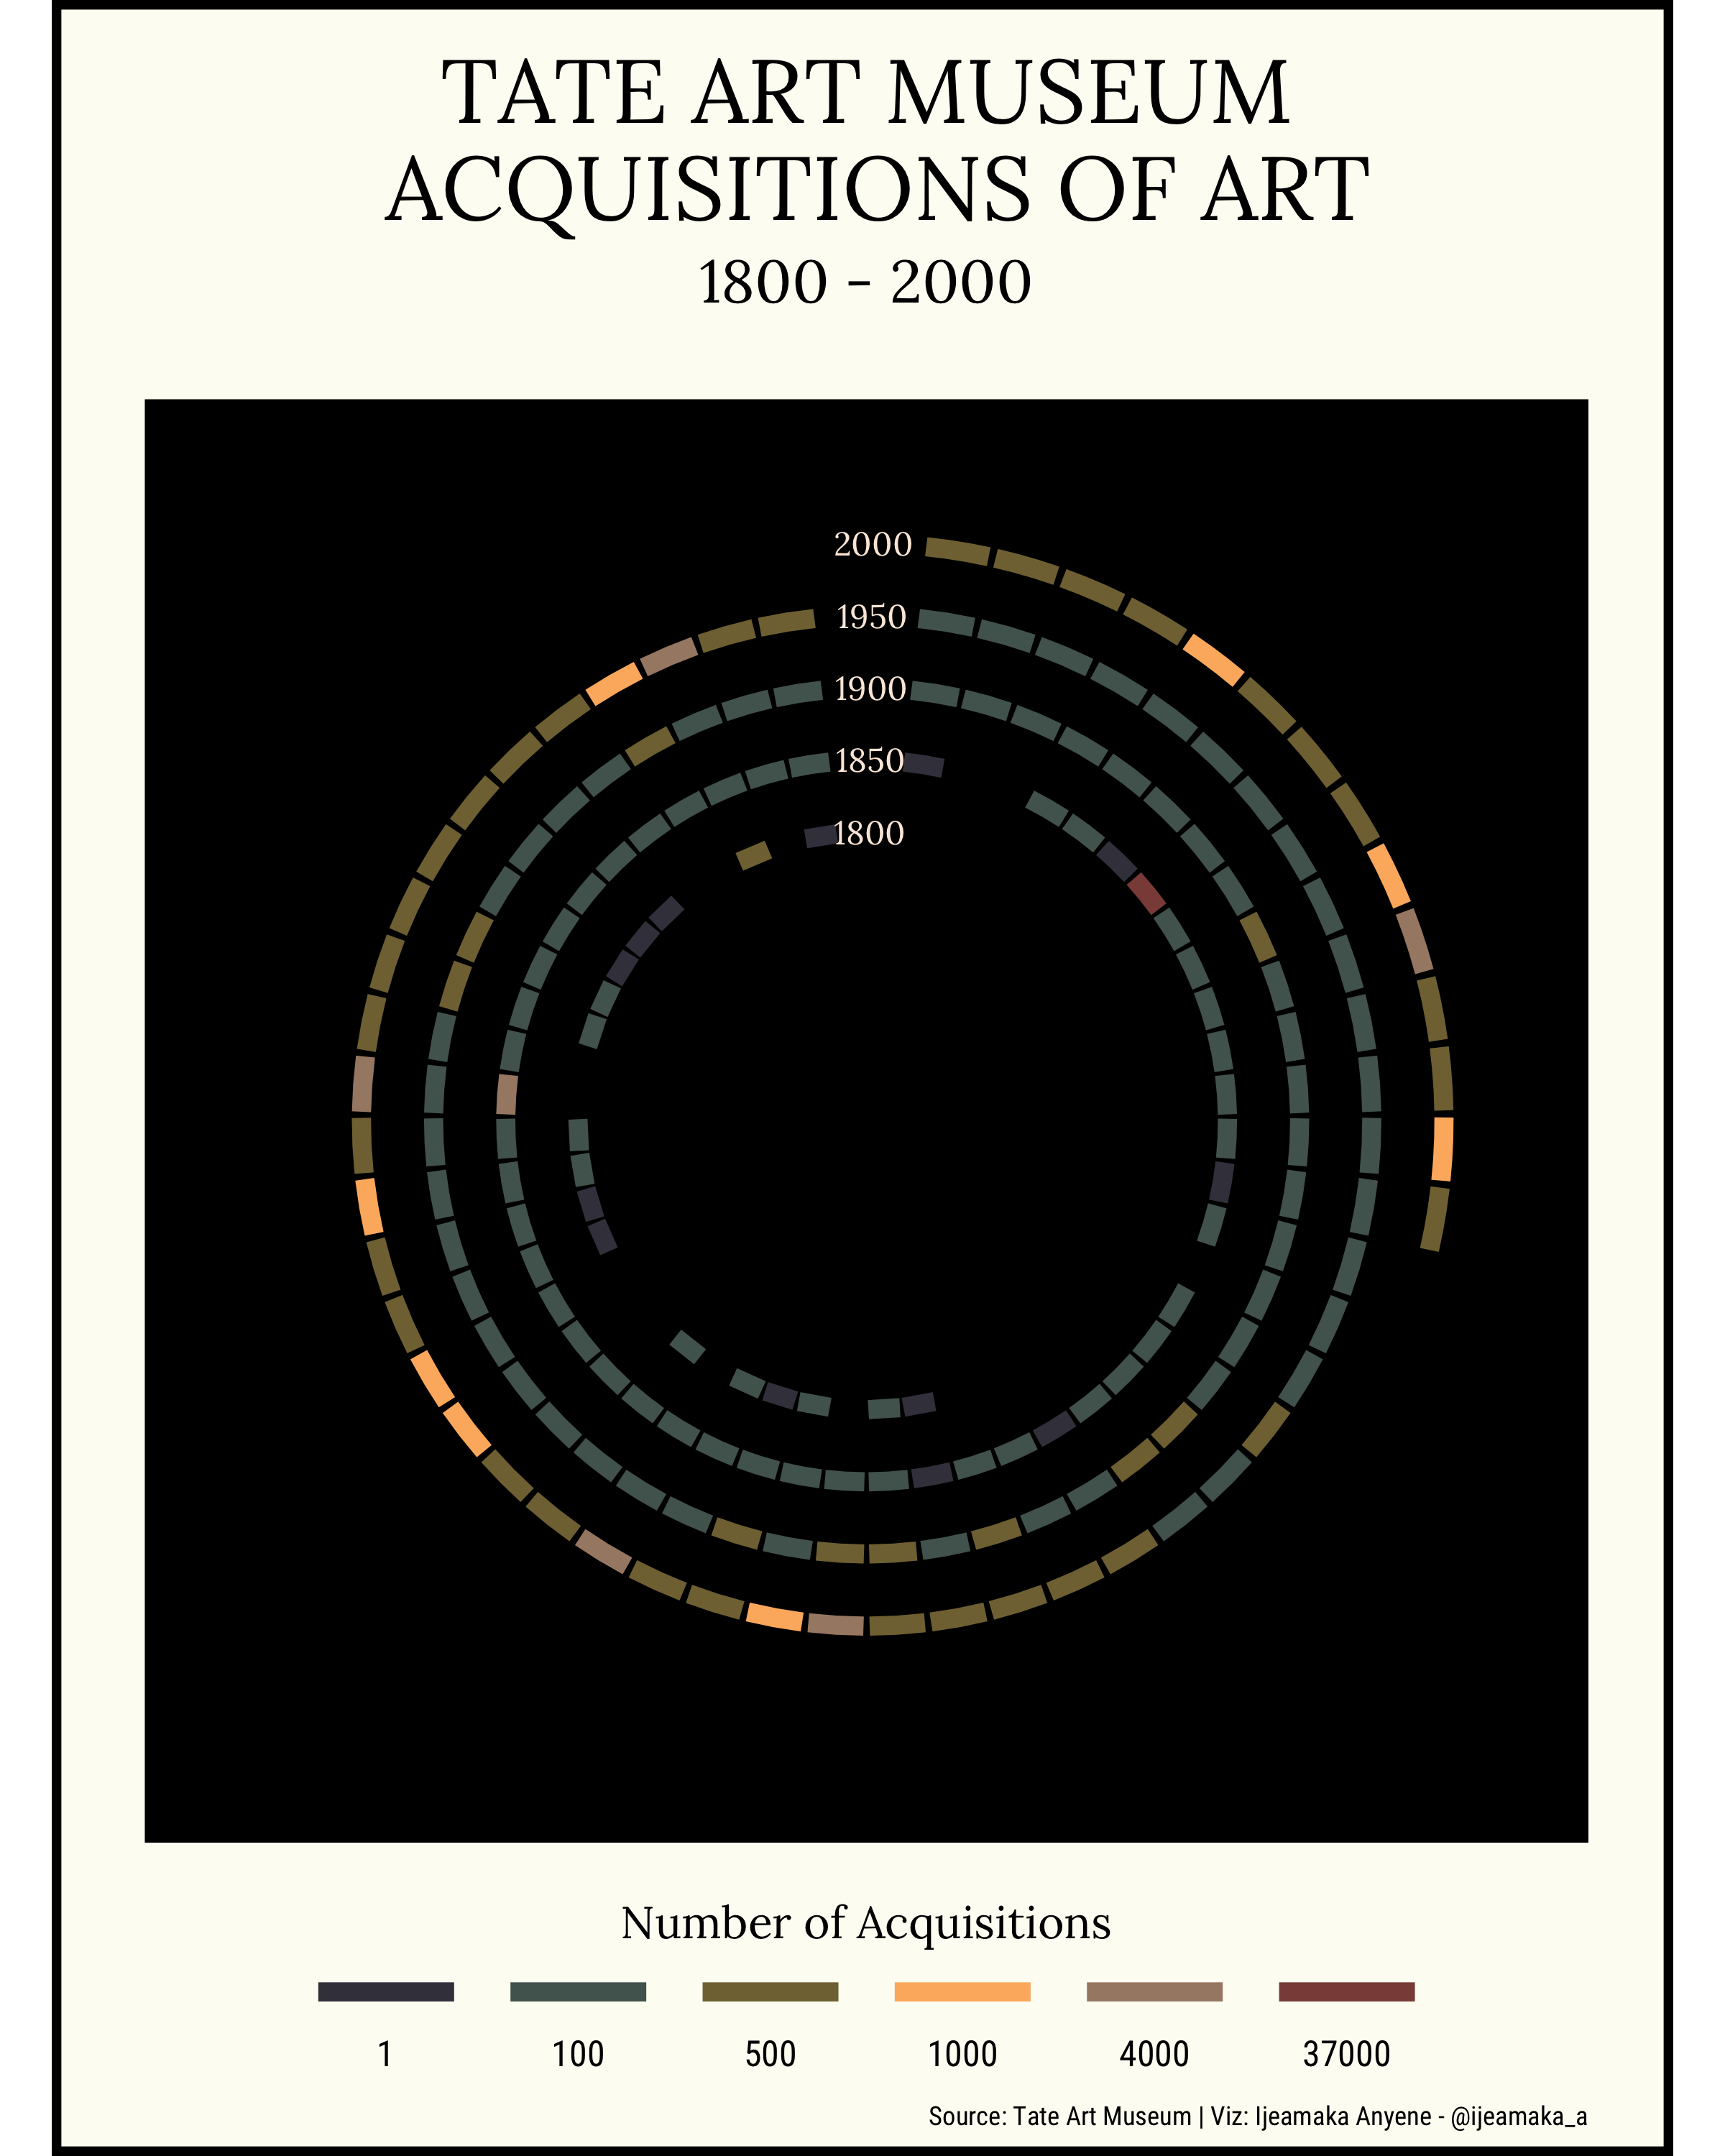
Dates: 01/05/2021 - 01/09/2021
Output: 2021-01
West Coast Transit Infrastructure Projects
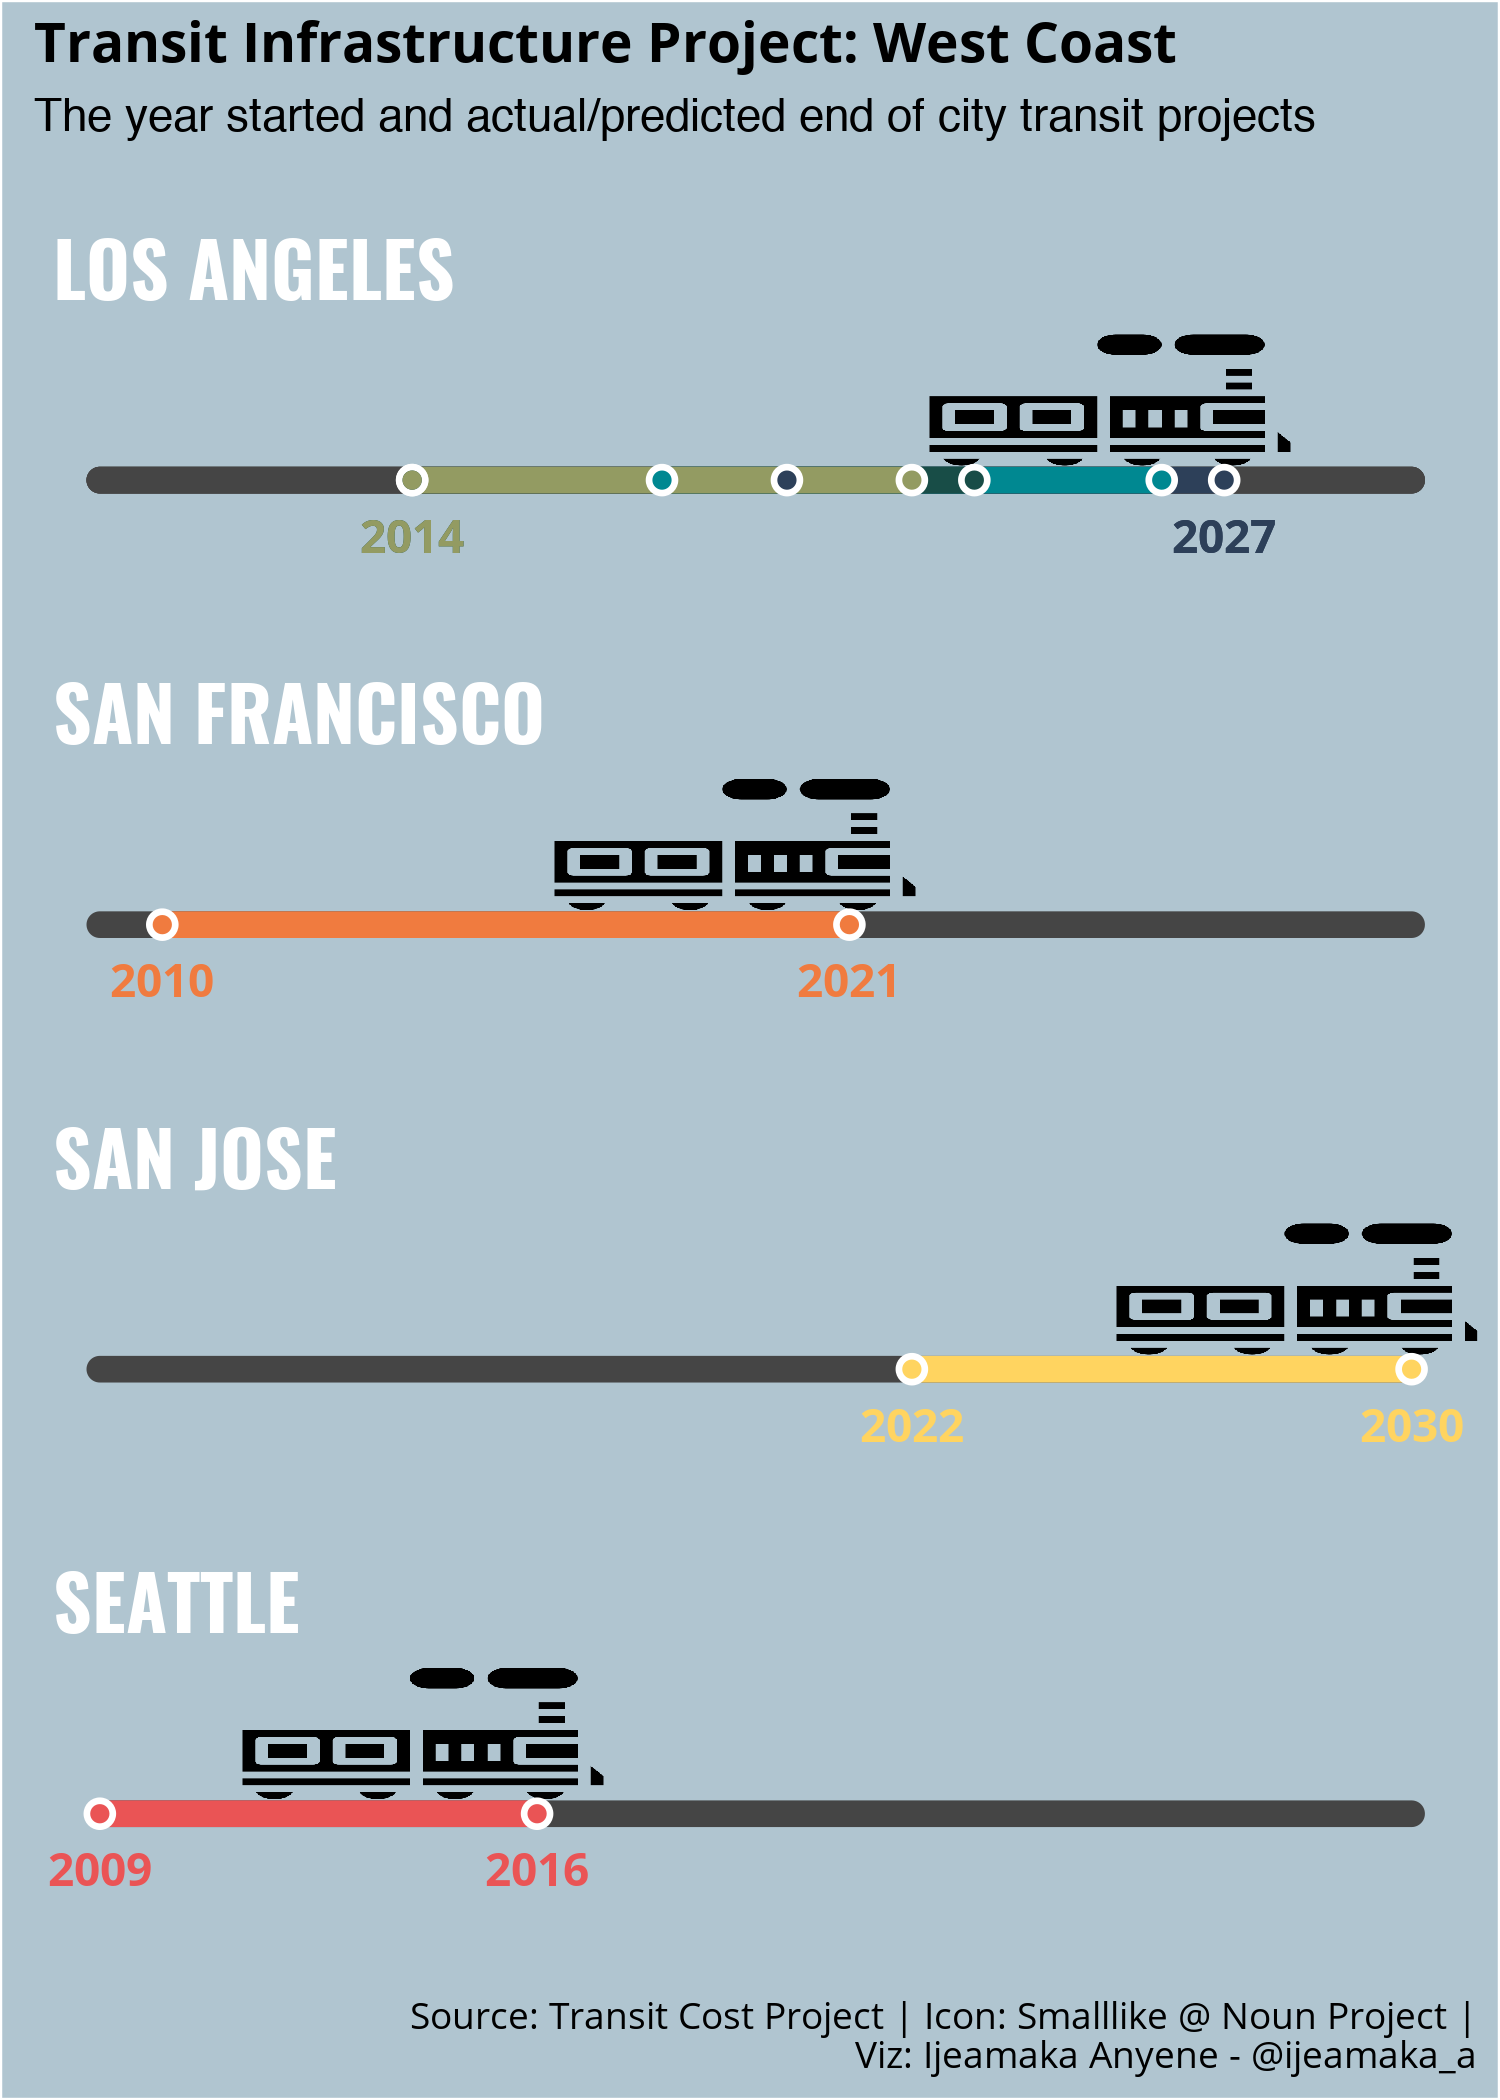
Dates: 12/01/2020 - 12/05/2020
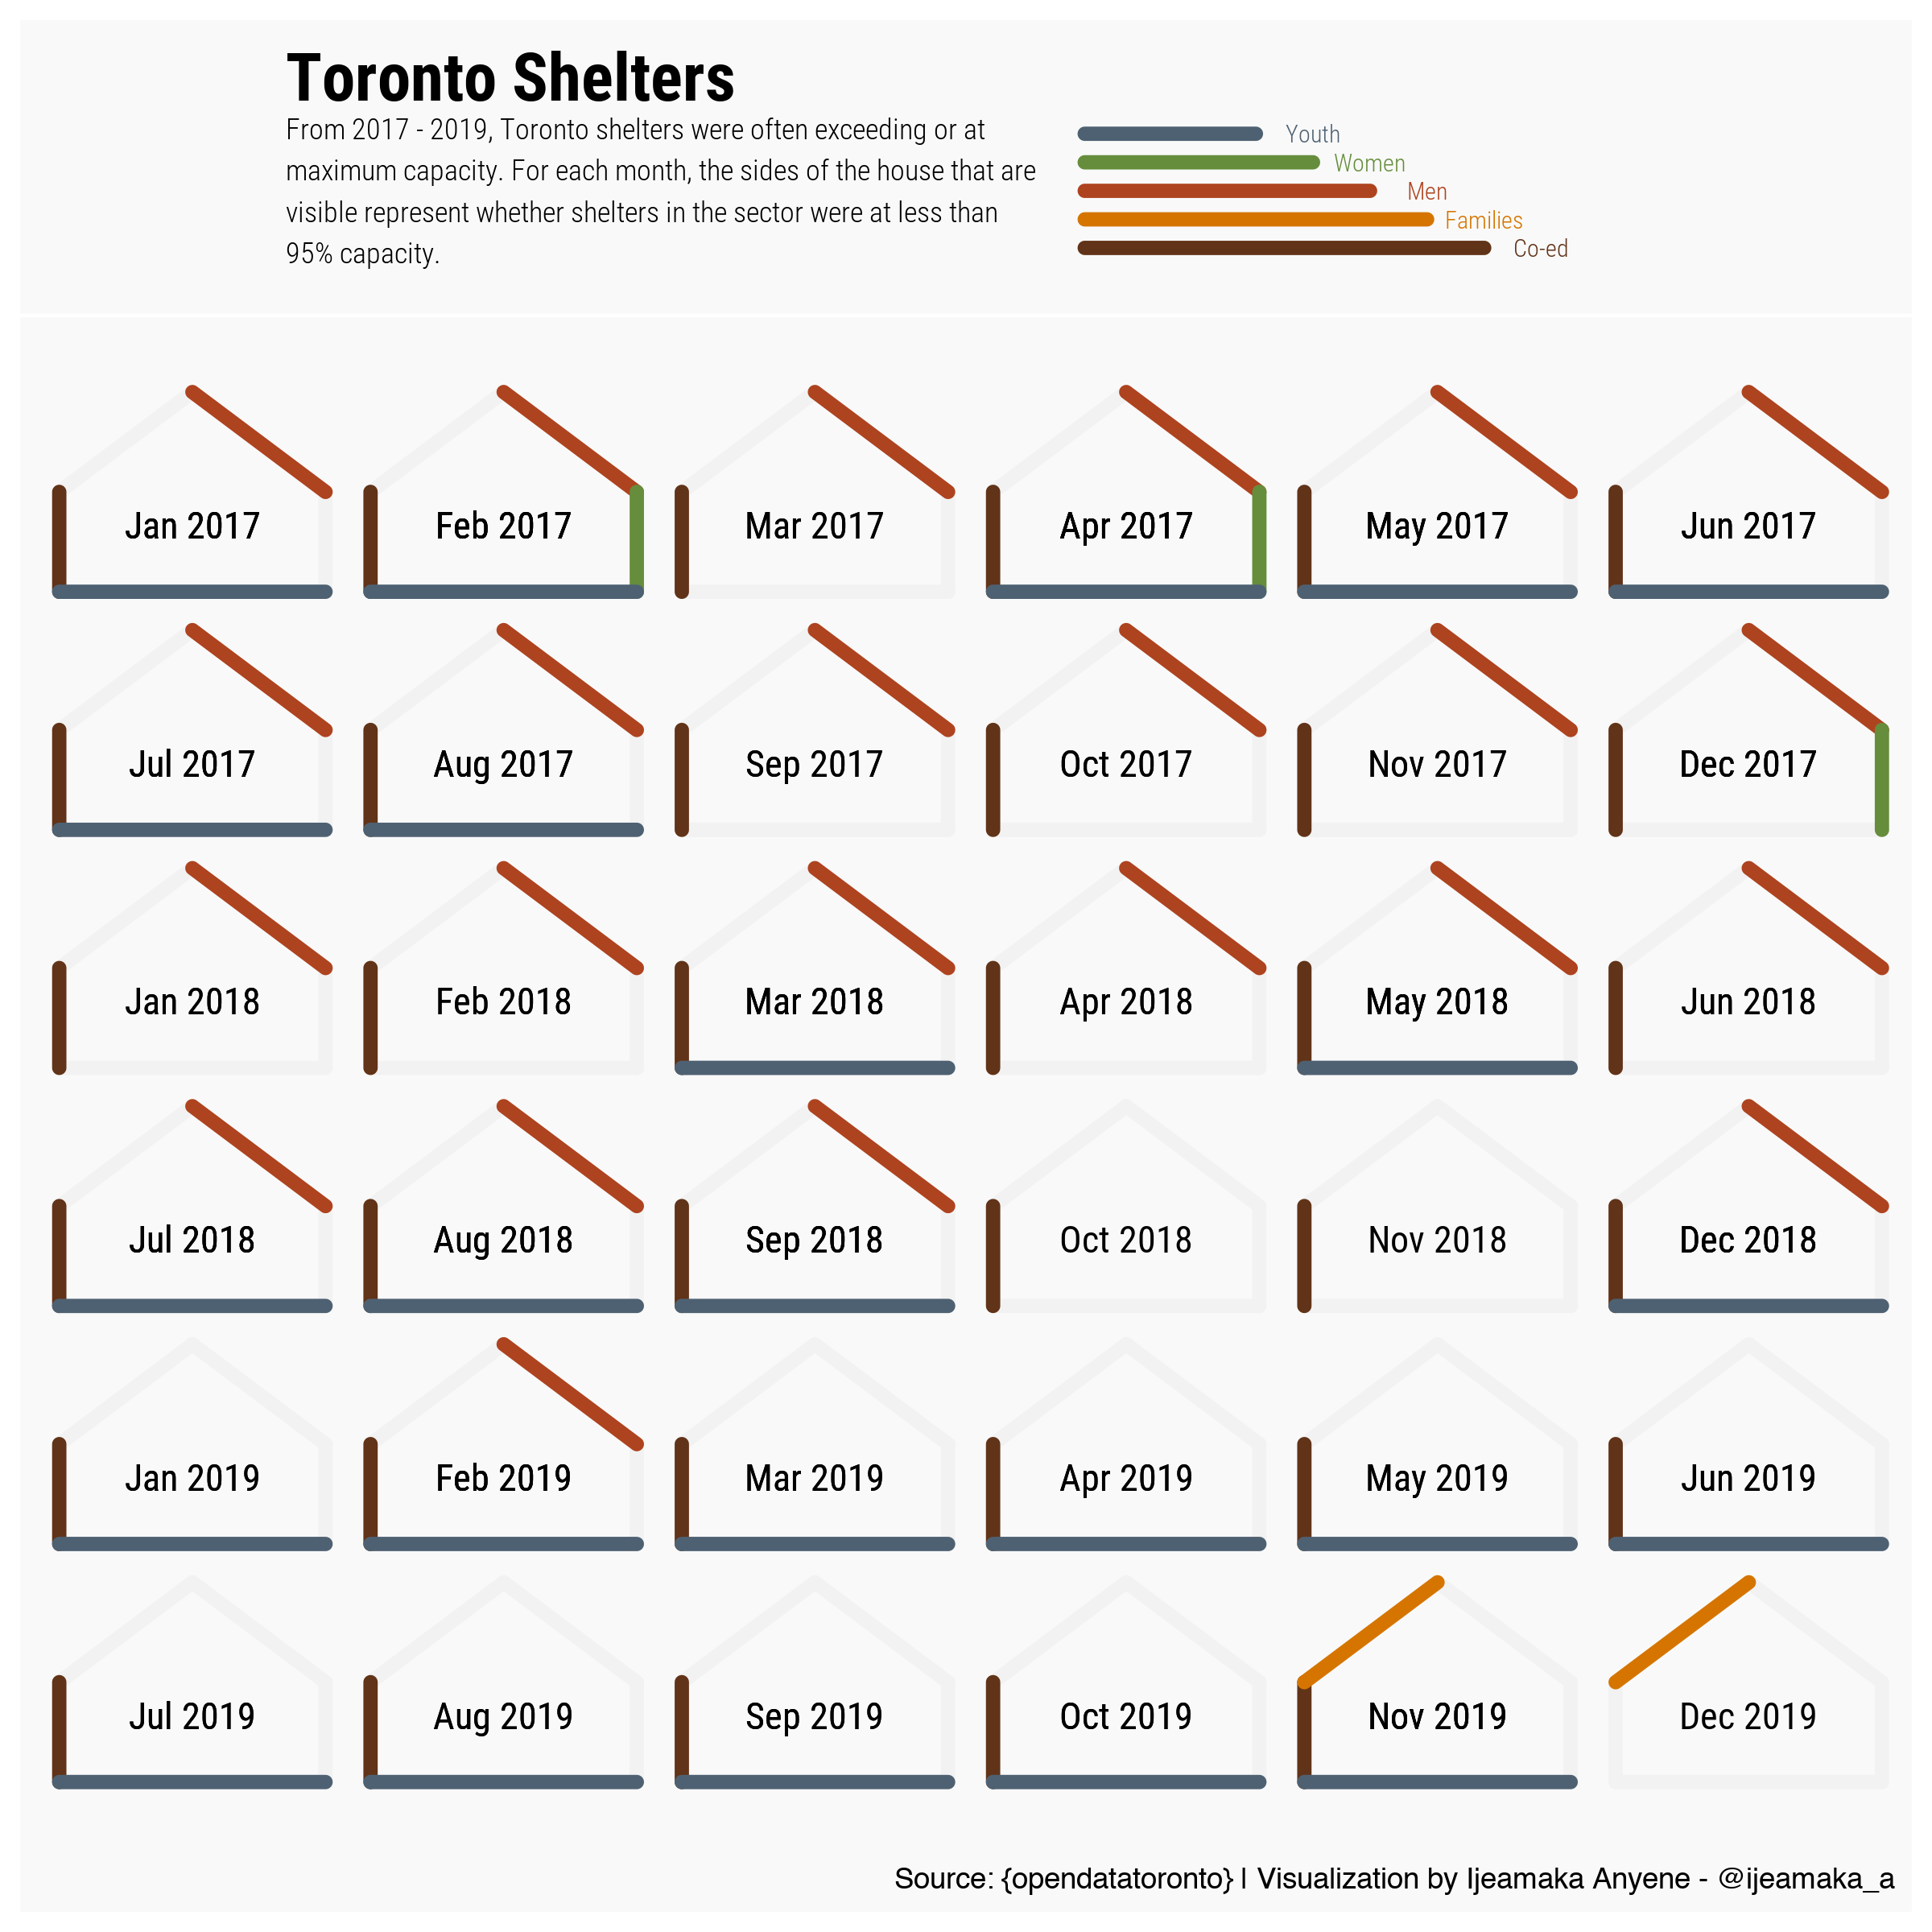
Output: 2020-19
Toronto shelters at <95% capacity
Dates: 11/22/2020 - 11/28/2020
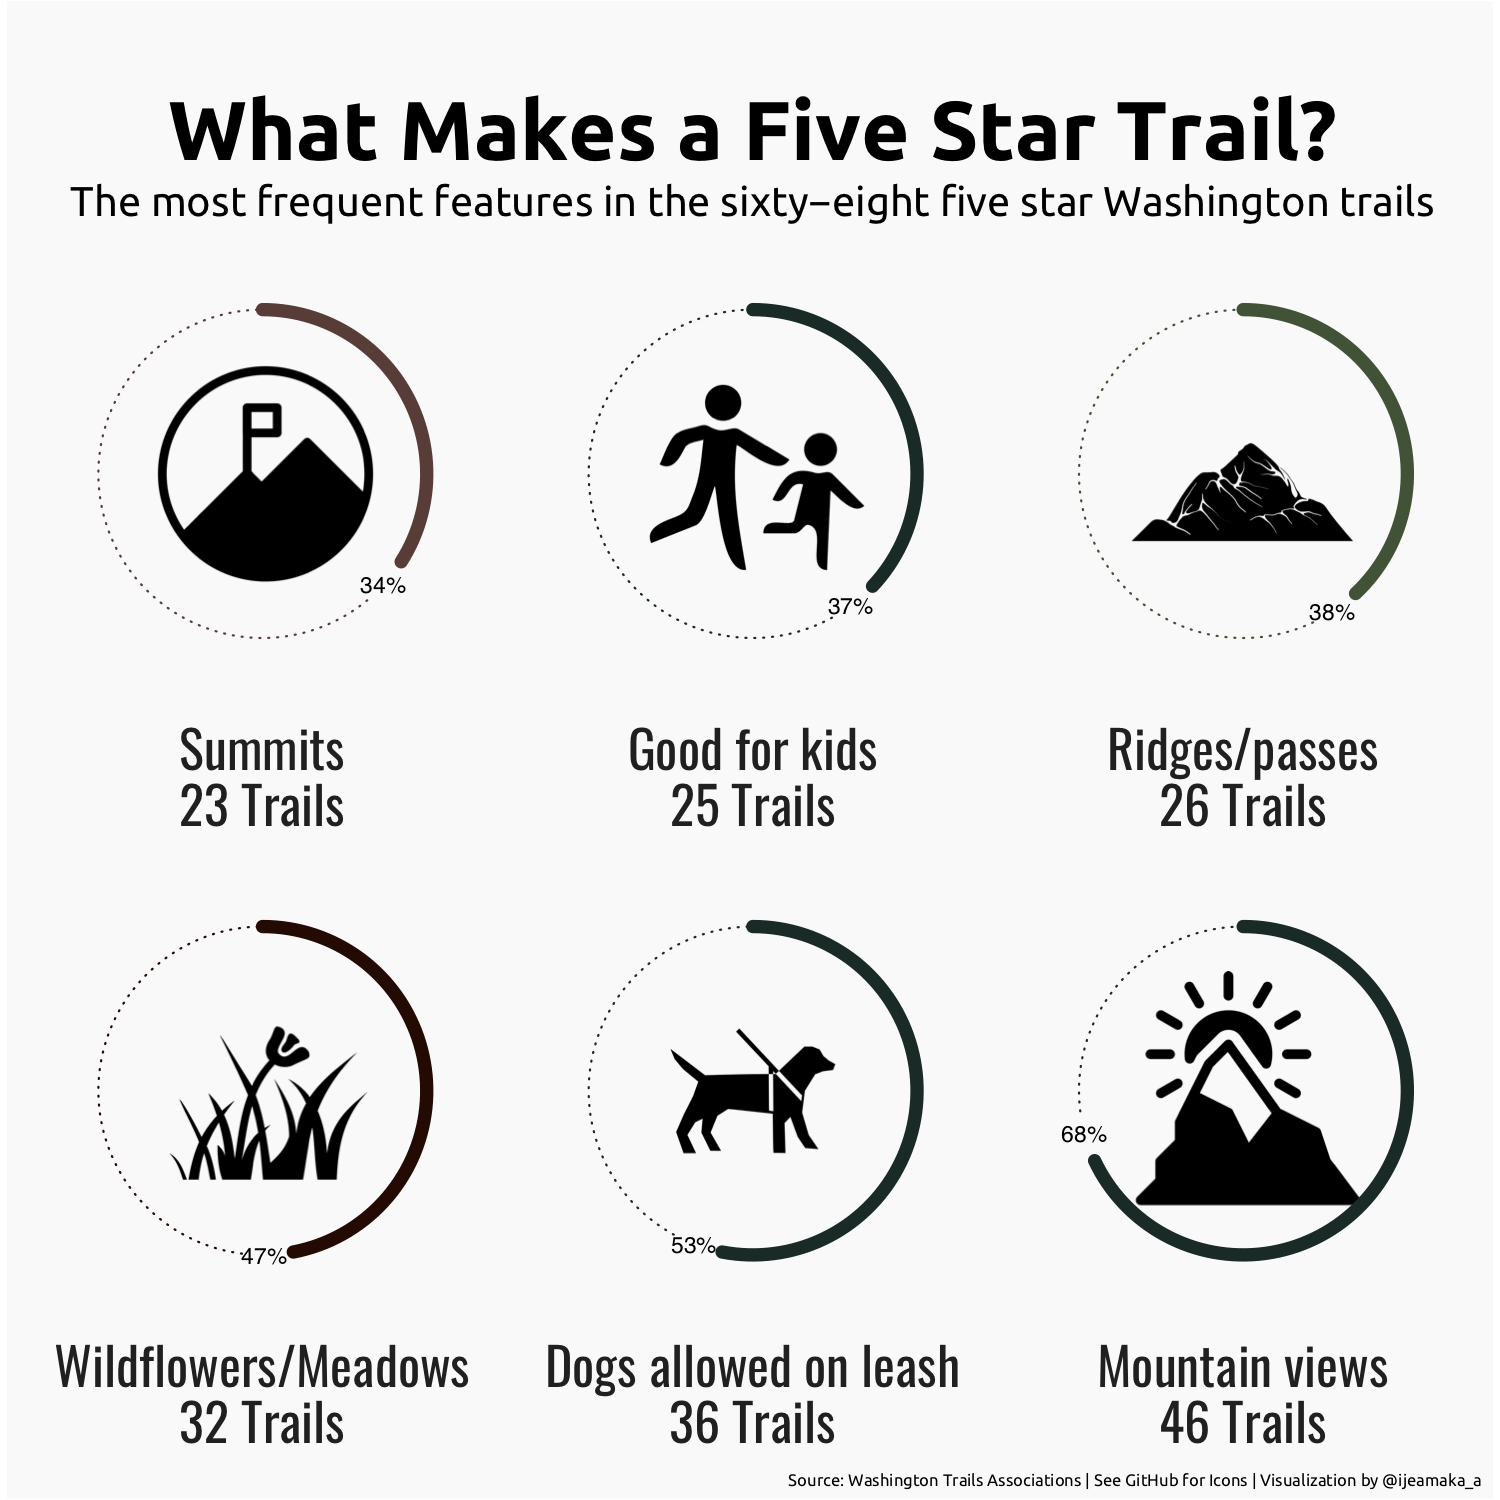
Output: 2020-18
Top features of top washington trails
Dates: 08/16/2020 - 08/23/2020
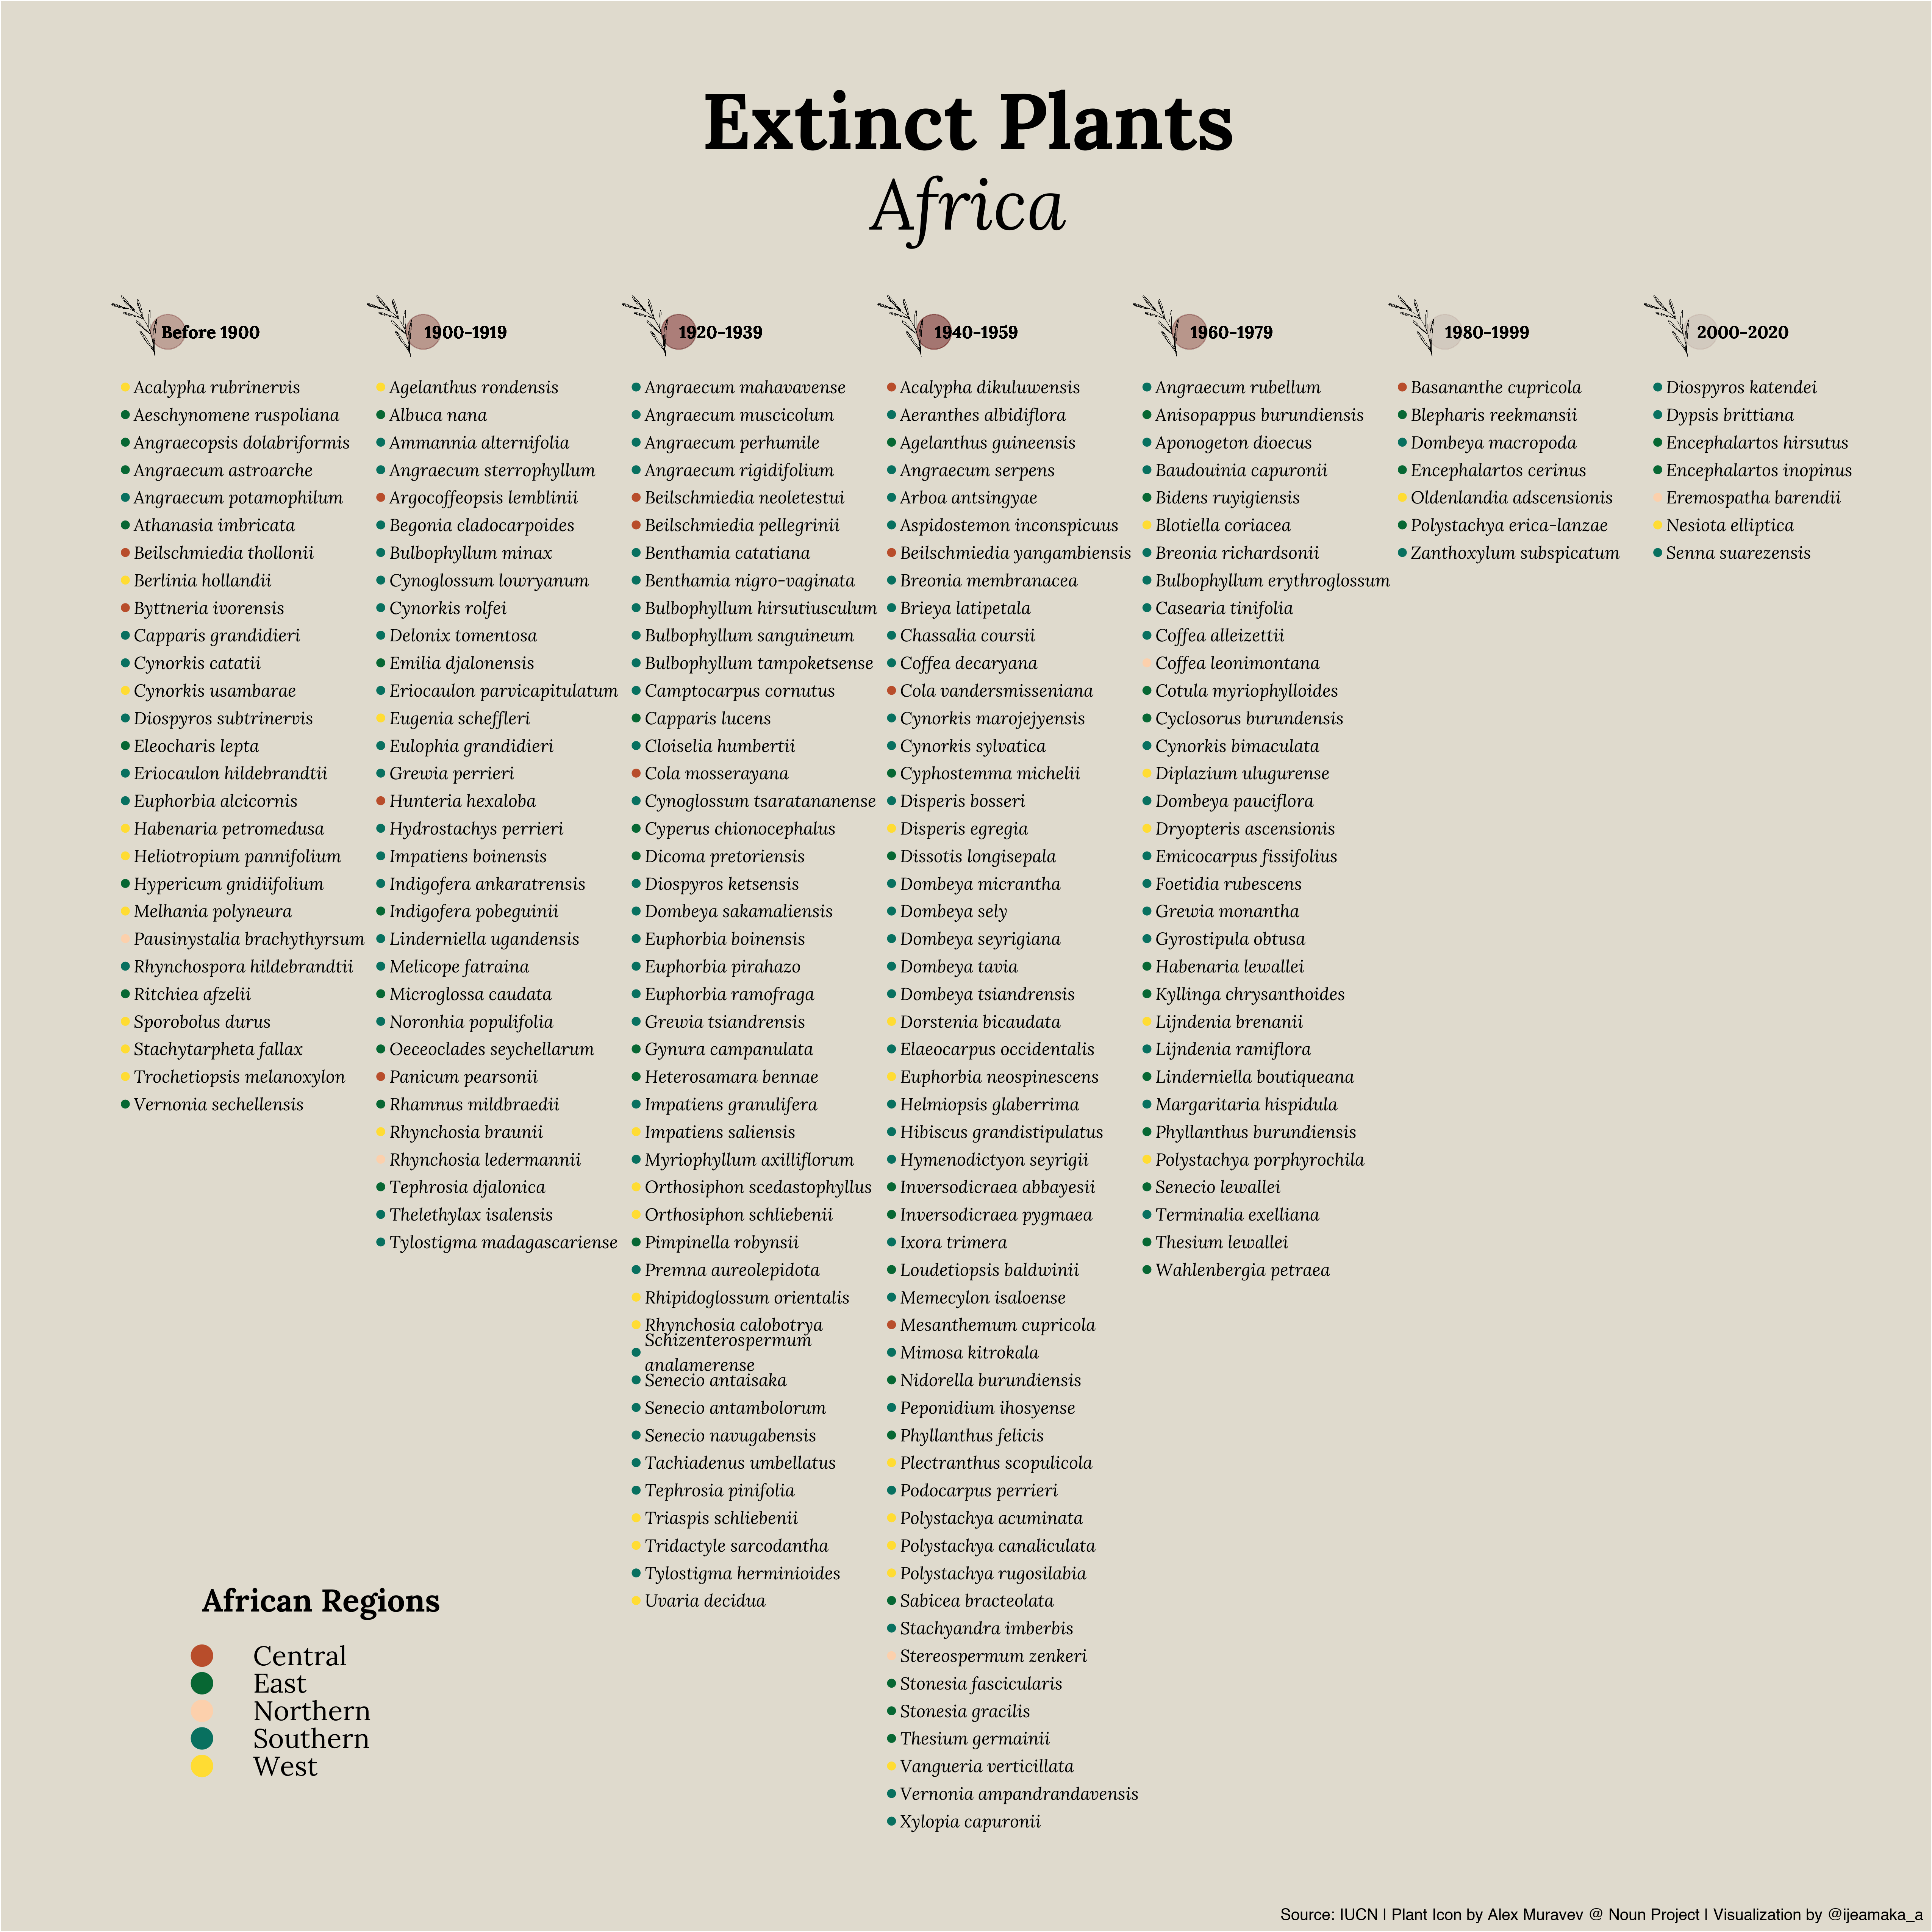
Output: 2020-17
IUN declared extinct plants in Africa
Dates: 08/09/2020 - 08/15/2020
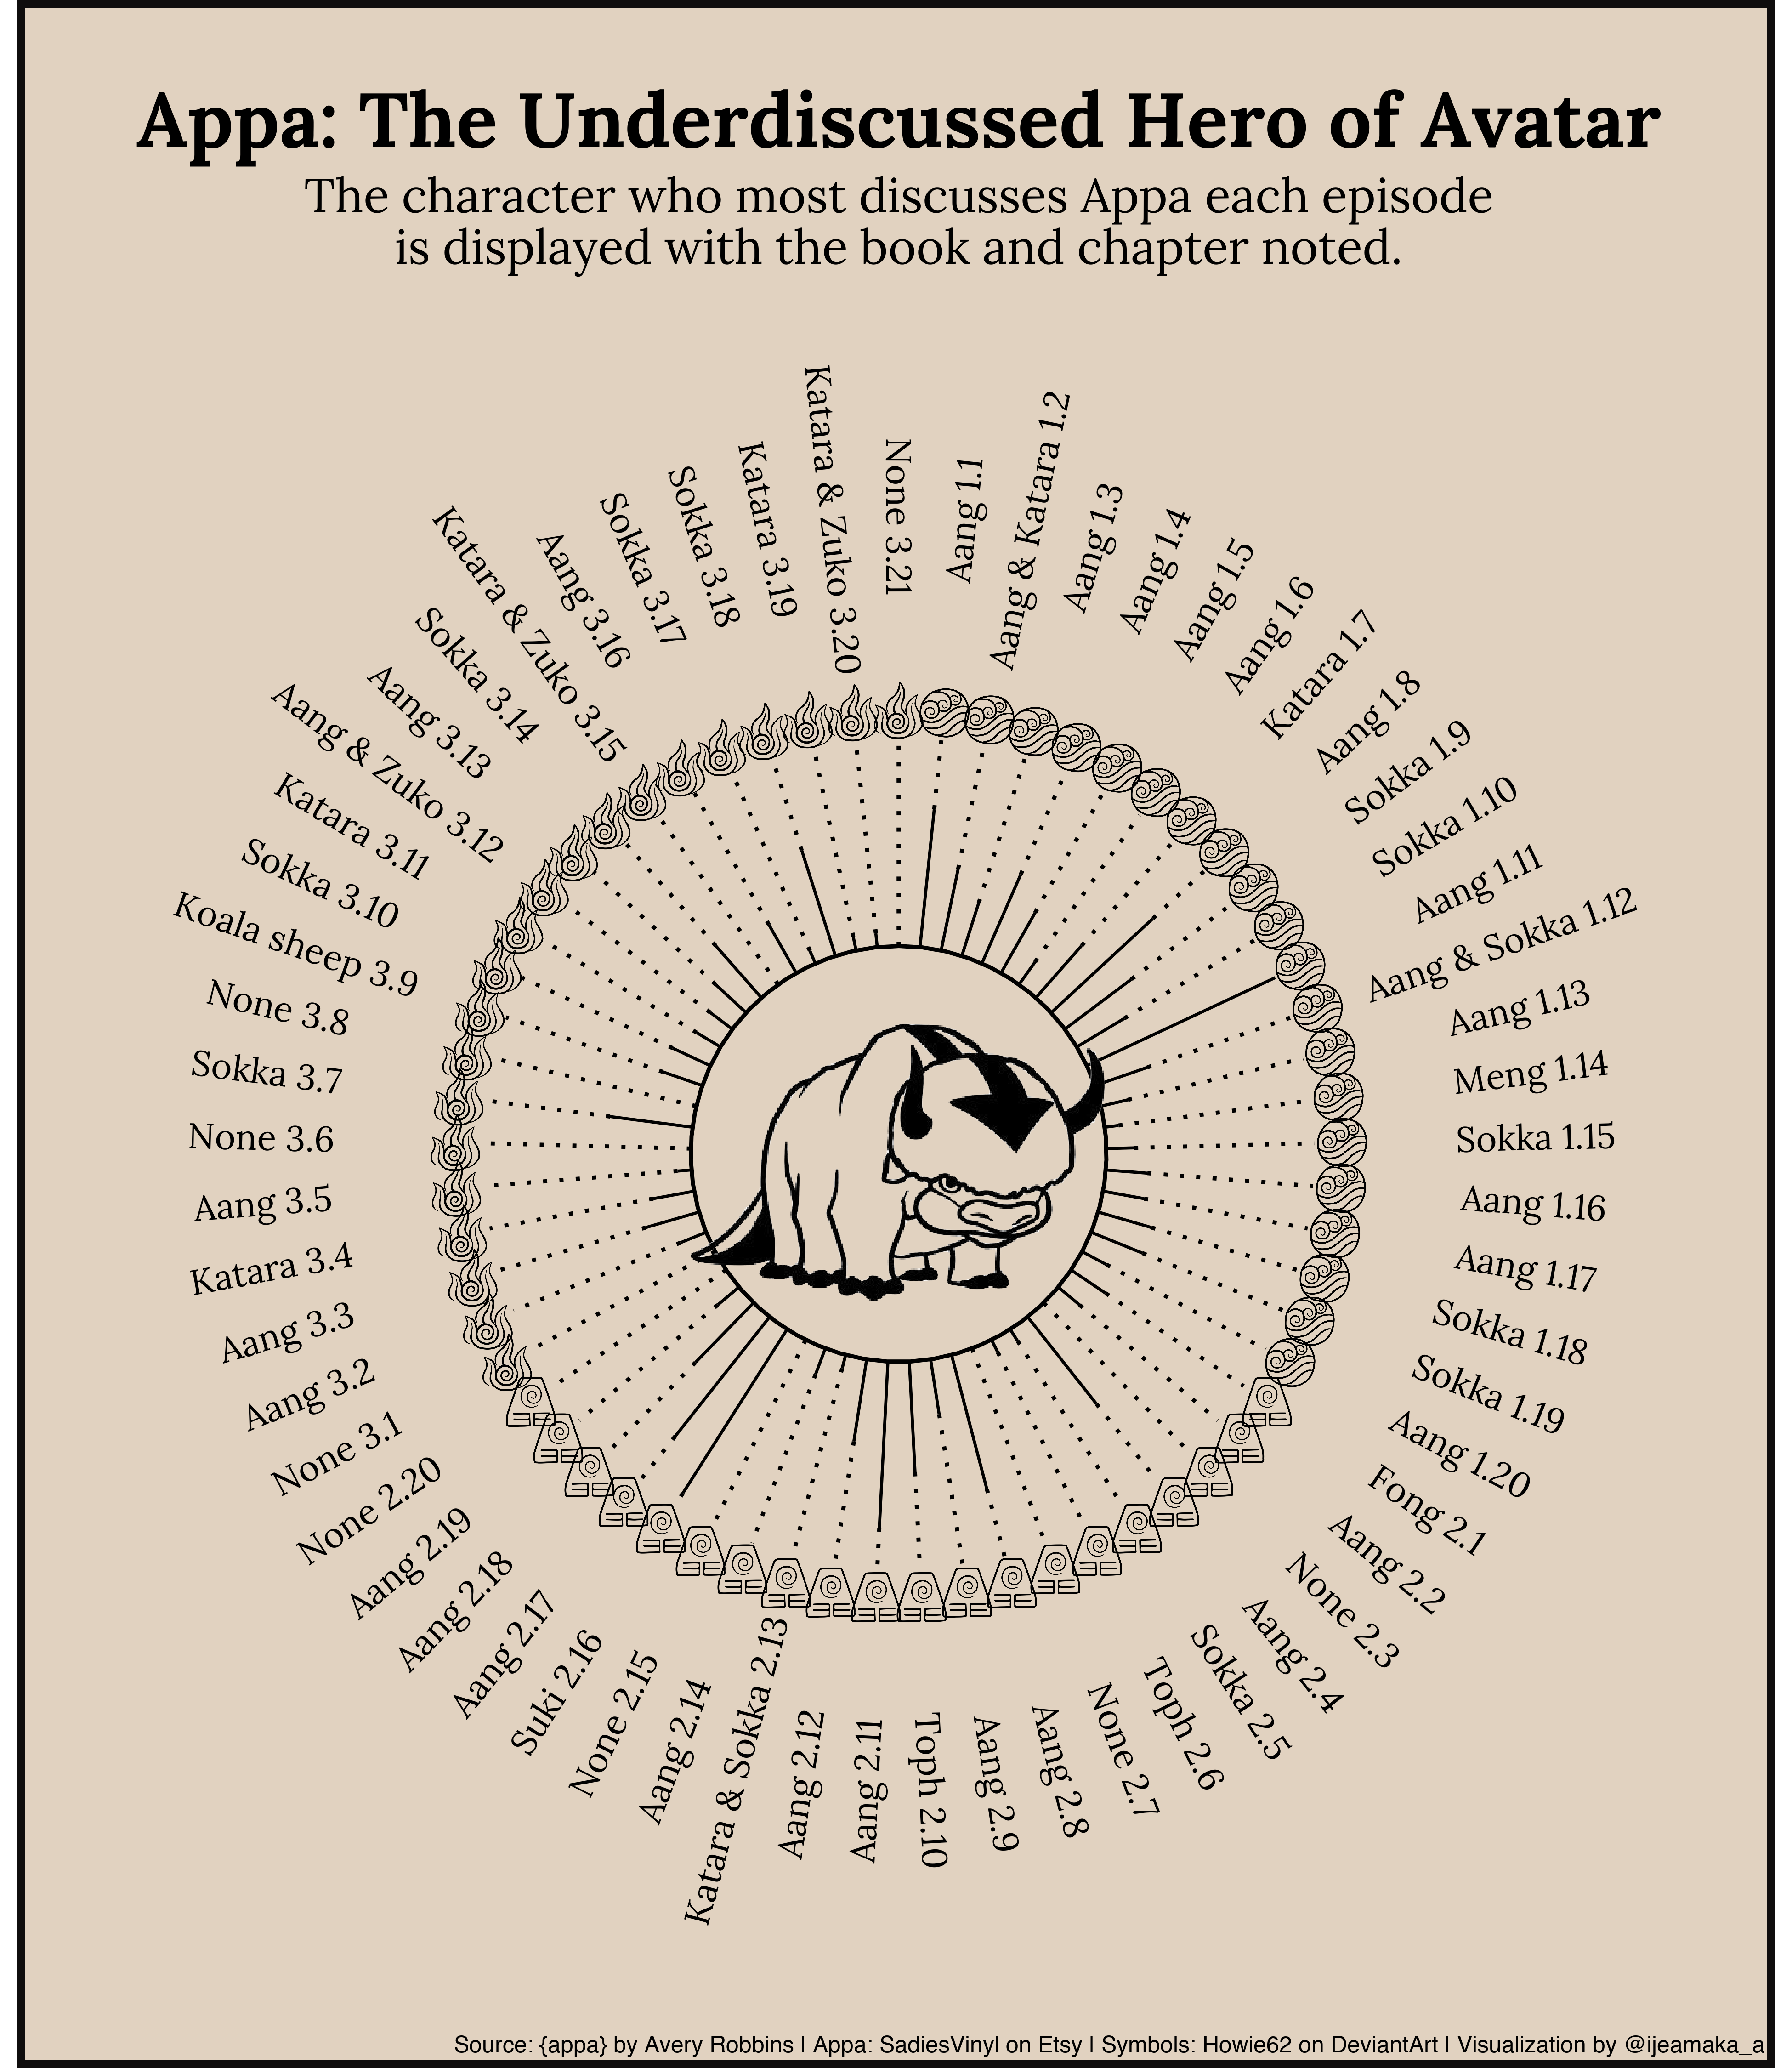
Output: 2020-16
Showing the character who discussed Appa the most each episode
Dates: 08/02/2020 - 08/08/2020
Output: 2020-15
Creating imports and exports of europen energy
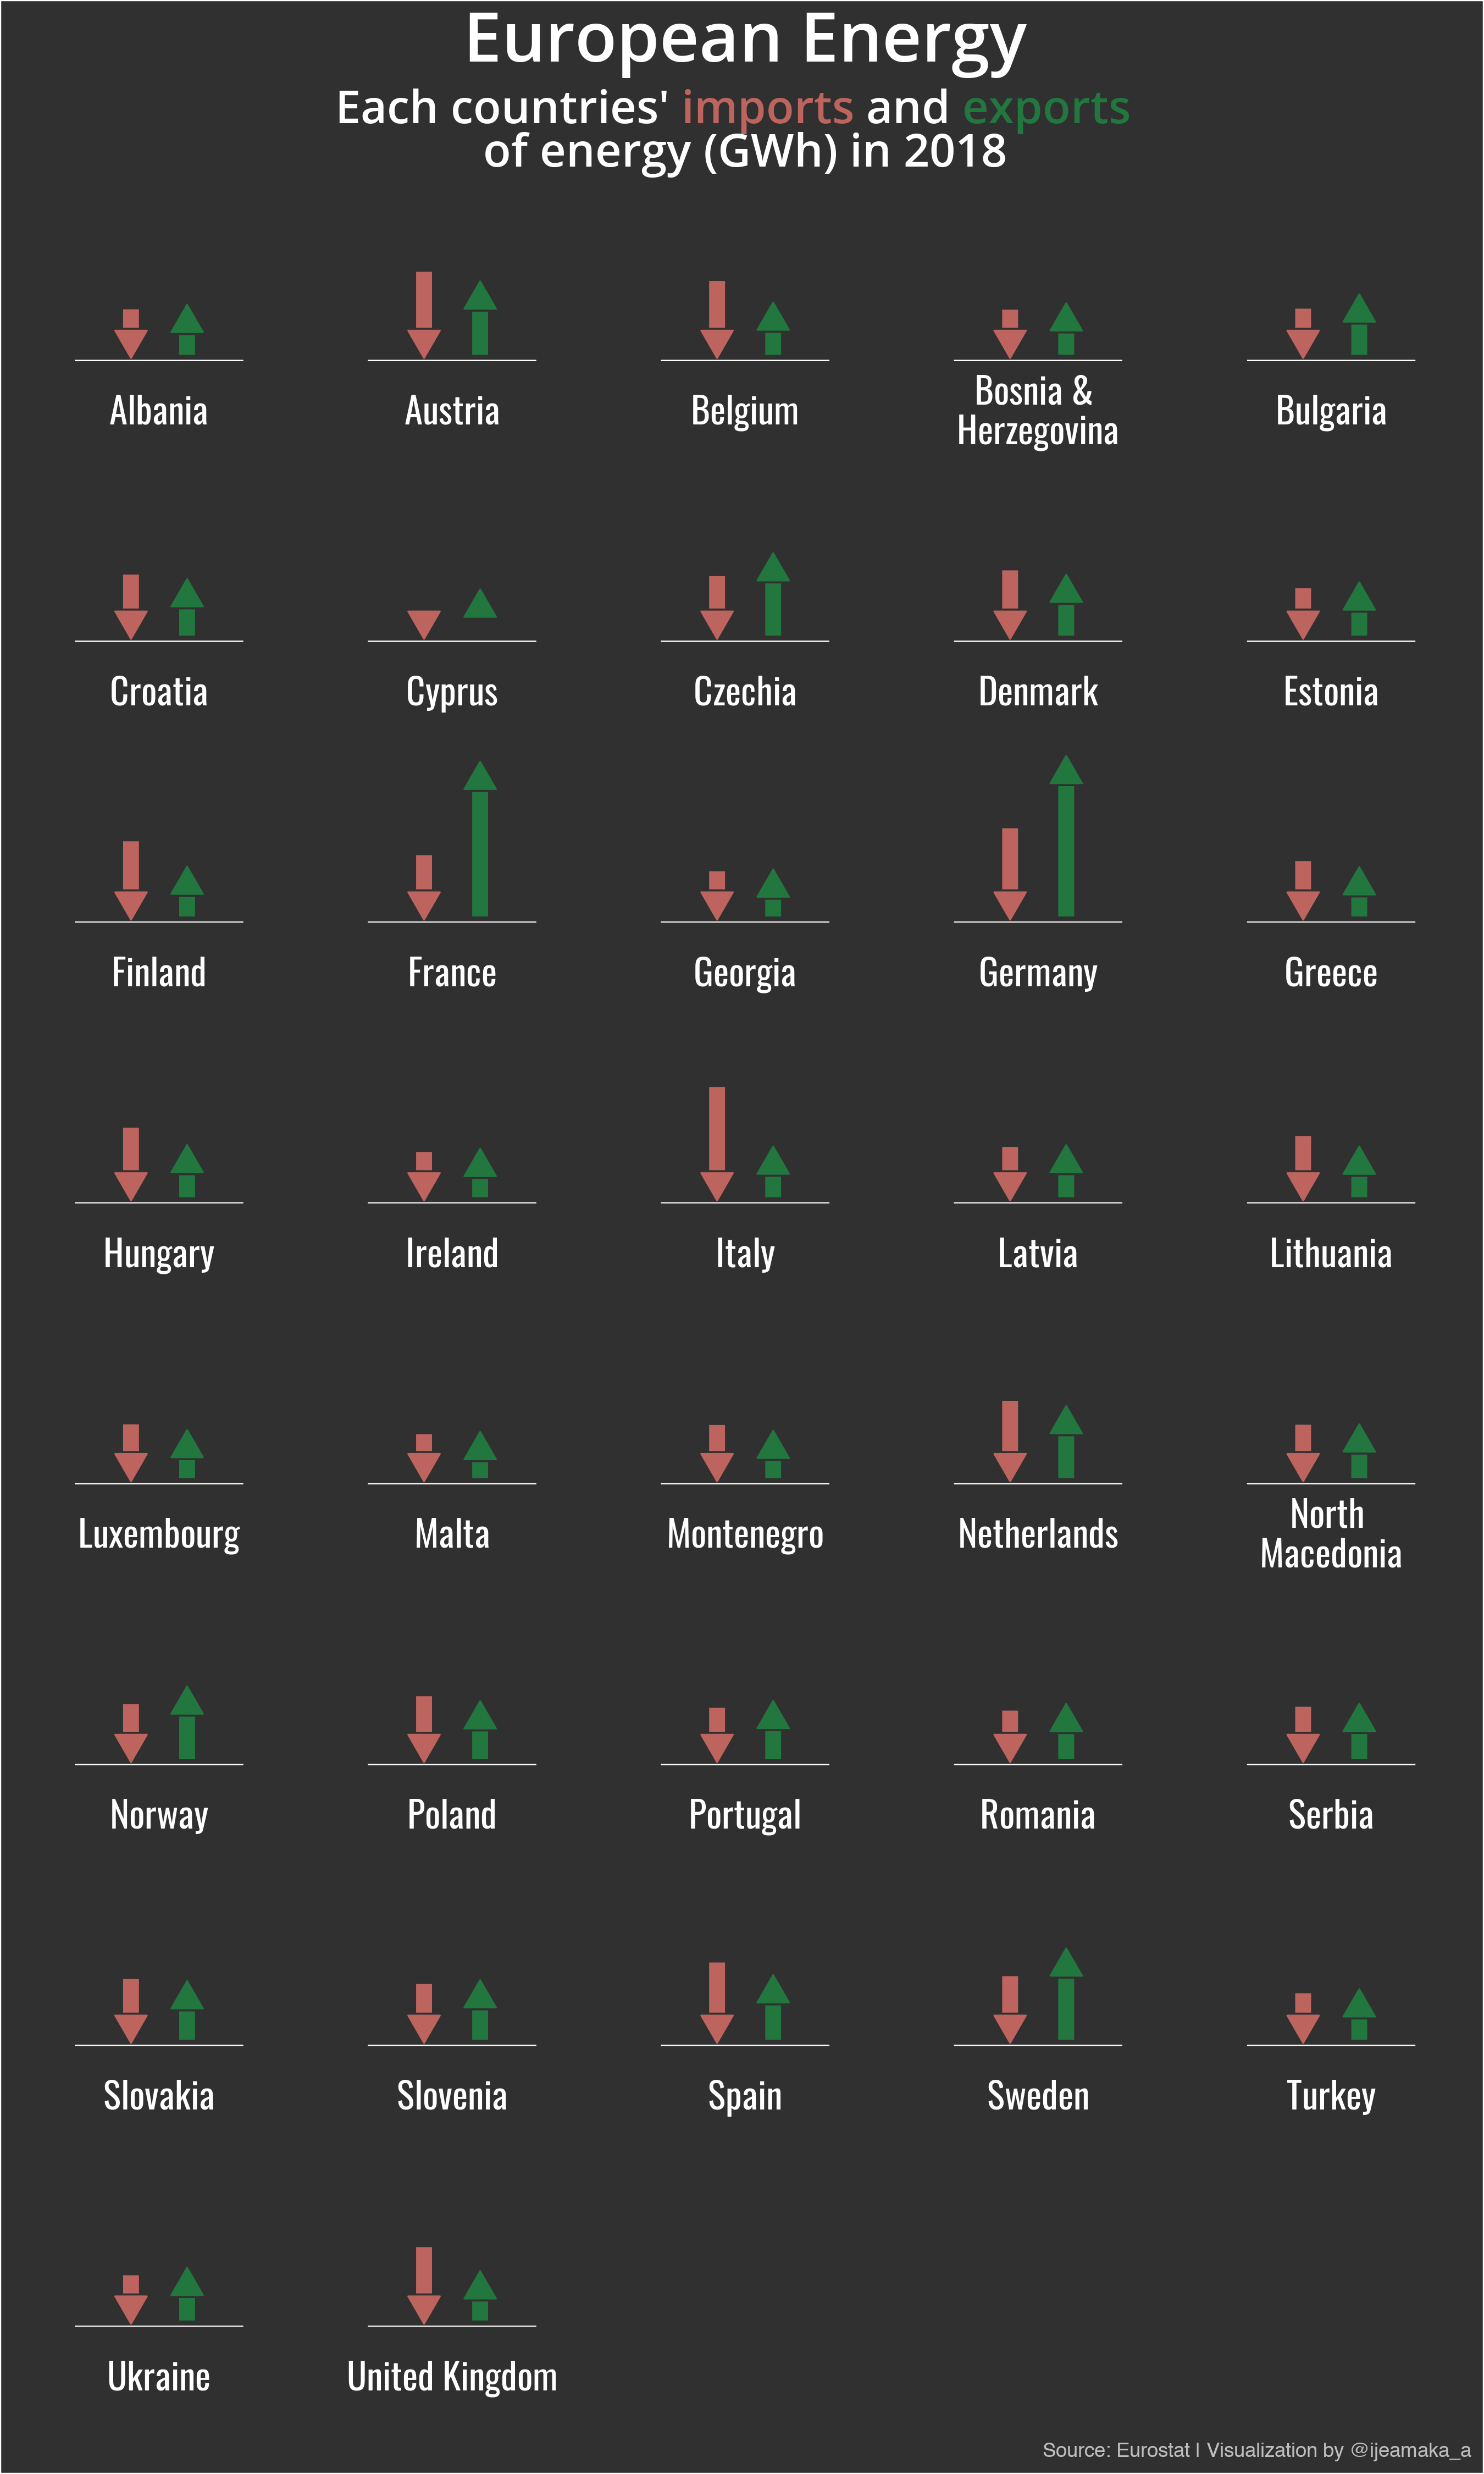
Dates: 07/26/2020 - 07/31/2020
Output: 2020-14
Used ggimage to create pictograms
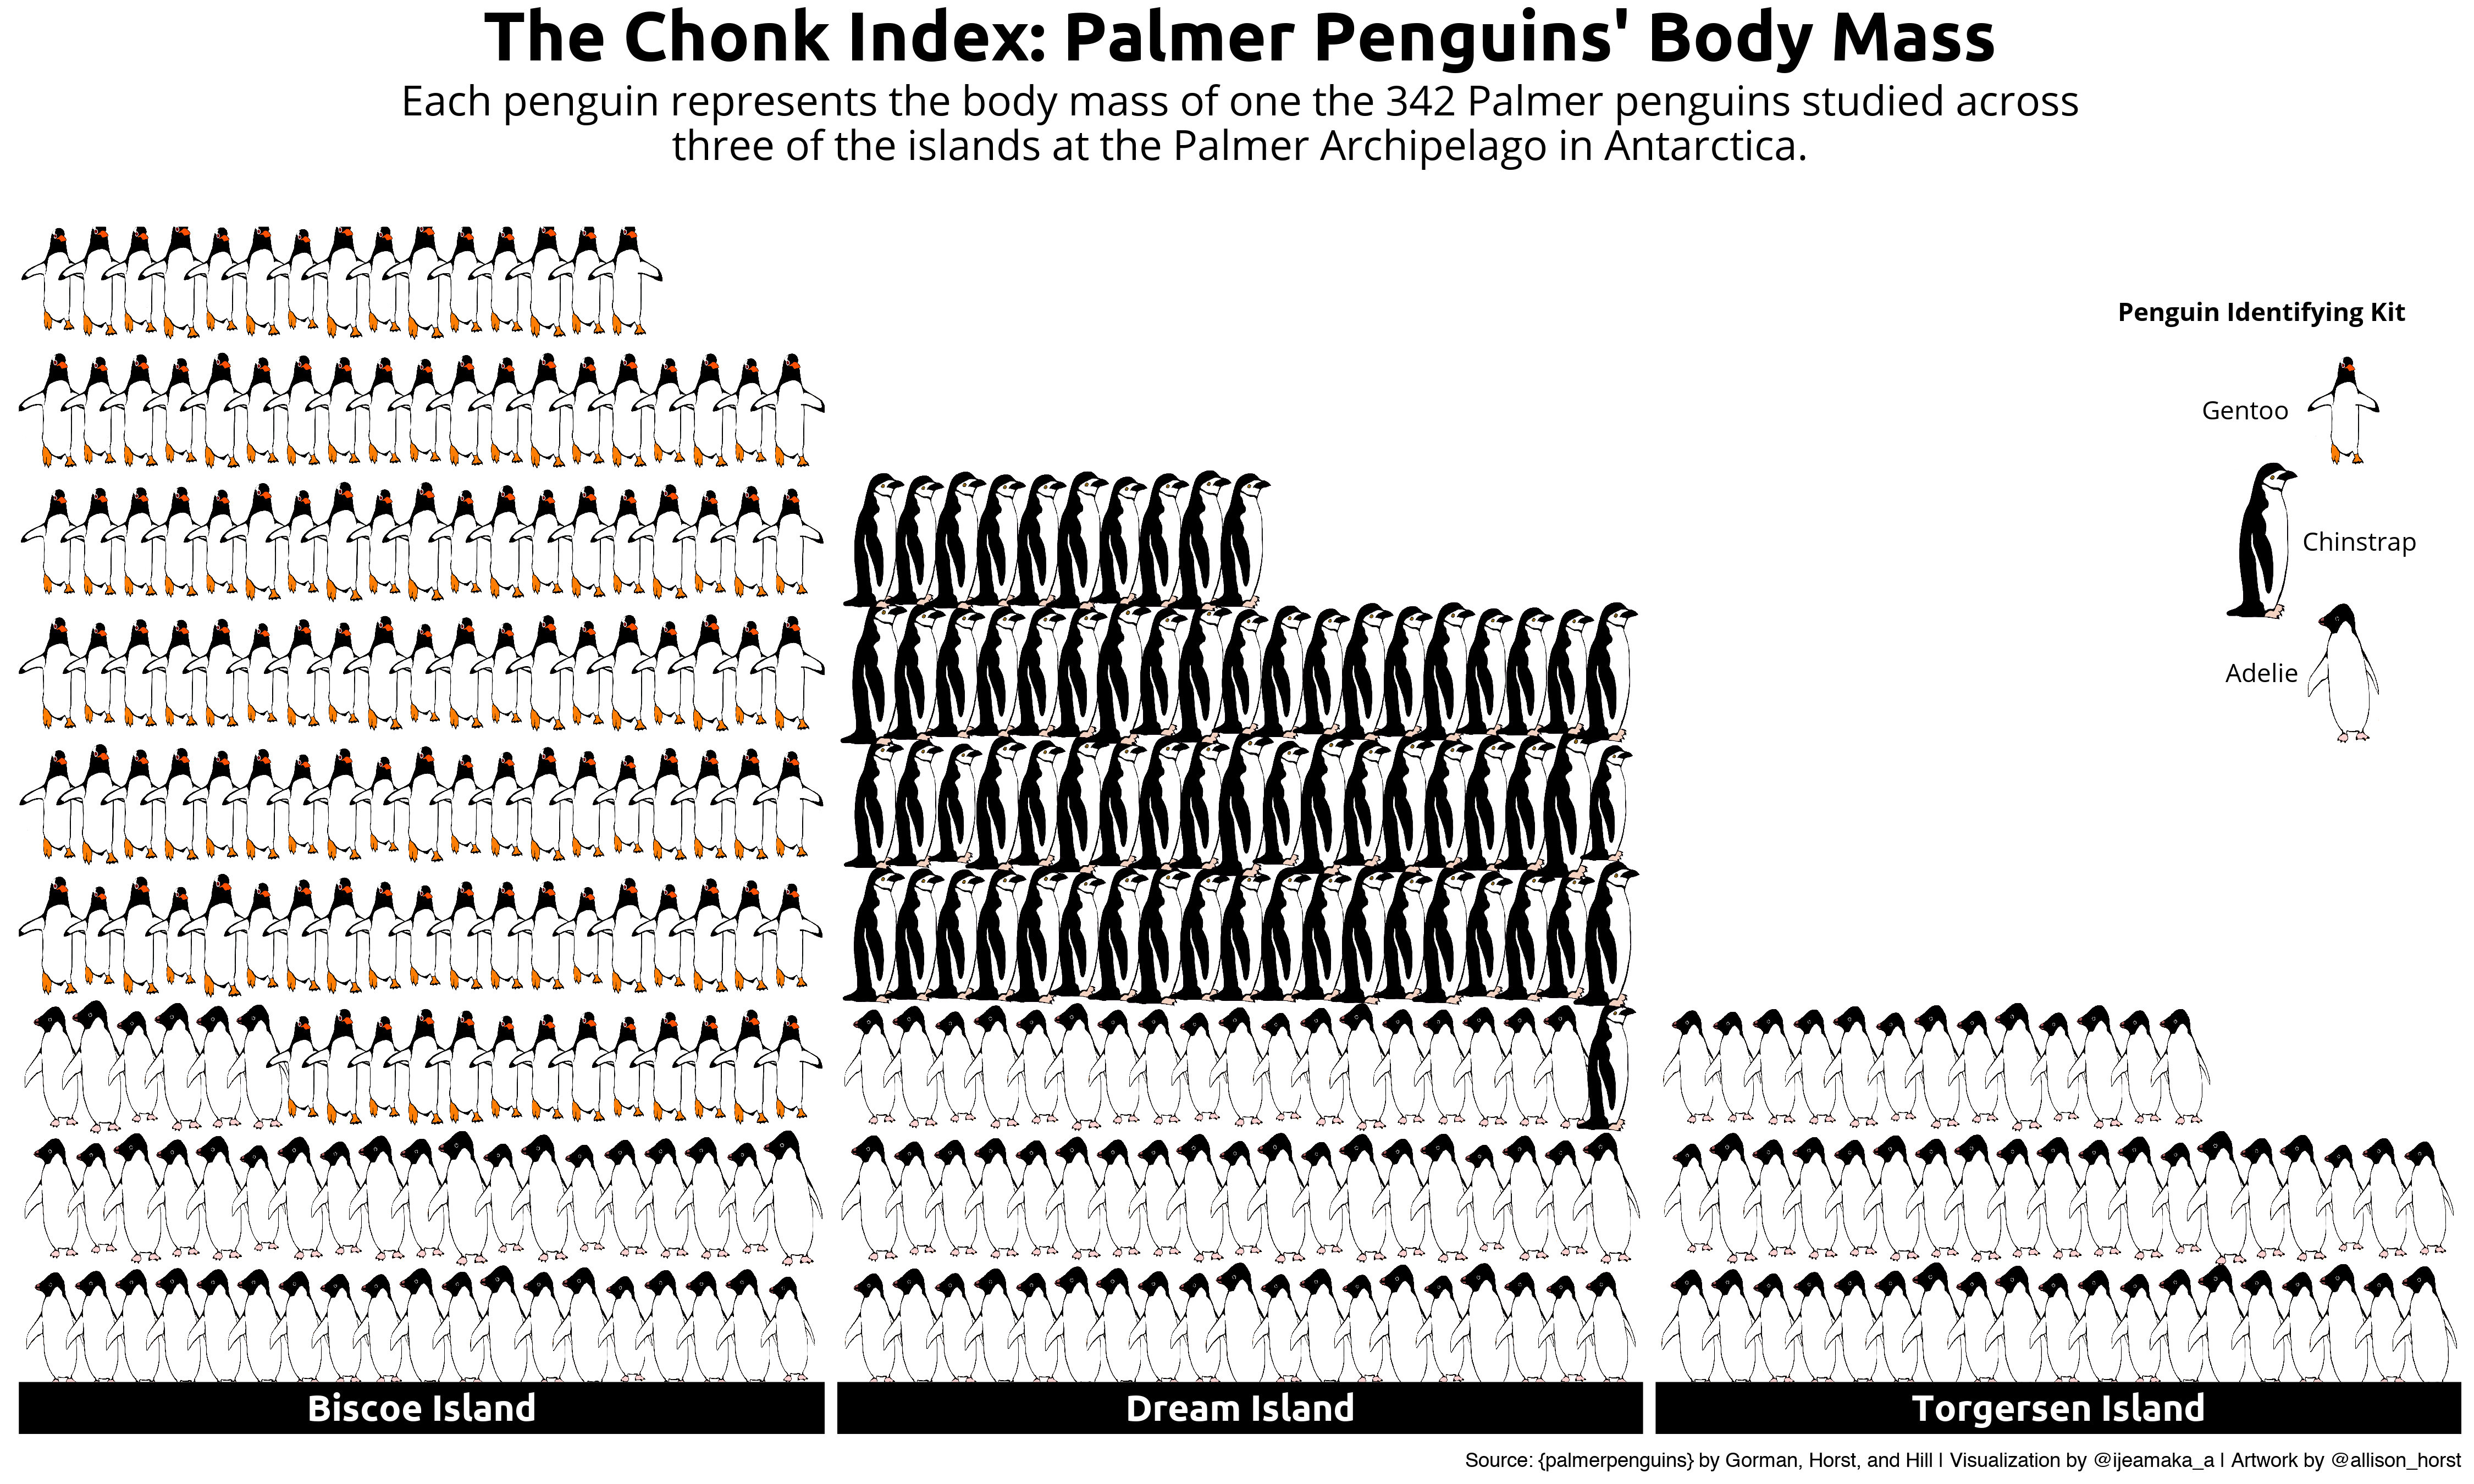
Dates: 07/19/2020 - 07/25/2020
Output: 2020-13
Was slightly uninspired, so decided to use {ggforce} to create dog and cat paws.
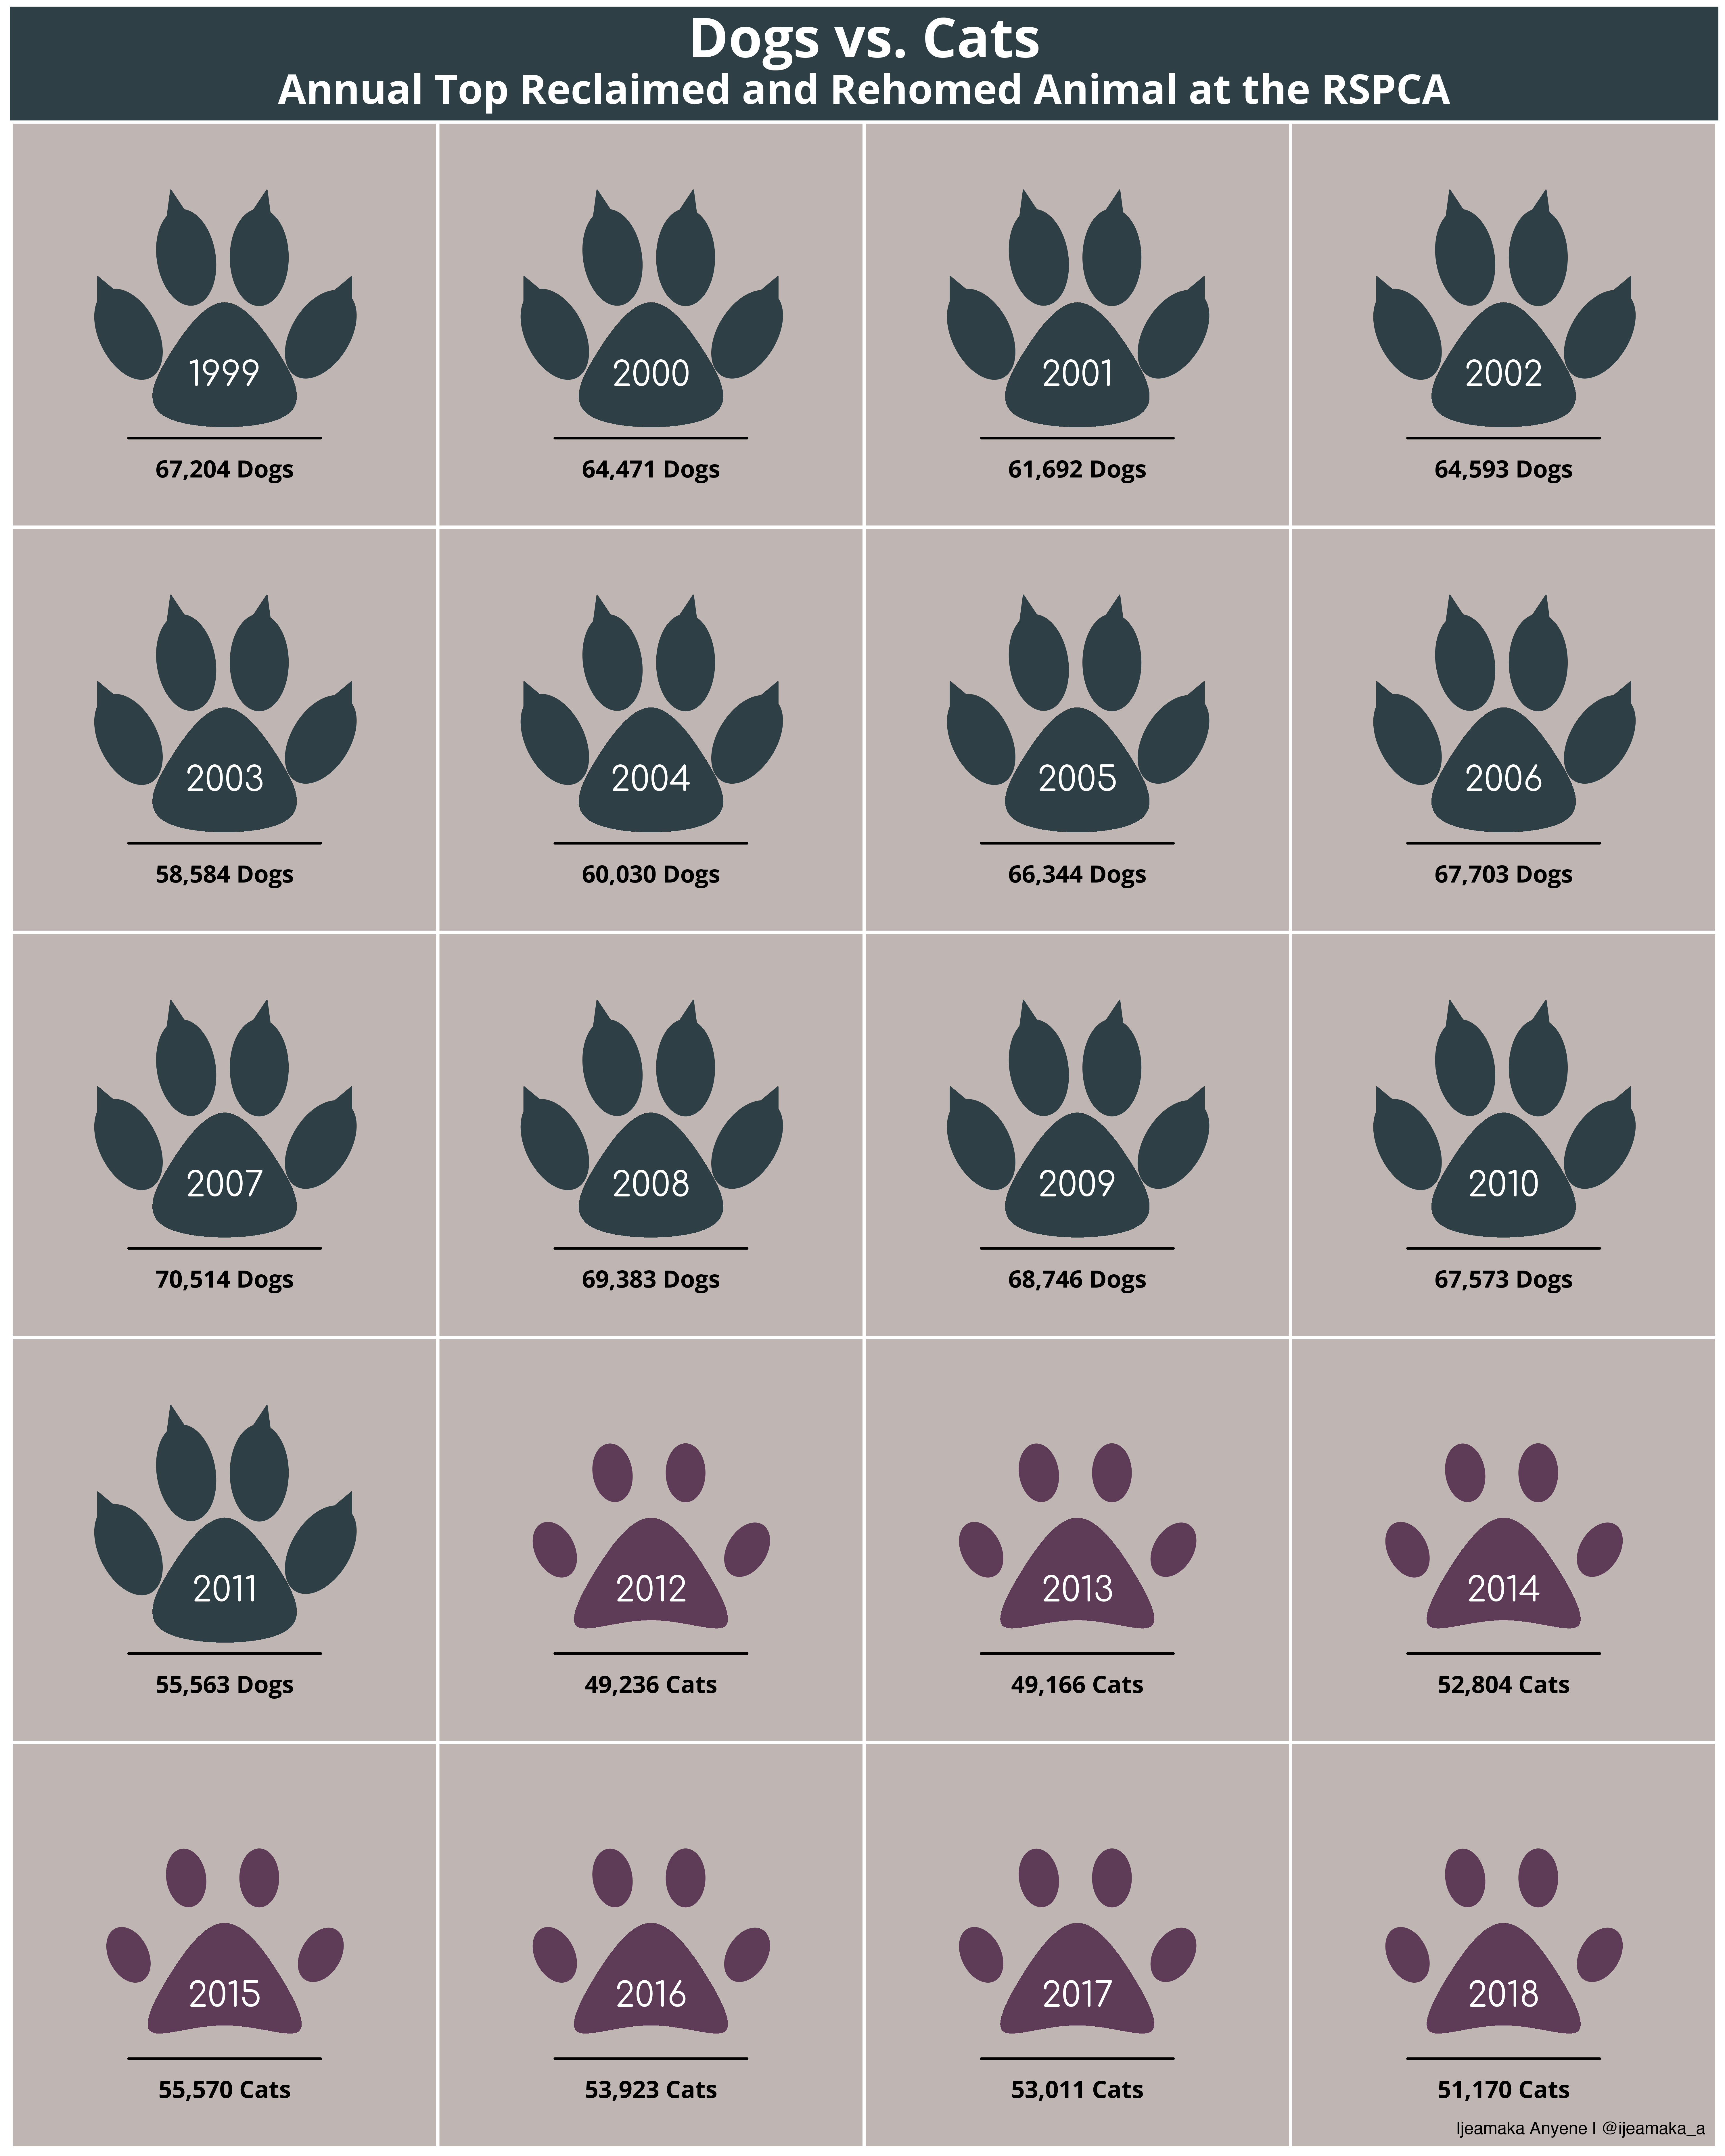
Dates: 07/12/2020 - 07/18/2020
Output: 2020-12
Took a bit of a break because ...of 2020 things. I tried to recreate the Milky Way where the "stars" are the cumulative number of years spent in space by each astronaut.
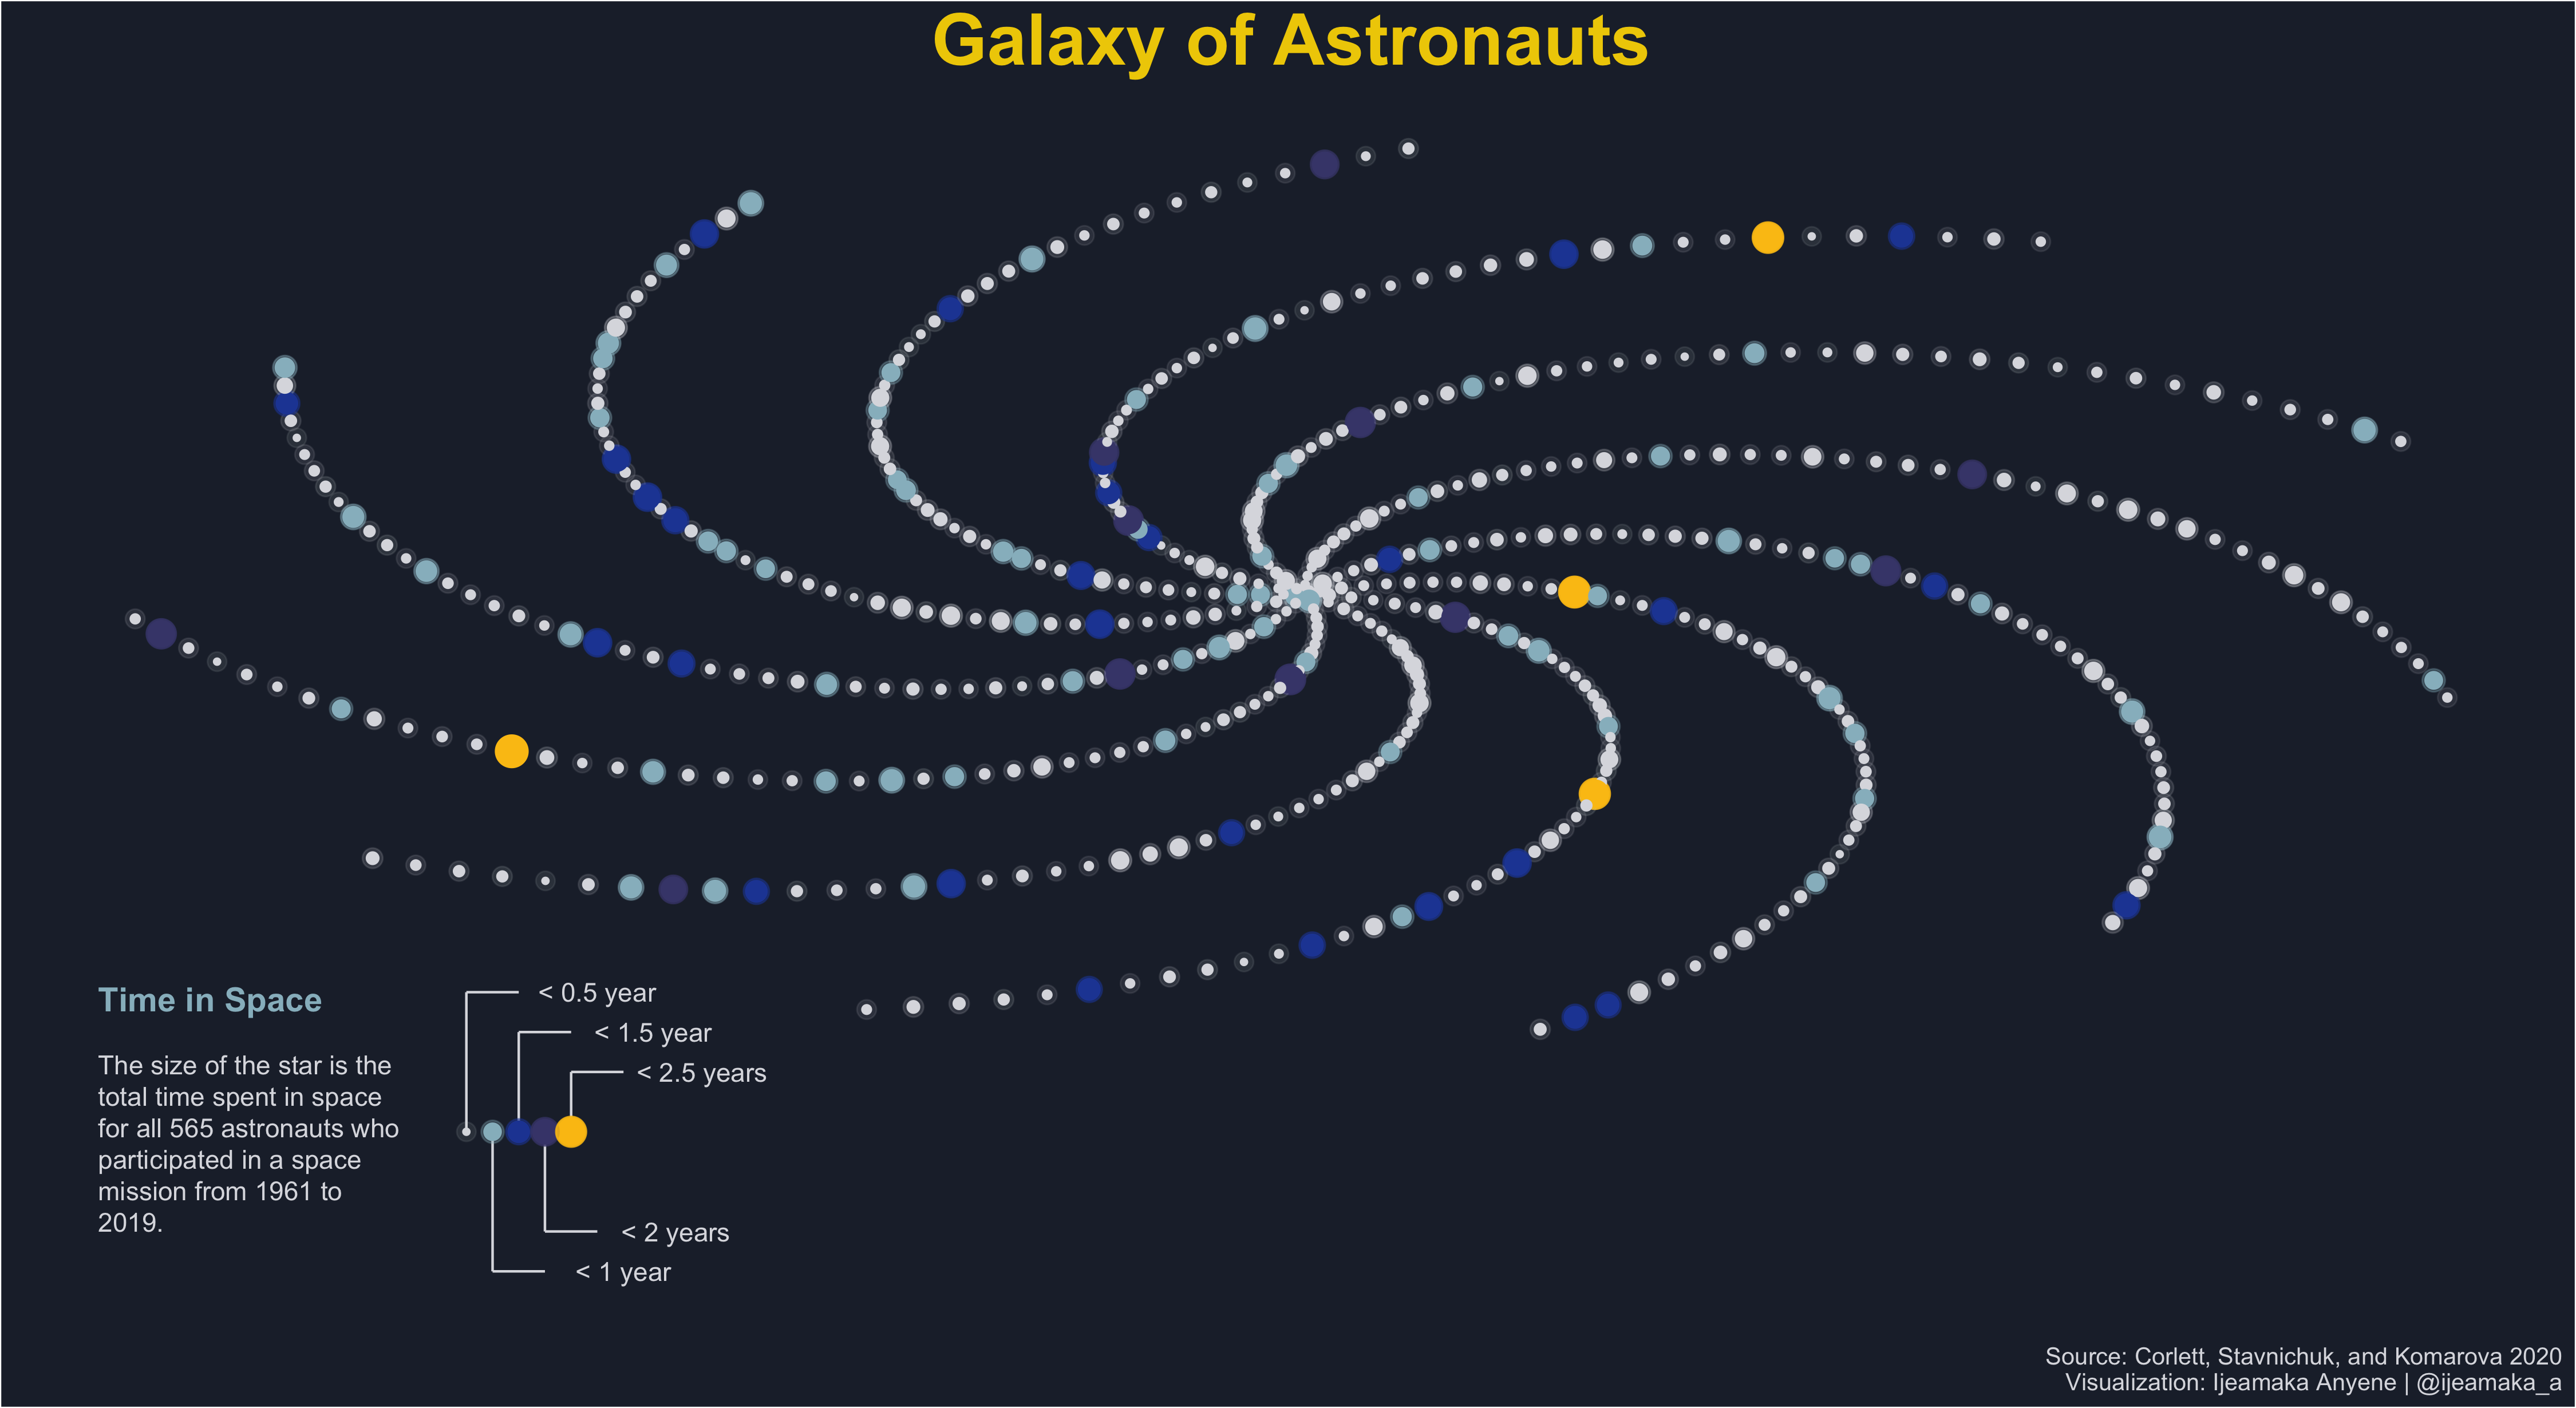
Dates: 05/24/2020 - 05/30/2020
Output: 2020-11
Created doughnut plots of percentage of drink that is Tequila
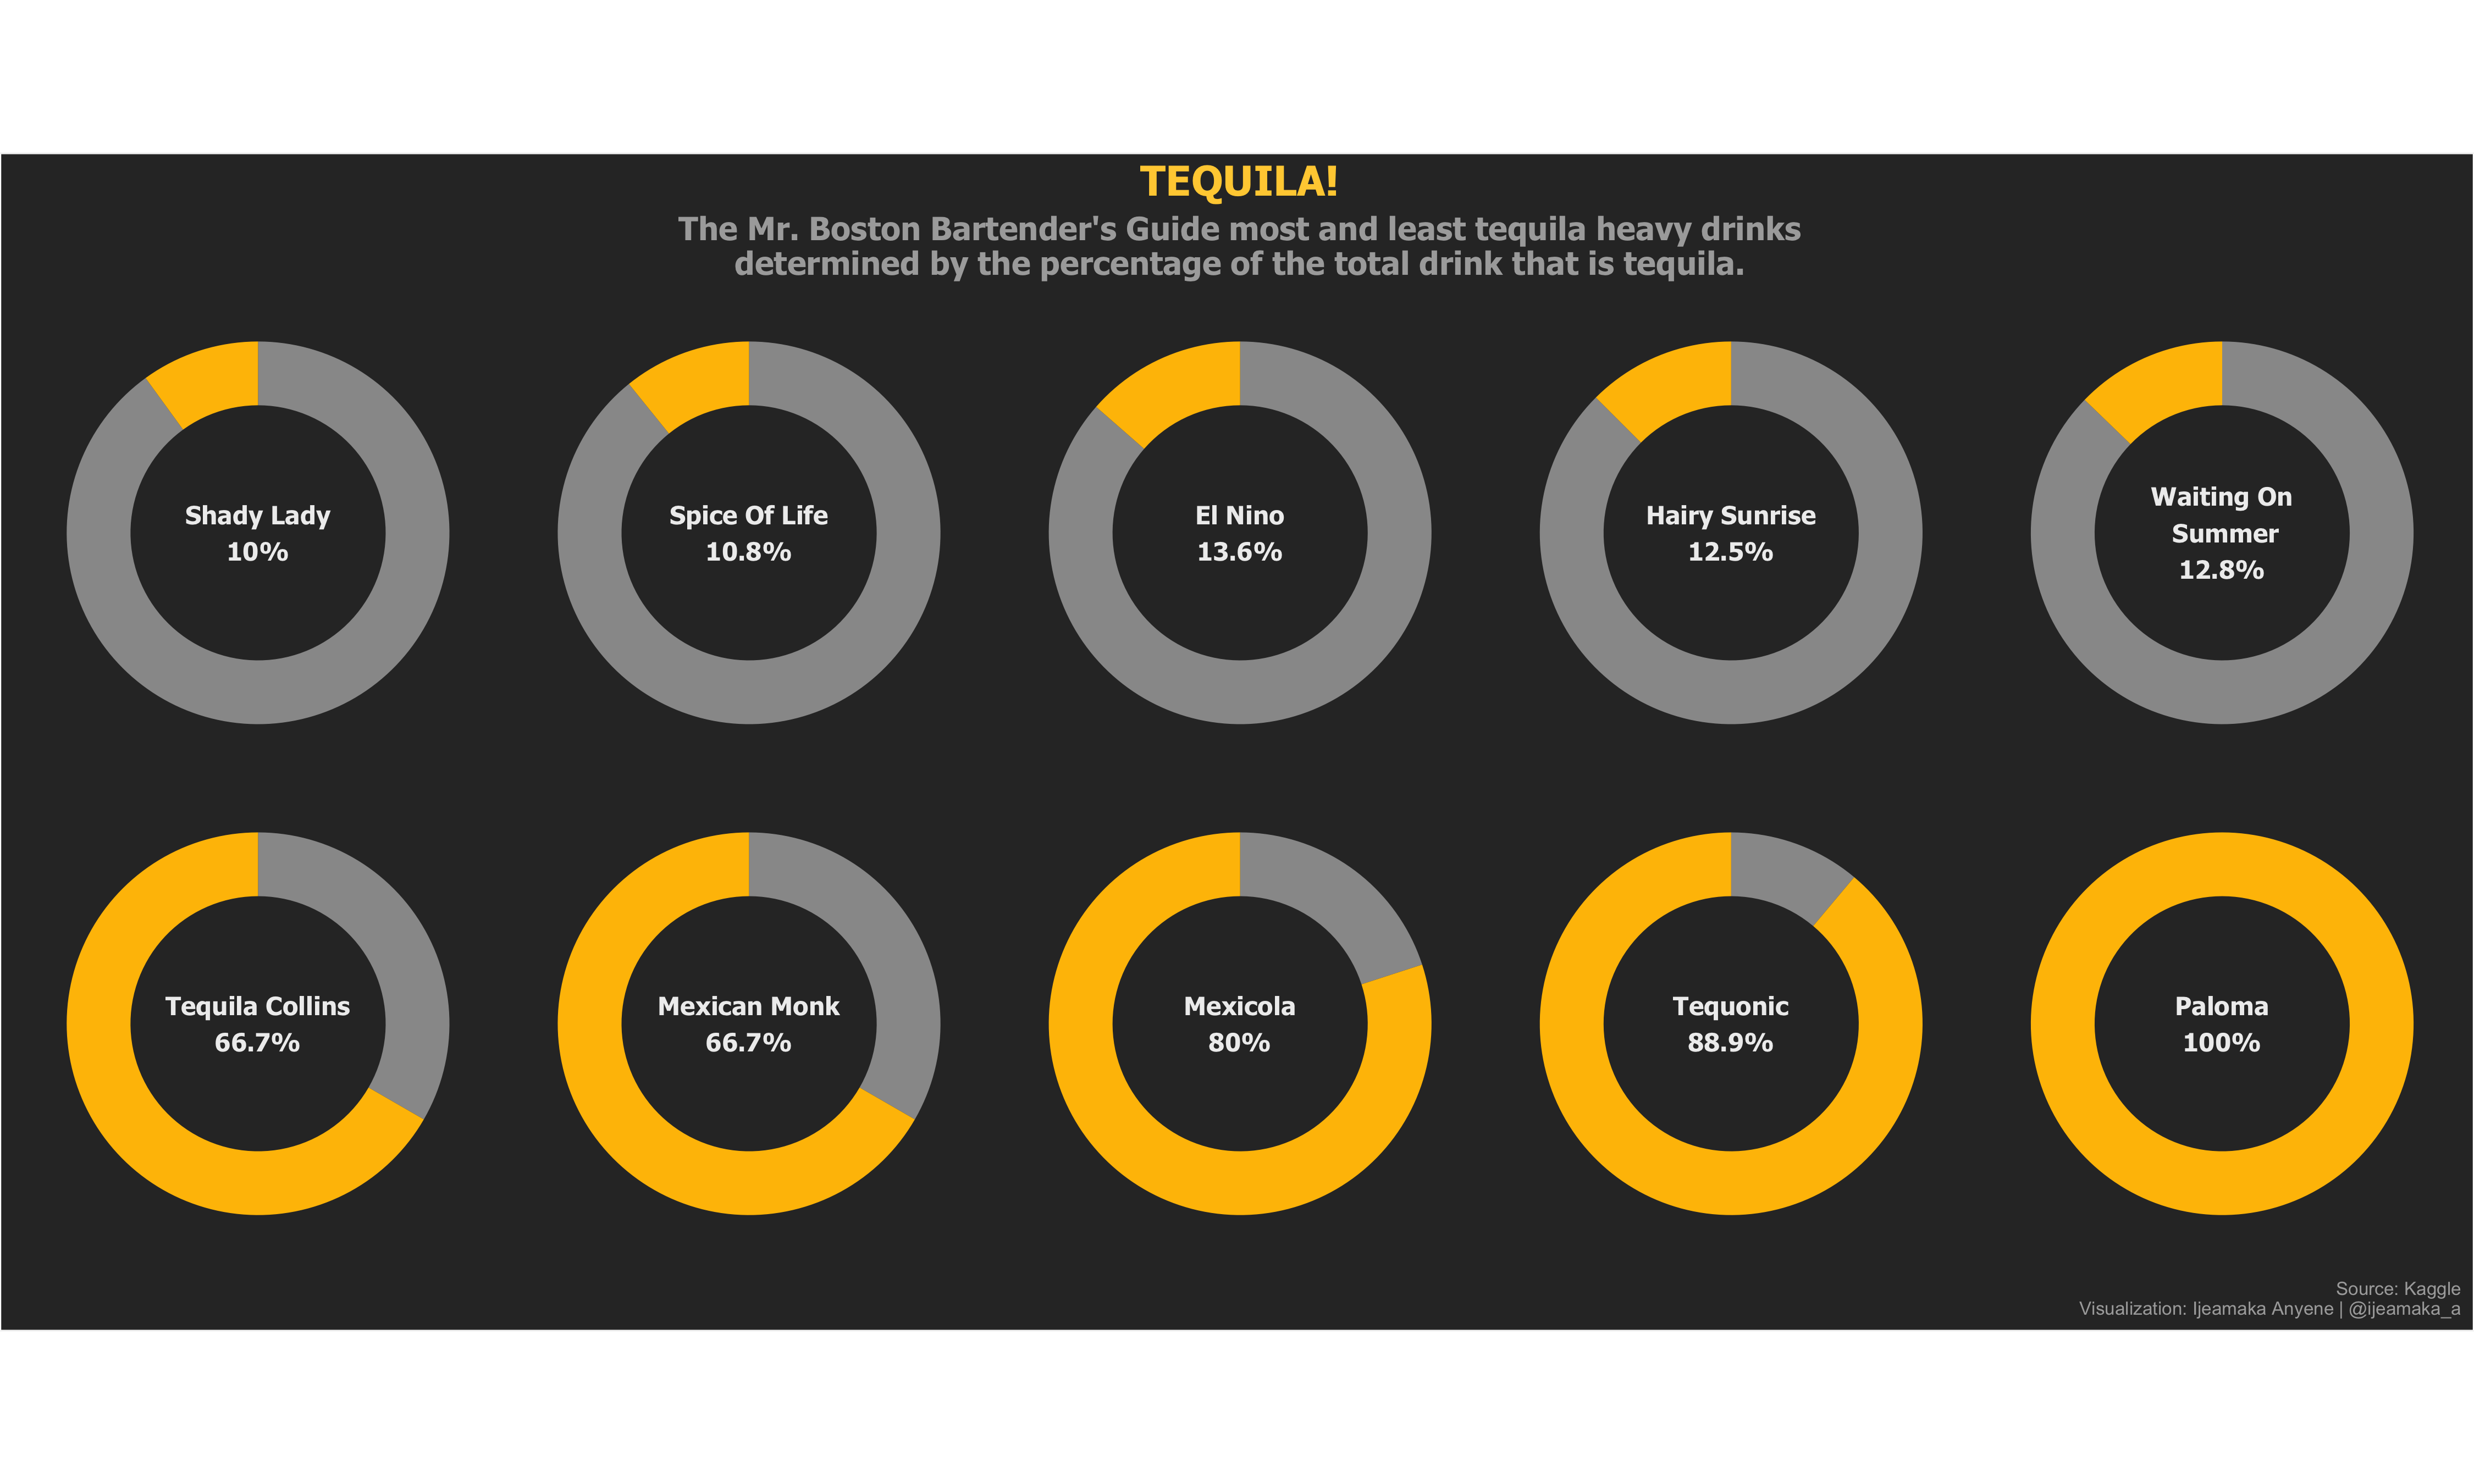
Dates: 05/10/2020 - 05/16/2020
Output: 2020-10
Created a timeline of volcanic erruptions within the United States.
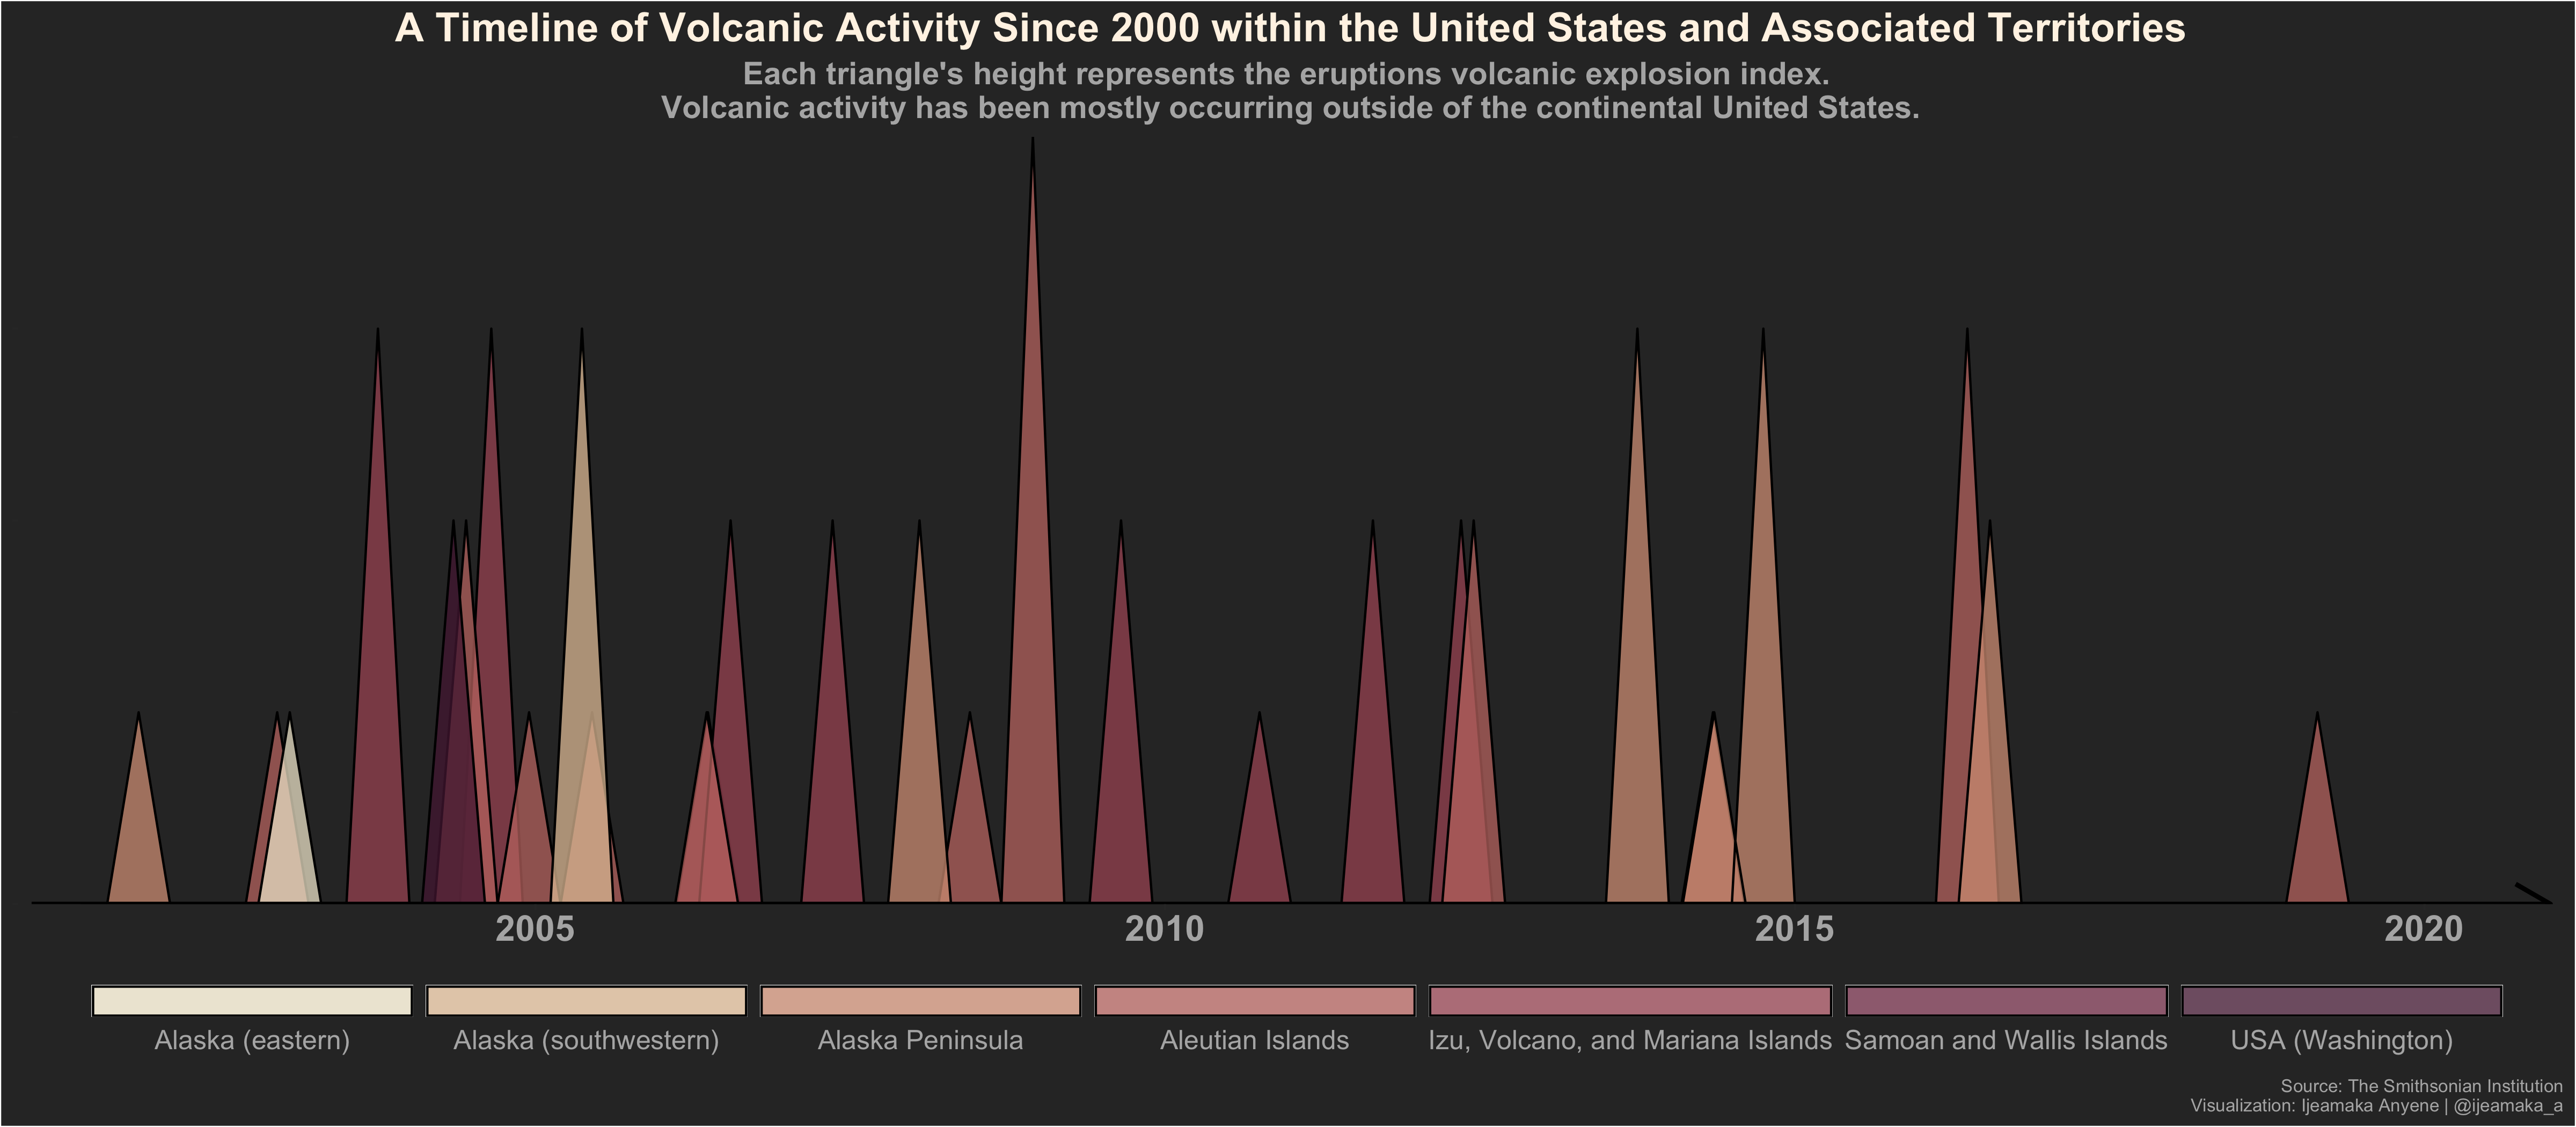
Dates: 05/03/2020 - 05/09/2020
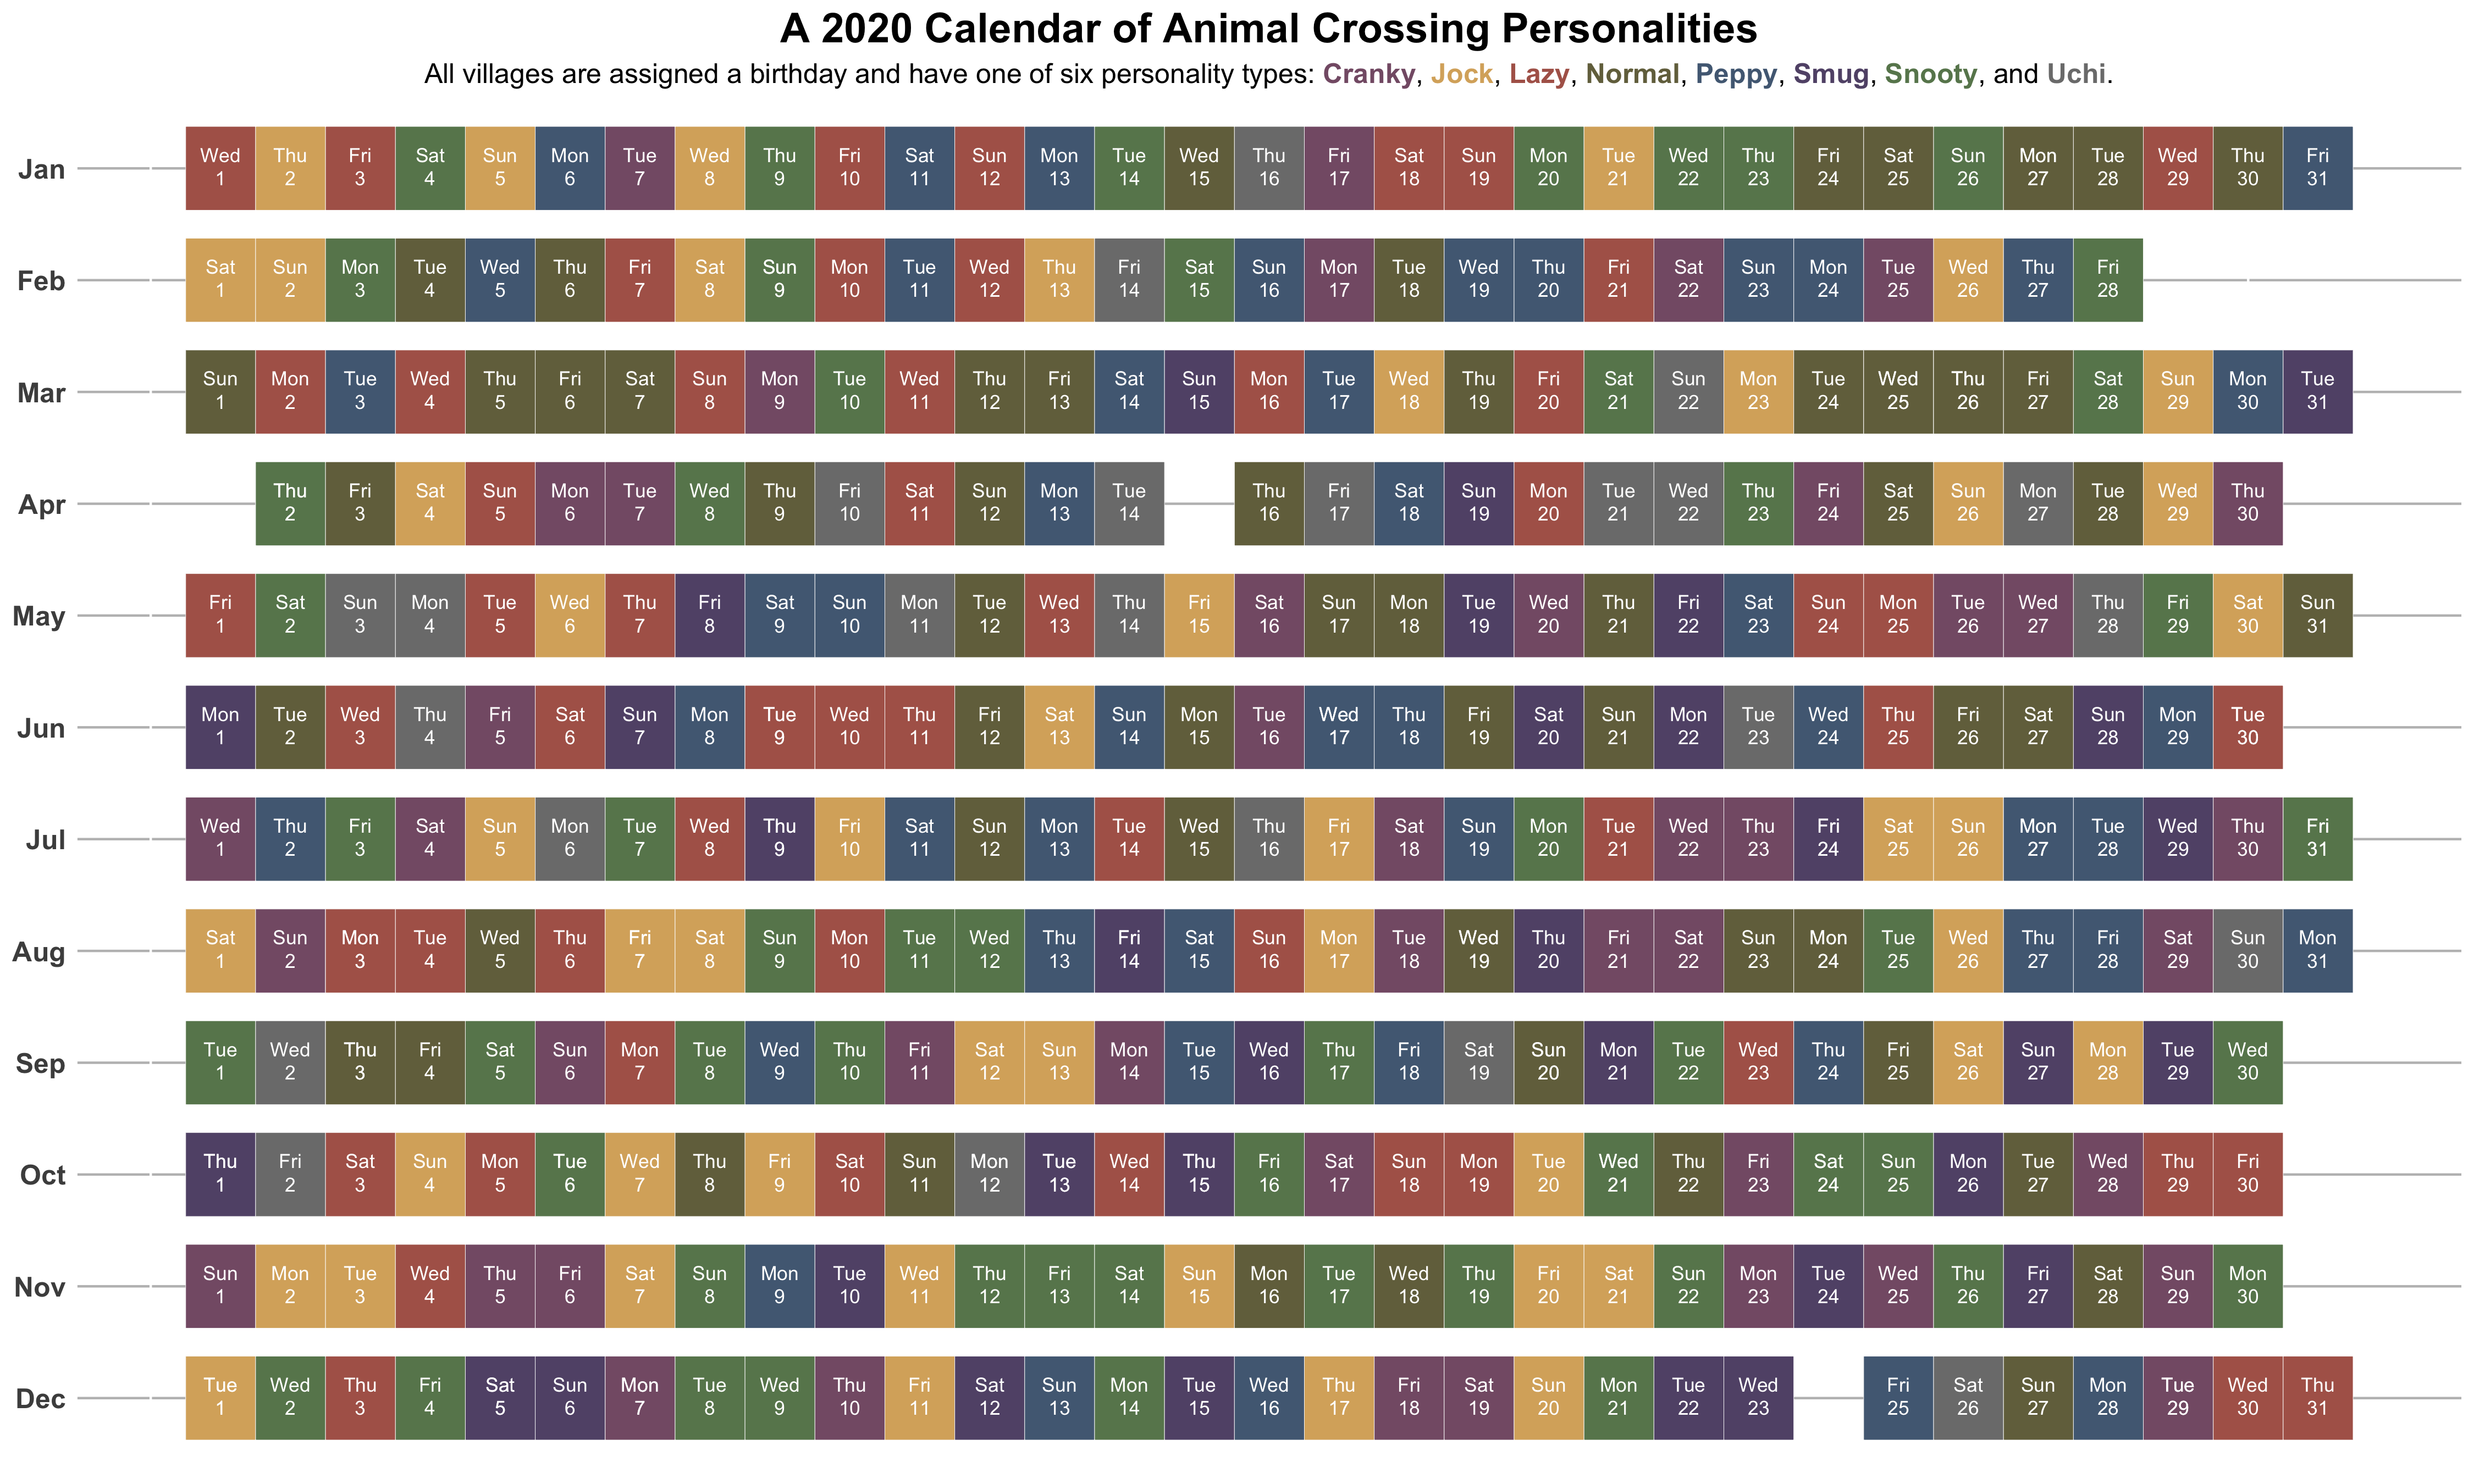
Output: 2020-09
A calendar of Animal Crossing personality types.
Dates: 03/01/2020 - 03/07/2020
Output: 2020-07
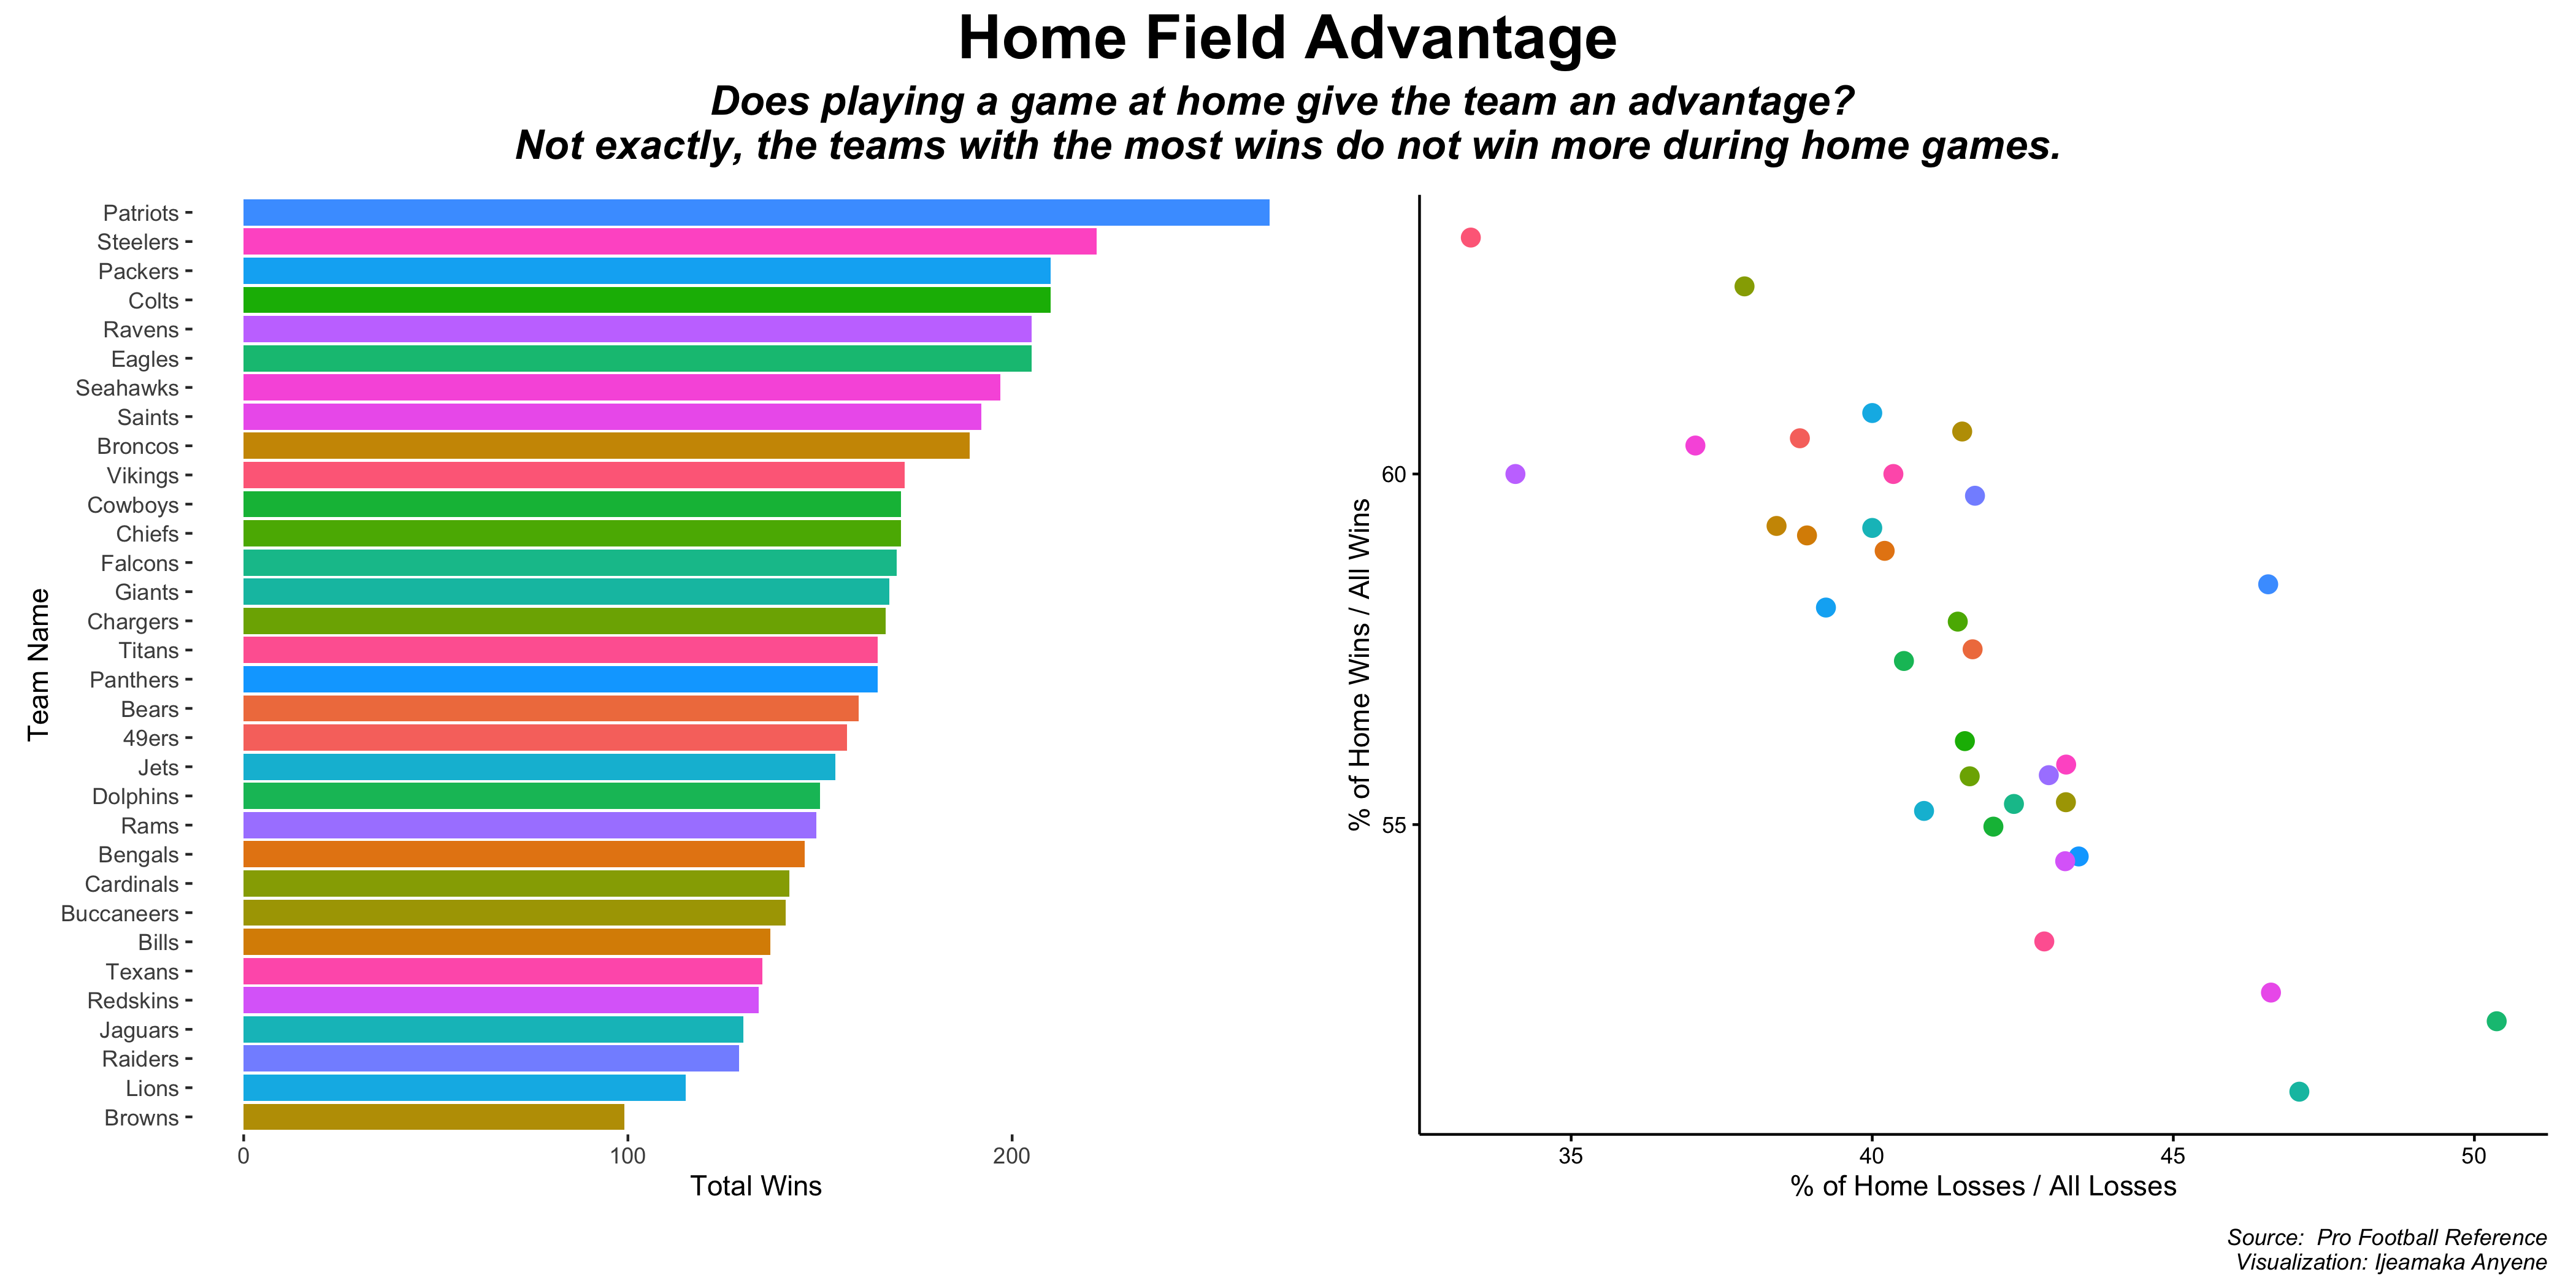
I revised my NFL home field advantage data viz to see if I can improve conveying the message of the lack of home field advantage. I think I did a pretty good job!
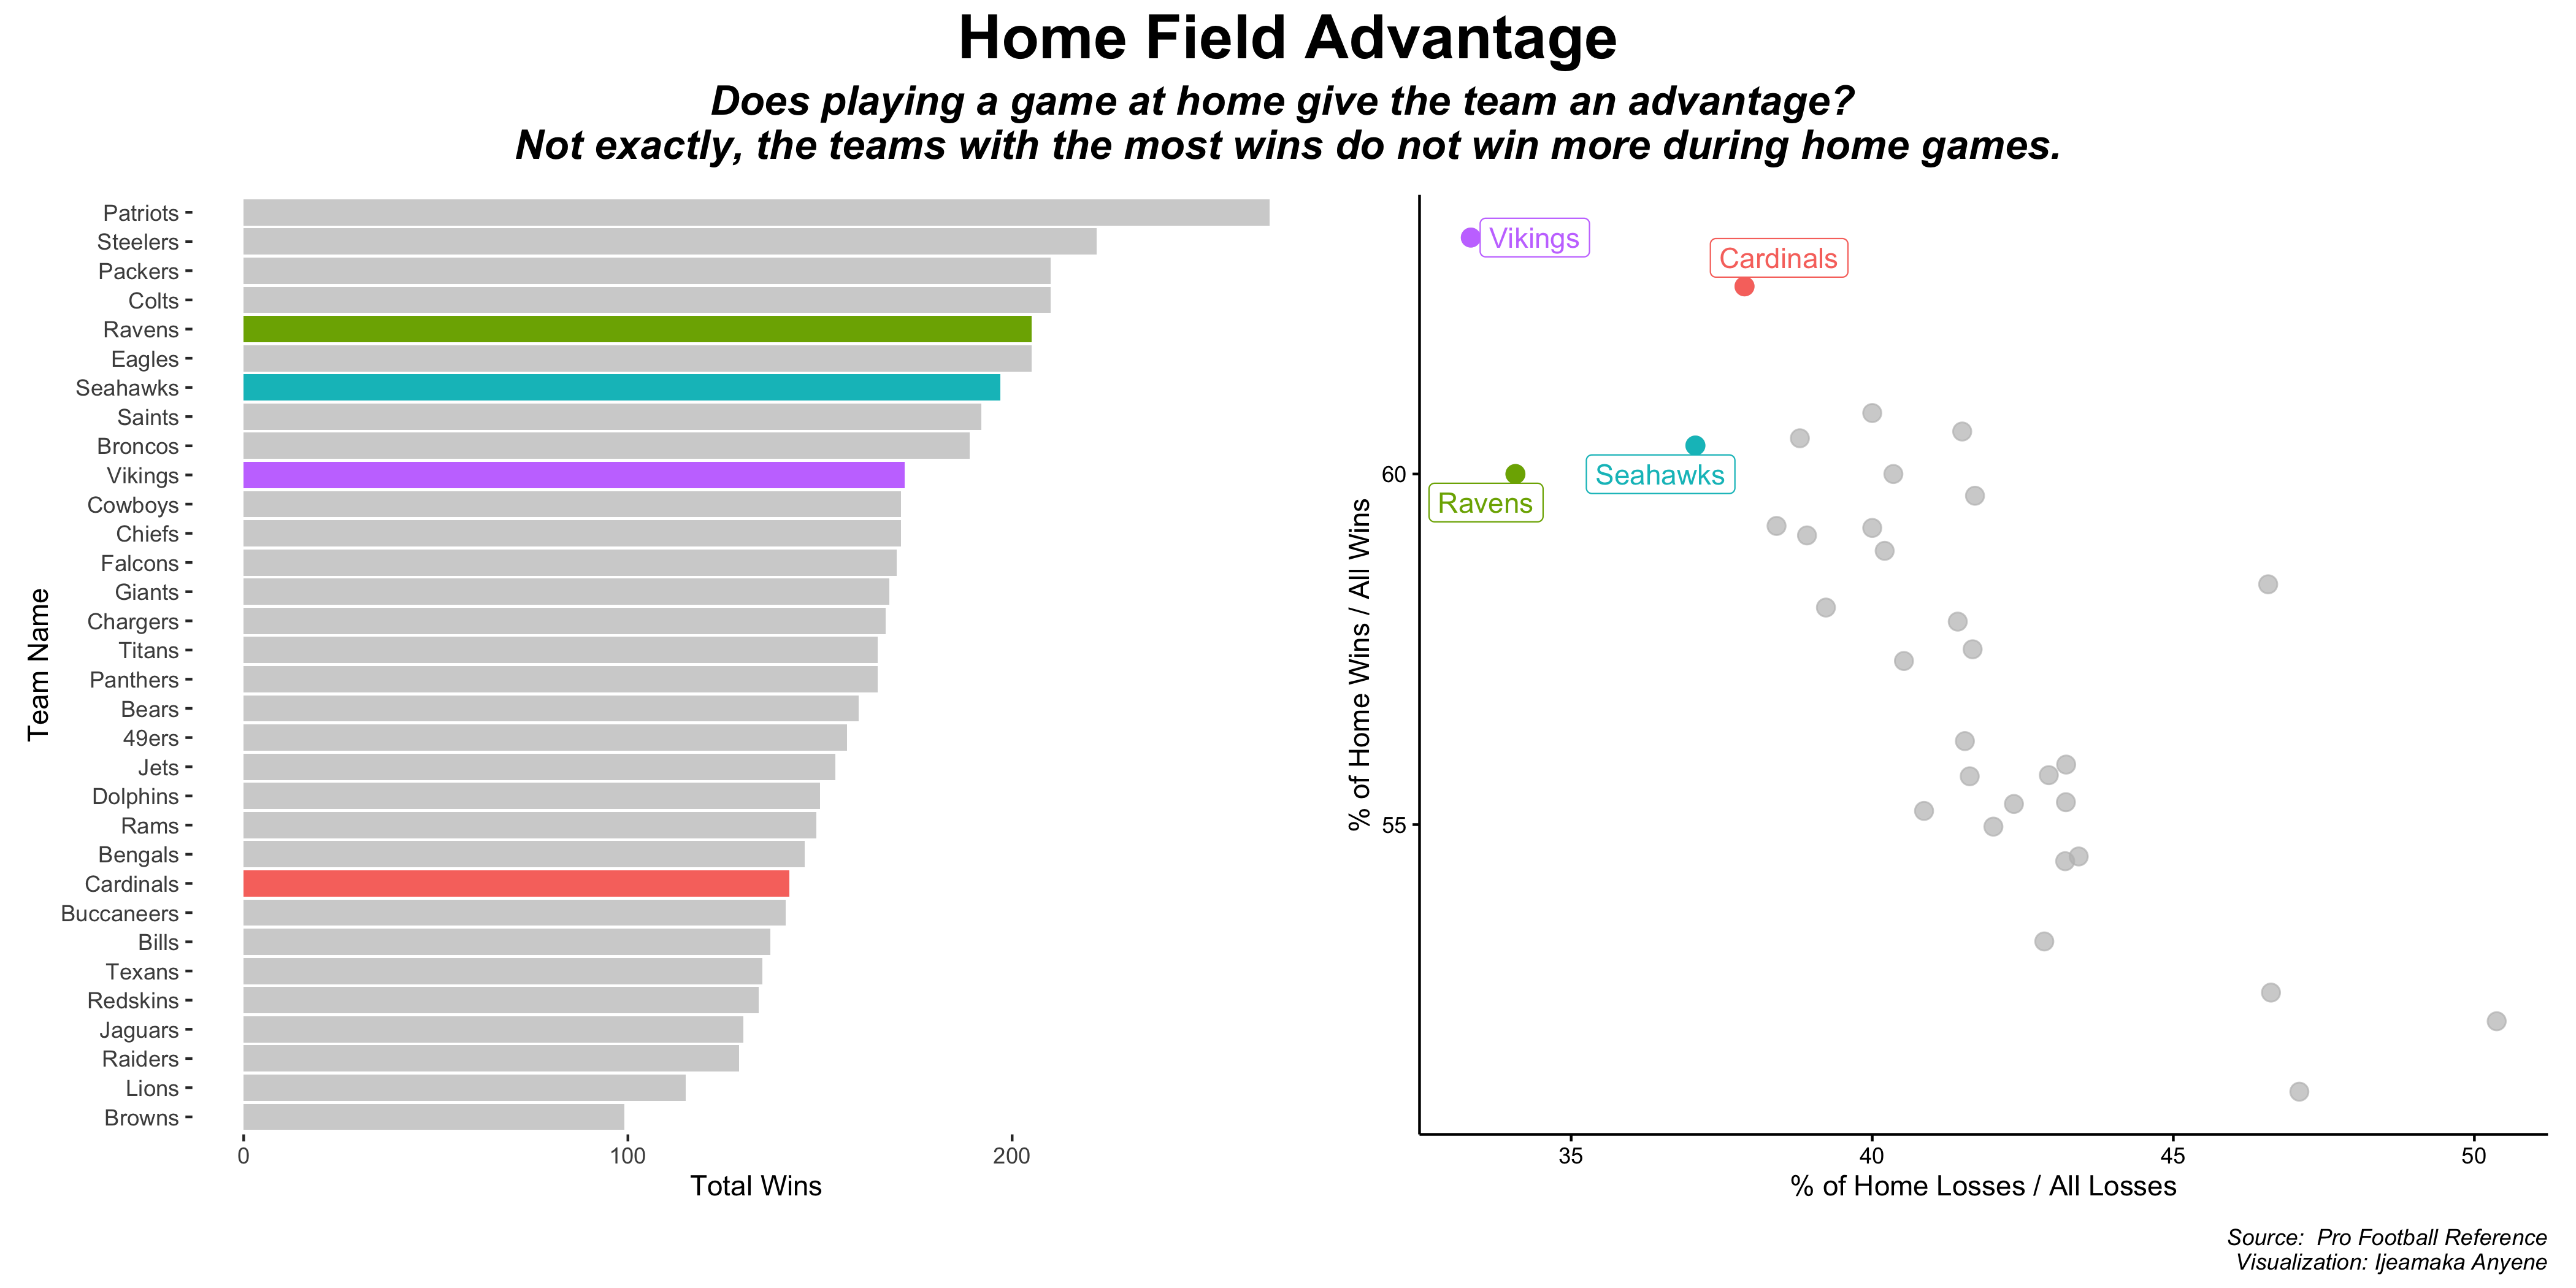
Dates: 02/23/2020 - 02/29/2020
Output: 2020-06
This visualization used data collected for an article by the WallStreet Journal on measles outbreaks.
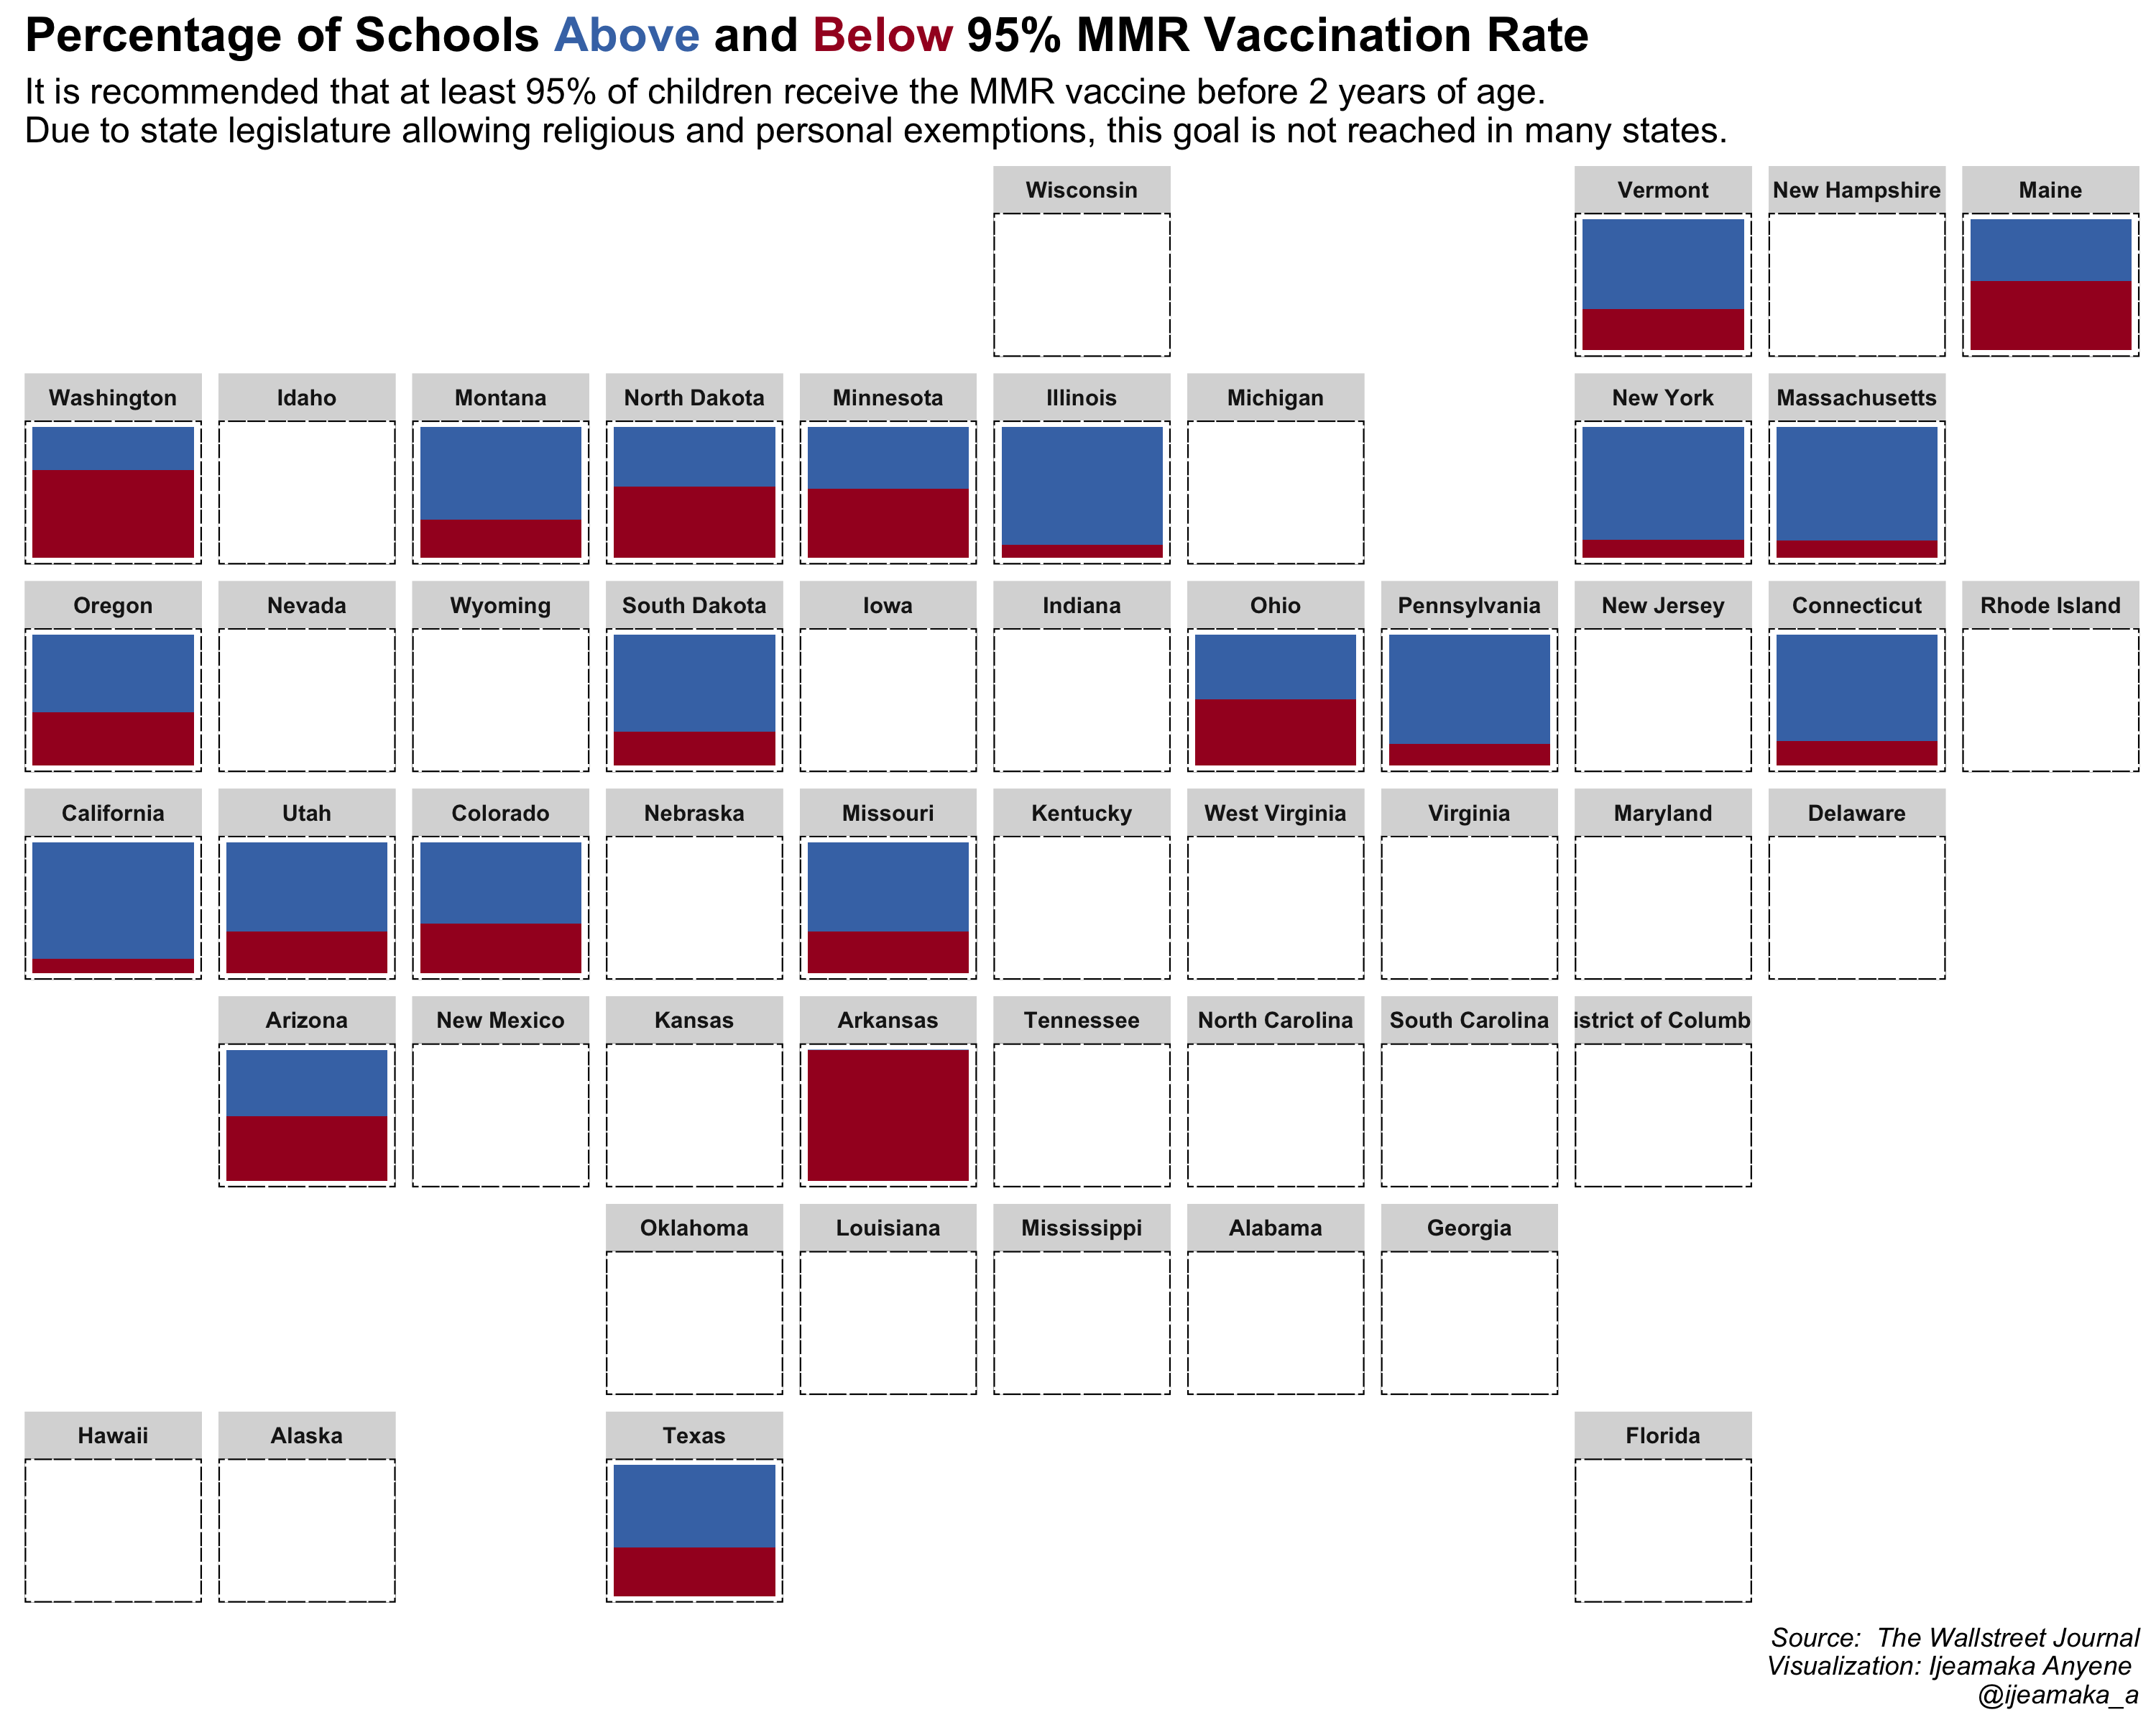
Dates: 02/16/2020 - 02/22/2020
Output: 2020-05
This visualization used webscrapped data on food consumption and associated CO2 emissions globally
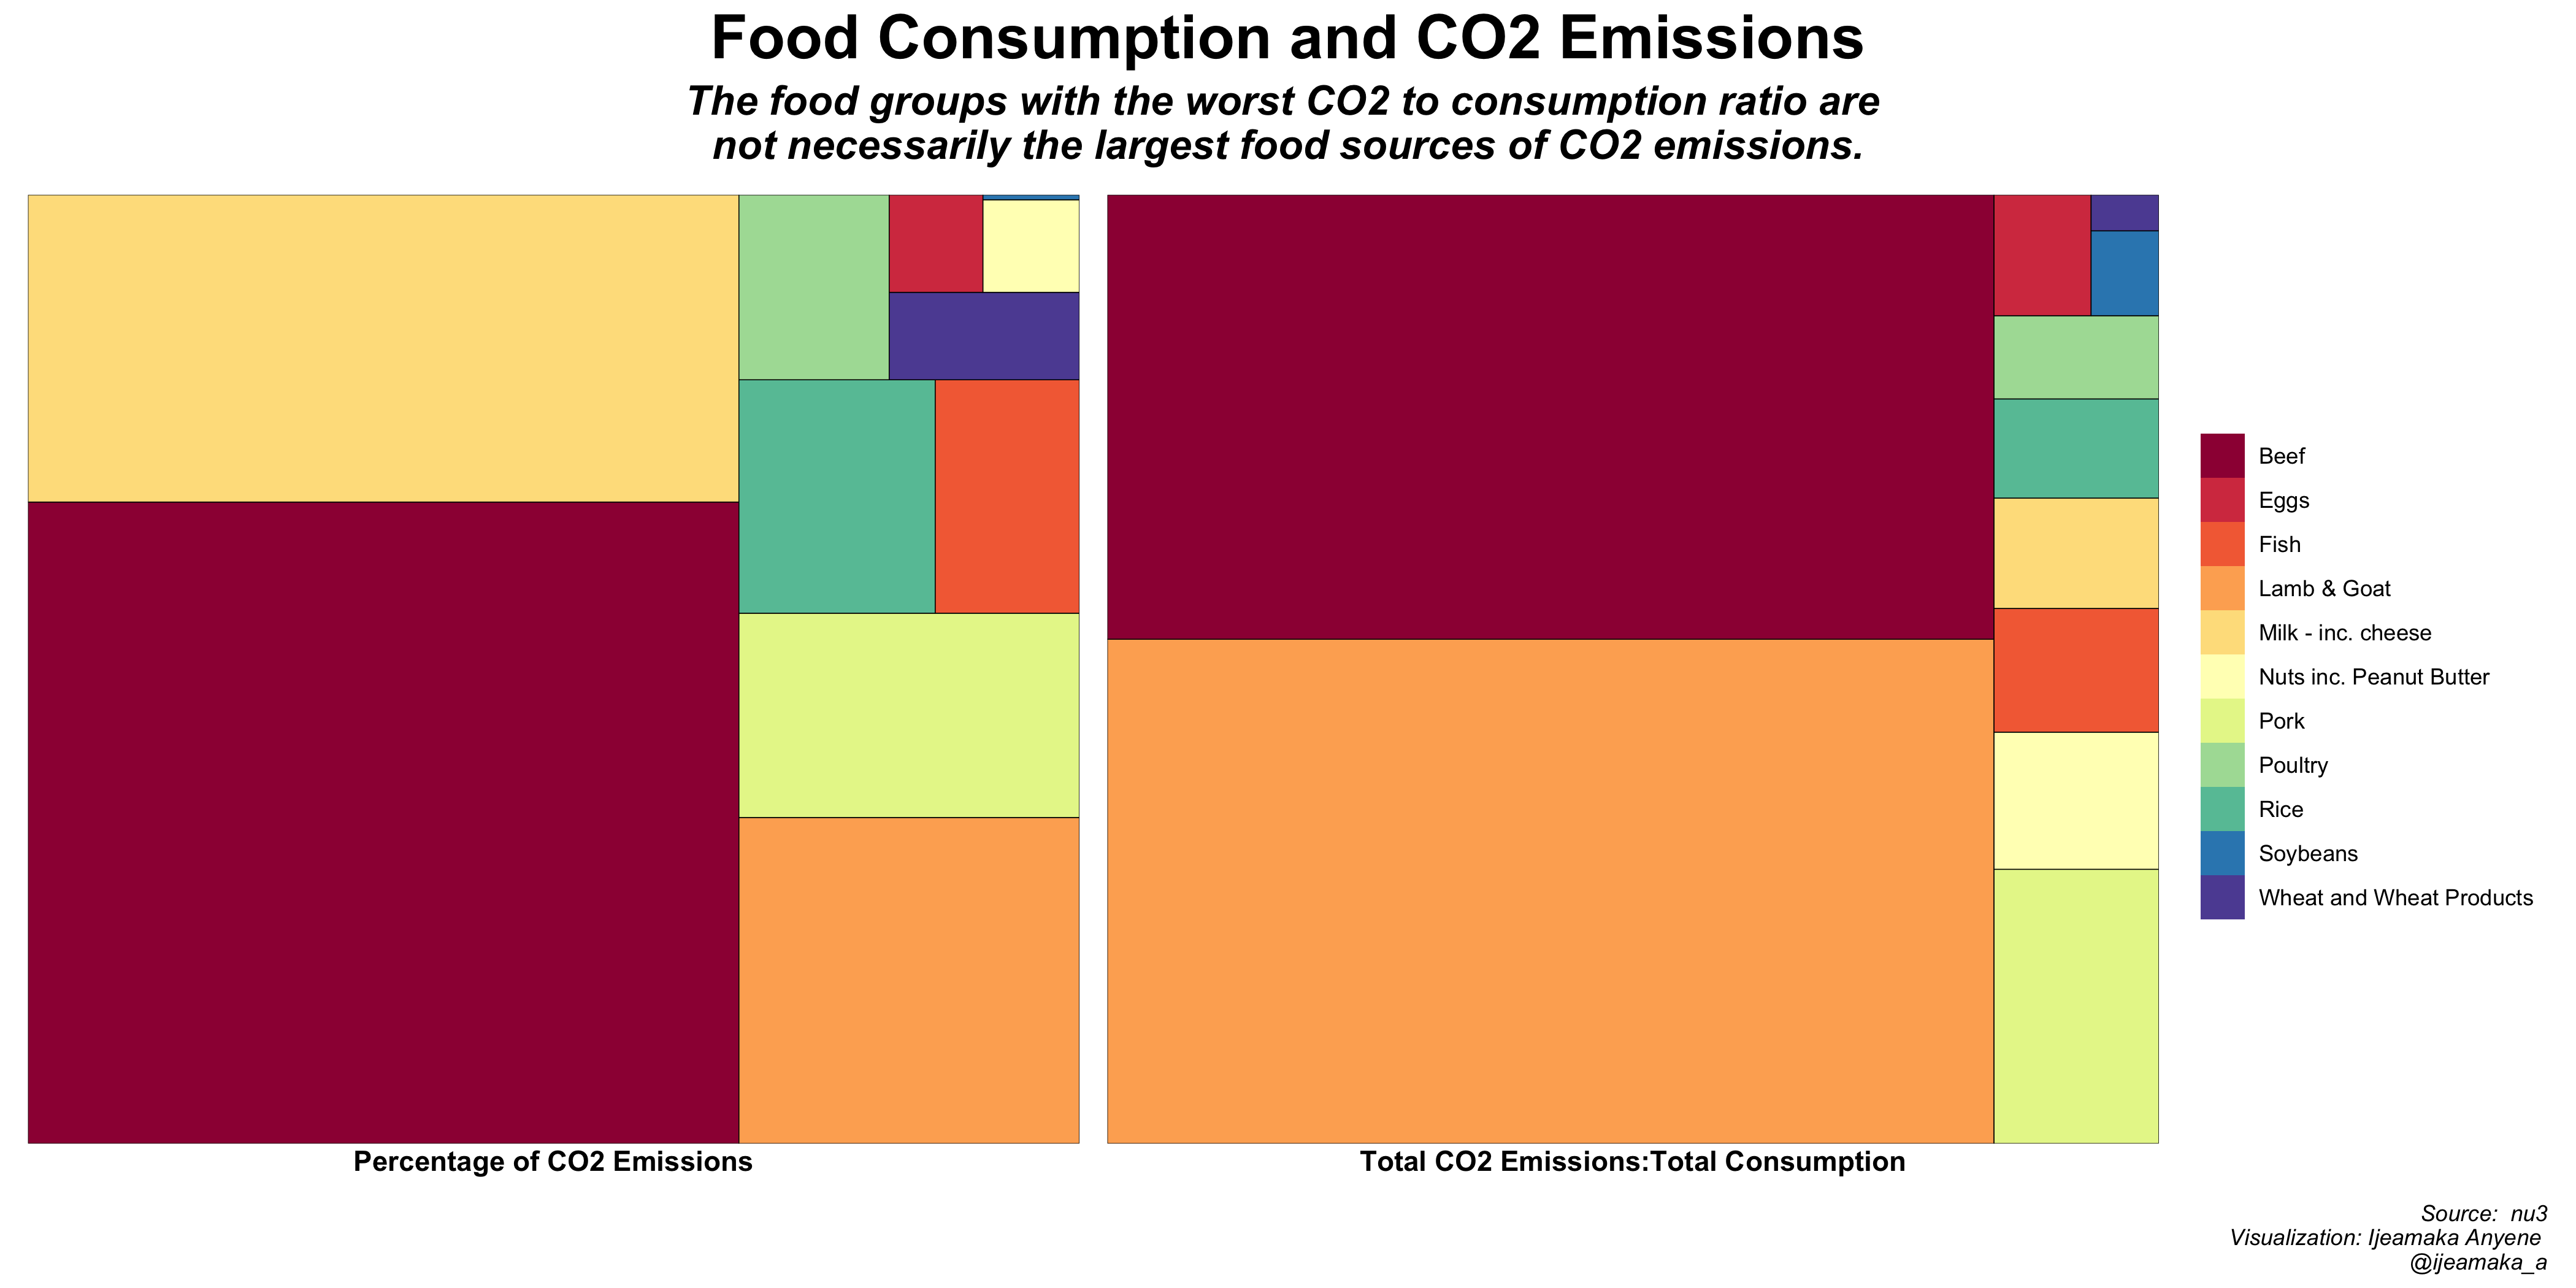
Dates: 02/09/2020 - 02/15/2020
Output: 2020-04
This visualization used the an open hotel booking demand dataset from Antonio, Almeida and Nunes, 2019 to see when are the off-seasons and peak-seasons for hotel reservation.
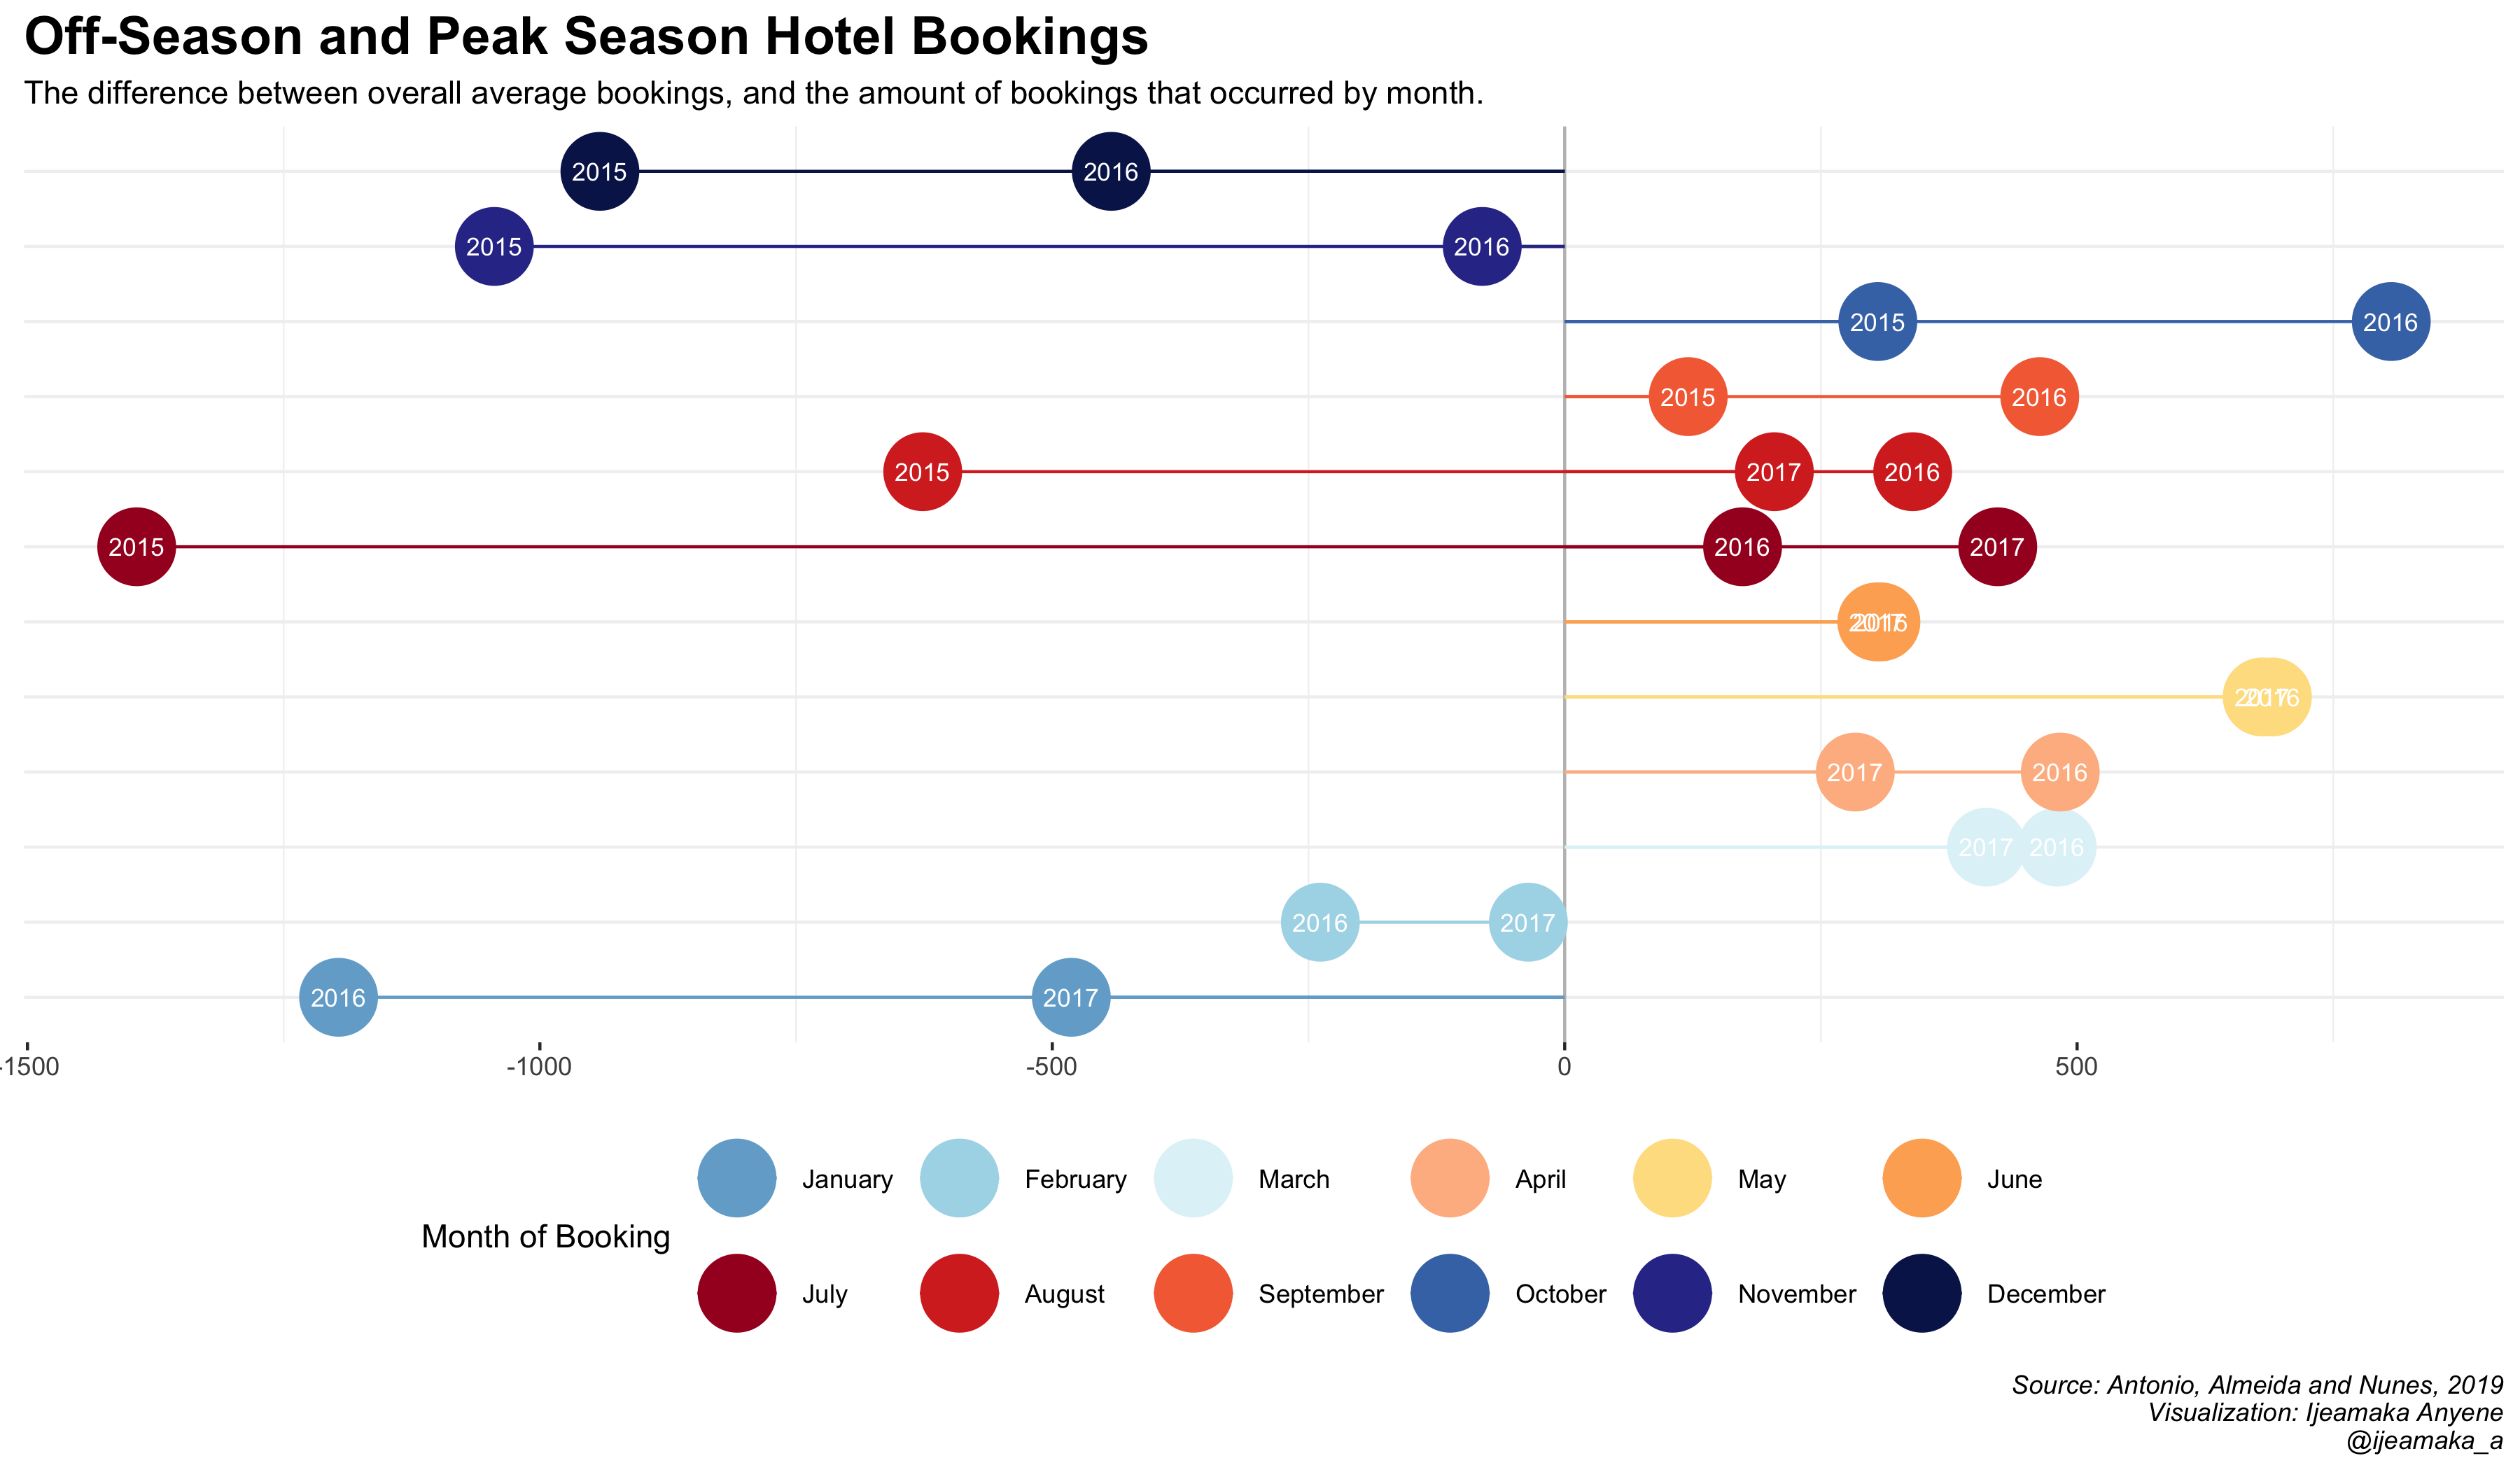
Dates: 02/02/2020 - 02/08/2020
Output: 2020-03
This visualization used the NFL Pro Football Reference data in order to explore home field advantage (Is this a thing in football? Unclear!)
Dates: 01/26/2020 - 02/01/2020
Output: 2020-02
A TidyTuesday project from the R4DS community.
Note: For this visualization I wanted to better understand `theme()`, so I modified all the elements instead of using one of ggplot's pre-created themes.
Dates: 01/26/2020 - 02/01/2020
Output: 2020-01
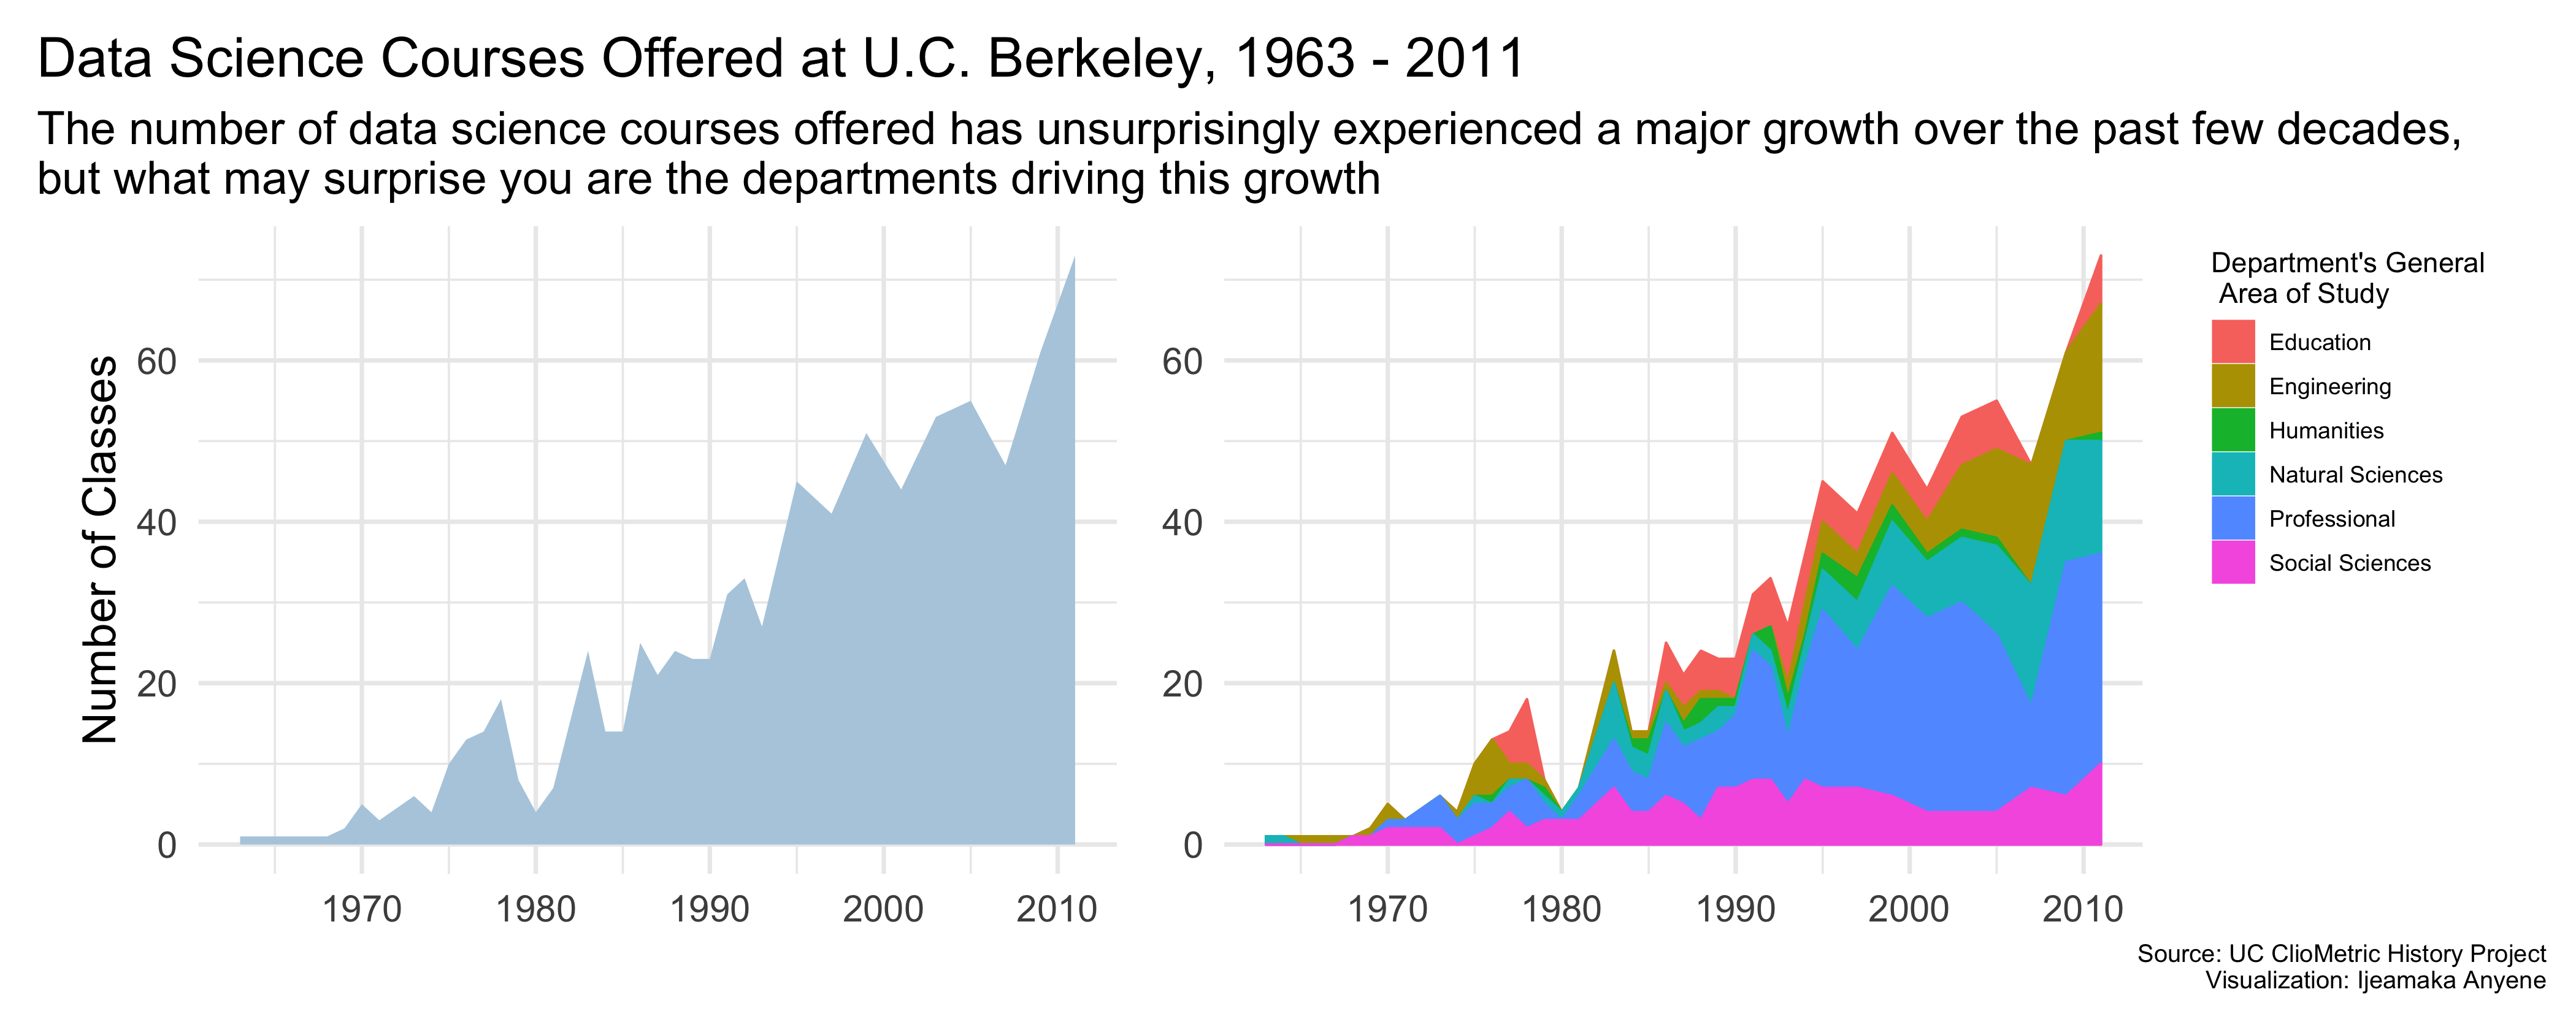
An exploration of the U.C. Cliometric Data focused specifically on U.C. Berkeley. This was not a R4DS TidyTuesday dataset
Note: Learned about `patchwork` for this dataviz and wow I love her.