Ecosyste.ms: Awesome
An open API service indexing awesome lists of open source software.
https://github.com/typpo/quickchart
Chart image and QR code web API
https://github.com/typpo/quickchart
chart-api chart-image image-charts
Last synced: 2 months ago
JSON representation
Chart image and QR code web API
- Host: GitHub
- URL: https://github.com/typpo/quickchart
- Owner: typpo
- License: agpl-3.0
- Created: 2019-03-04T19:00:22.000Z (over 5 years ago)
- Default Branch: master
- Last Pushed: 2024-03-28T14:56:11.000Z (3 months ago)
- Last Synced: 2024-04-08T16:57:32.247Z (2 months ago)
- Topics: chart-api, chart-image, image-charts
- Language: JavaScript
- Homepage: https://quickchart.io/
- Size: 1.89 MB
- Stars: 1,557
- Watchers: 31
- Forks: 200
- Open Issues: 31
-
Metadata Files:
- Readme: README.md
- Funding: .github/FUNDING.yml
- License: LICENSE
Lists
- awesome-charting - QuickChart - Web API that renders static chart images. (Free and Open Source Libraries)
- awesome-repositories - typpo/quickchart - Chart image and QR code web API (JavaScript)
- awesome - quickchart
- awesome-stars - quickchart
- awesome-stars - quickchart - Google Image Charts alternative (HTML)
- awesome-stars - quickchart
- my-awesome-stars - typpo/quickchart - Chart image and QR code web API (JavaScript)
README
QuickChart
---
[](https://travis-ci.com/typpo/quickchart)
[QuickChart](https://quickchart.io/) is a service that generates images of charts from a URL. Because these charts are simple images, they are very easy to embed in non-dynamic environments such as email, SMS, chat rooms, and so on.
## See it in action
The chart image generation service is available online at [QuickChart.io](https://quickchart.io/). There is an interactive editor that allows you to adjust inputs and build images.
Here's an example chart that is defined completely by its URL:
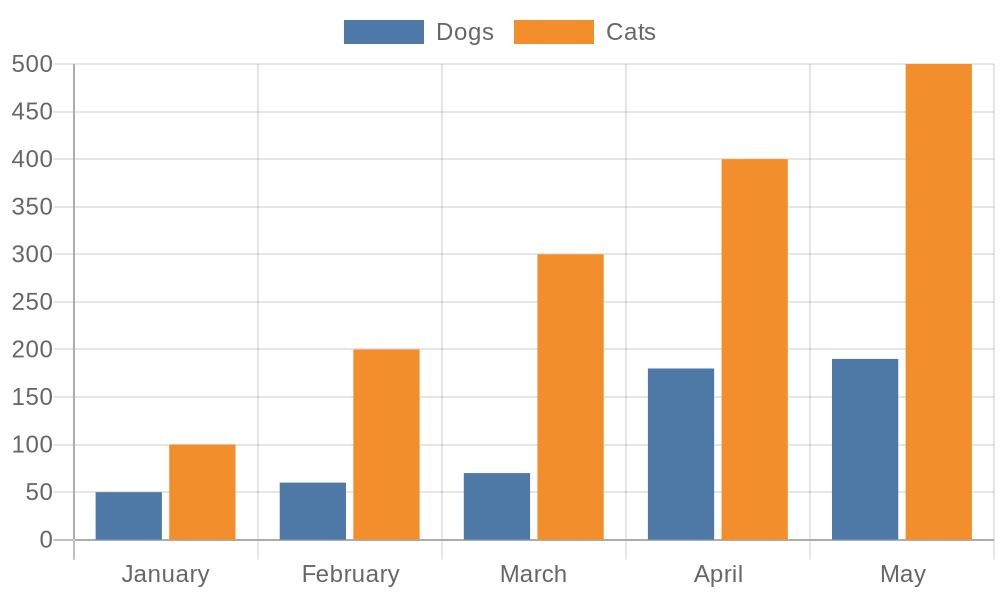
The above image can be included anywhere you like. Here is its URL:
[https://quickchart.io/chart?width=500&height=300&c={type:'bar',data:{labels:['January','February','March','April','May'],datasets:[{label:'Dogs',data:[50,60,70,180,190]},{label:'Cats',data:[100,200,300,400,500]}]}}](https://quickchart.io/chart?width=500&height=300&c={type:'bar',data:{labels:['January','February','March','April','May'],datasets:[{label:'Dogs',data:[50,60,70,180,190]},{label:'Cats',data:[100,200,300,400,500]}]}})
As you can see, the Javascript or JSON object contained in the URL defines the chart:
```js
{
type: 'bar',
data: {
labels: ['January', 'February', 'March', 'April', 'May'],
datasets: [{
label: 'Dogs',
data: [ 50, 60, 70, 180, 190 ]
}, {
label: 'Cats',
data: [ 100, 200, 300, 400, 500 ]
}]
}
}
```
**Go to the full [QuickChart documentation](https://quickchart.io/documentation) to learn more. See [gallery](https://quickchart.io/gallery/) for examples.**
## Configuring your chart
The chart configuration object is based on the popular Chart.js API. Check out the [Chart.js documentation](https://www.chartjs.org/docs/2.9.4/charts/) for more information on how to customize your chart, or see [QuickChart documentation](https://quickchart.io/documentation#parameters) for API options.
QuickChart includes many Chart.js plugins that allow you to add chart annotations, data labels, and more: `chartjs-plugin-datalabels`, `chartjs-plugin-annotation`, `chartjs-plugin-piechart-outlabels`, `chartjs-chart-radial-gauge`, `chartjs-chart-box-and-violin-plot `, `chartjs-plugin-doughnutlabel`, and `chartjs-plugin-colorschemes`.
### Chart.js versions
Chart.js v3 and v4 are supported via the `version` parameter ([documentation](https://quickchart.io/documentation/) to read more about parameters). Custom chart plugins such as annotations and outlabels currently not available for >= 3.0.0.
Each QuickChart instance should use 1 specific version of the Chart.js library. Mixing and matching versions (e.g., rendering a v2 chart followed by a v3 chart) is not well supported.
## QR Codes
The service also produces QR codes. For example, https://quickchart.io/qr?text=Hello+world produces:

The `/qr` endpoint has the following query parameters:
- `text` - QR code data (required)
- `format` - png or svg (png default)
- `size` - size in pixels of one side of the square image (defaults to 150)
- `margin` - size of the QR image margin in modules (defaults to 4)
- `ecLevel` - Error correction level (defaults to M)
- `dark` - Hex color code for dark portion of QR code (defaults to `000000`)
- `light` - Hex color code for light portion of QR code (defauls to `ffffff`)
## Client libraries
- [quickchart-js](https://github.com/typpo/quickchart-js) - Javascript
- [quickchart-python](https://github.com/typpo/quickchart-python) - Python
- [quickchart-ruby](https://github.com/typpo/quickchart-ruby) - Ruby
- [quickchart-php](https://github.com/typpo/quickchart-php) - PHP
- [quickchart-csharp](https://github.com/typpo/quickchart-csharp) - C#
- [quickchart-java](https://github.com/typpo/quickchart-java) - Java
- [chartjs-to-image](https://www.npmjs.com/package/chartjs-to-image) - Javascript package for Chart.js images
## Dependencies and Installation
Chart generation requires several system dependencies: Cairo, Pango, libjpeg, and libgif. Run `./scripts/setup.sh` for a fresh install on Linux machines (note that this also installs yarn, node, and monit).
To install system dependencies on Mac OSX, you probably just need to `brew install cairo pango libffi`. You may have to `export PKG_CONFIG_PATH="/usr/local/opt/libffi/lib/pkgconfig"` before installing node packages.
Once you have system dependencies installed, run `yarn install` or `npm install` to install the node dependencies.
## Running the server
`node index.js` will start the server on port 3400. Set your `PORT` environmental variable to change this port.
## Docker
A docker image is available on dockerhub at [ianw/quickchart](https://hub.docker.com/r/ianw/quickchart).
#### Building
`Dockerfile` sets up a server that provides chart and qr code web endpoints. It is not parameterized and provides exactly the same web service as https://quickchart.io/.
The Docker image for this project is built with the following command:
```
docker build -t ianw/quickchart .
```
#### Running
The server runs on port 3400 within the container. This command will expose the server on port 8080 on your host (hostport:containerport):
```
docker run -p 8080:3400 ianw/quickchart
```
The production service on QuickChart.io runs behind an NGINX reverse proxy via the config available in `nginx/`. You should modify this for your own purposes or use a docker image such as [nginx-proxy](https://github.com/jwilder/nginx-proxy). Of course, you can always serve traffic directly from Node, but it is generally best practice to put something in front of it.
#### Securing your self-hosted instance
If you are hosting QuickChart youself, take care not to expose the service to untrusted parties. Because Chart.js configs may contain arbitrary Javascript, it is necessary to properly sandbox your QuickChart instance.
## Deploy
By following the **Docker** instructions above, you can deploy the service to any platform that supports running containers.
Clicking the following will execute the Docker build on a remote machine and deploy the service to [Google Cloud Run](https://cloud.run) an automatically scaled and pay-per-request environment:
[](https://console.cloud.google.com/cloudshell/editor?shellonly=true&cloudshell_image=gcr.io/cloudrun/button&cloudshell_git_repo=https://github.com/typpo/quickchart)
## Securing your self-hosted instance
This server assumes all Javascript sent in the config object is friendly. If you are hosting QuickChart youself, take care not to expose the service to untrusted parties. Because Chart.js configs may contain arbitrary Javascript, it is necessary to properly sandbox your QuickChart instance if you are exposing it to the outside world.
## Health and Monitoring
QuickChart has two API endpoints to determine the health of the service.
`/healthcheck` is a basic endpoint that returns a 200 status code and a JSON object that looks like this: `{"success":true,"version":"1.1.0"}`.
A second endpoint, `/healthcheck/chart` returns a 302 status code and redirects to a chart with random attributes. Although it is a more expensive endpoint, it can be useful for cache busting or testing chart rendering.
The hosted QuickChart service uses [monit](https://mmonit.com/monit/) to make sure the service is online and restart it if not. An example monit config is in `test/monit`.
## Limitations
If you are self-hosting QuickChart, each QuickChart instance should use a single version of the Chart.js library. Mixing and matching versions (e.g., rendering a v2 chart followed by a v3 chart) is not well supported.
This self-hosted QuickChart implementation currently supports the `/chart`, `/qr`, and `/graphviz` endpoints. Other endpoints such as `/wordcloud`, `watermark`, `/chart/create` are not available in this version due to non-OSS 3rd-party dependencies.
## License
QuickChart is open source, licensed under version 3 of the GNU AGPL. If you would like to modify this project for commercial purposes (and not release the source code), please [contact me](https://www.ianww.com/).