Ecosyste.ms: Awesome
An open API service indexing awesome lists of open source software.
https://github.com/pfirsich/jprof
Profiling library/tool for löve
https://github.com/pfirsich/jprof
Last synced: 3 months ago
JSON representation
Profiling library/tool for löve
- Host: GitHub
- URL: https://github.com/pfirsich/jprof
- Owner: pfirsich
- License: mit
- Created: 2017-11-08T17:24:58.000Z (over 6 years ago)
- Default Branch: master
- Last Pushed: 2023-05-05T21:53:30.000Z (about 1 year ago)
- Last Synced: 2024-01-24T08:54:00.661Z (5 months ago)
- Language: Lua
- Size: 53.7 KB
- Stars: 82
- Watchers: 4
- Forks: 5
- Open Issues: 10
-
Metadata Files:
- Readme: README.md
- License: LICENSE
Lists
- awesome-love2d - jprof - Profiling library/tool for LÖVE. (Performance)
README
# jprof
Usually Lua programs are profiled by setting hooks using the built-in function `debug.sethook`, but sadly these hooks are not reliably called in luajit, which makes most profiling libraries for Lua not usable in the current version of [löve](https://love2d.org/).
jprof is a semi-makeshift solution for profiling löve applications with some extra work, but while also providing no significant slowdown while profiling.
# Overview
jprof requires you to annotate your code with "profiling zones", which form a hierarchical representation of the overall flow of your program and record time taken and memory consumption for each of these zones:
```lua
function foo()
prof.push("do the thing")
thething()
prof.pop()
end
function bar()
prof.push("foo it up in here")
foo()
prof.pop("foo it up in here")
prof.push("something else")
local baz = sum(thing, else)
prof.pop("something else")
end
```
These are then saved to a file in your application's save directory using [fperrad/lua-MessagePack](https://github.com/fperrad/lua-MessagePack), which you can analyze in the viewer:
# Documentation
Before you annotate your code, you need to copy (not move) `jprof.lua` and `MessagePack.lua` into your game's directory.
The most common case does probably look somewhat like this:
```lua
PROF_CAPTURE = true
prof = require("jprof")
function love.update(dt)
prof.push("frame")
-- push and pop additional zones here
-- also update your game if you want
end
function love.draw()
-- push and pop additional zones here
prof.pop("frame")
end
function love.quit()
prof.write("prof.mpack")
end
```
If `PROF_CAPTURE` evaluates to `false` when jprof is imported, all profiling functions are replaced with `function() end` i.e. do nothing, so you can leave them in even for release builds.
Also all other zones have to be pushed inside the `"frame"` zone and whenever `prof.push` or `prof.pop` are called outside of a frame, the viewer will not know how to interpret that data (and error). So make sure capturing is disabled when functions are called that push zones outside of the `"frame"` zone.
For example if you are using a fixed timestep loop (update and draw frames are not always 1 for 1), you probably want to do something like this instead (excerpt/sketch):
```lua
PROFILE_DRAW = false
function love.update(dt)
prof.enabled(not PROFILE_DRAW)
prof.push("frame")
-- updating
prof.pop("frame")
prof.enabled(false)
end
function love.draw()
prof.enabled(PROFILE_DRAW)
prof.push("frame")
-- drawing
prof.pop("frame")
prof.enabled(false)
end
```
### `prof.push(name, annotation)`
The `annotation` is optional and appears as metadata in the viewer.
### `prof.pop(name)`
The `name` is optional and is only used to check if the current zone is actually the one specified as the argument. If not, somewhere before that pop-call another zone has been pushed, but not popped.
### `prof.popAll()`
Pops all zones from the stack. You should almost never use this function, except if you want to terminate the program while having a number of zones on the zone stack (i.e. just before calling `prof.write()`) and cleaning up properly would be too bothersome.
### `prof.write(filename)`
Writes the capture file to `filename`.
### `prof.enabled(enabled)`
Enables capturing profiling zones (`enabled = true`) or disables it (`enabled = false`). By default, profiling is enabled.
### `prof.connect(saveFullProfData, port, address)`
Attempts to connect to the jprof viewer to transmit realtime profiling data. If `saveFullProfData` is `true`, jprof will still save all the profiling data, so you can save it to file later using `prof.write()`. If it is `false` (default), the data is only transmitted to the viewer and `prof.write()` will show a notice that no profiling data was saved.
The default `port` is `1338` and the default `address` is `localhost`.
### `prof.netFlush()`
jprof does not send out every event by itself, but rather buffers them and sends them out, when this command is called. By default this is called when `prof.pop()` is called and the popped zone is `"frame"` (though only if you did `prof.connect()` earlier).
## Viewer
Just start the löve project contained in this repository like this:
```console
love jprof
```
With `` being the [identity](https://love2d.org/wiki/love.filesystem.setIdentity) (most commonly set in [conf.lua](https://love2d.org/wiki/Config_Files)) of your project and `` being the filename of the capture file (the one that was passed to `prof.write(filename)`).
### Realtime Profiling
jprof also supports realtime transmission of profiling data. To use this feature, just start the viewer in listen mode:
```console
love jprof listen
```
You may also pass an additional, optional argument to specify a port. The default port used is 1338. In the program you are profiling, call `prof.connect()` (see above) right after importing jprof.
**Note:** When realtime profiling is used, it is not as straightforward to keep track of the memory jprof is using itself, since jprof will produce garbage too. Therefore the memory values returned by jprof will be less accurate and depending on your use case the garbage generated by jprof will dominate. Make sure to capture to file first and see if the live capture looks significantly different.
### Notes
Hold `F1` or `H` to show the help overlay.
When you select a frame range, it will be averaged. Most of the time this is what you want to look at rather than individual frames.
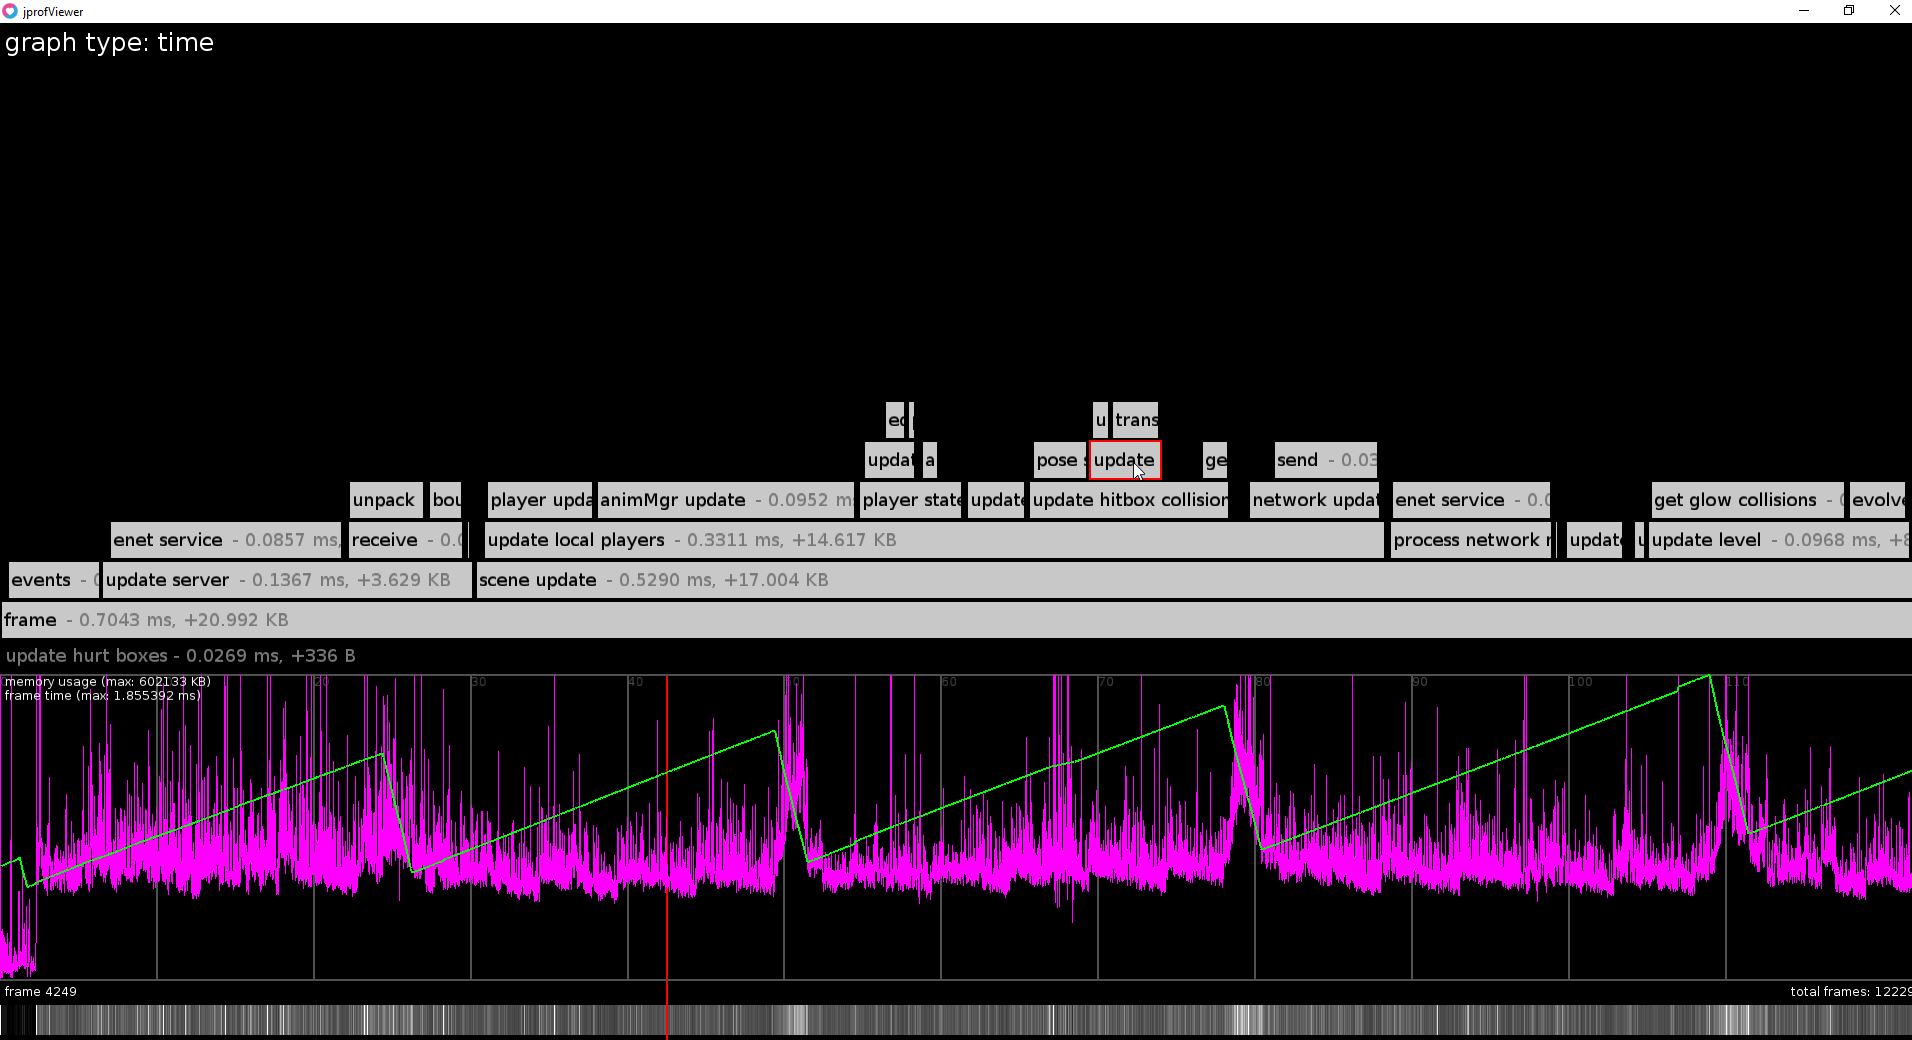
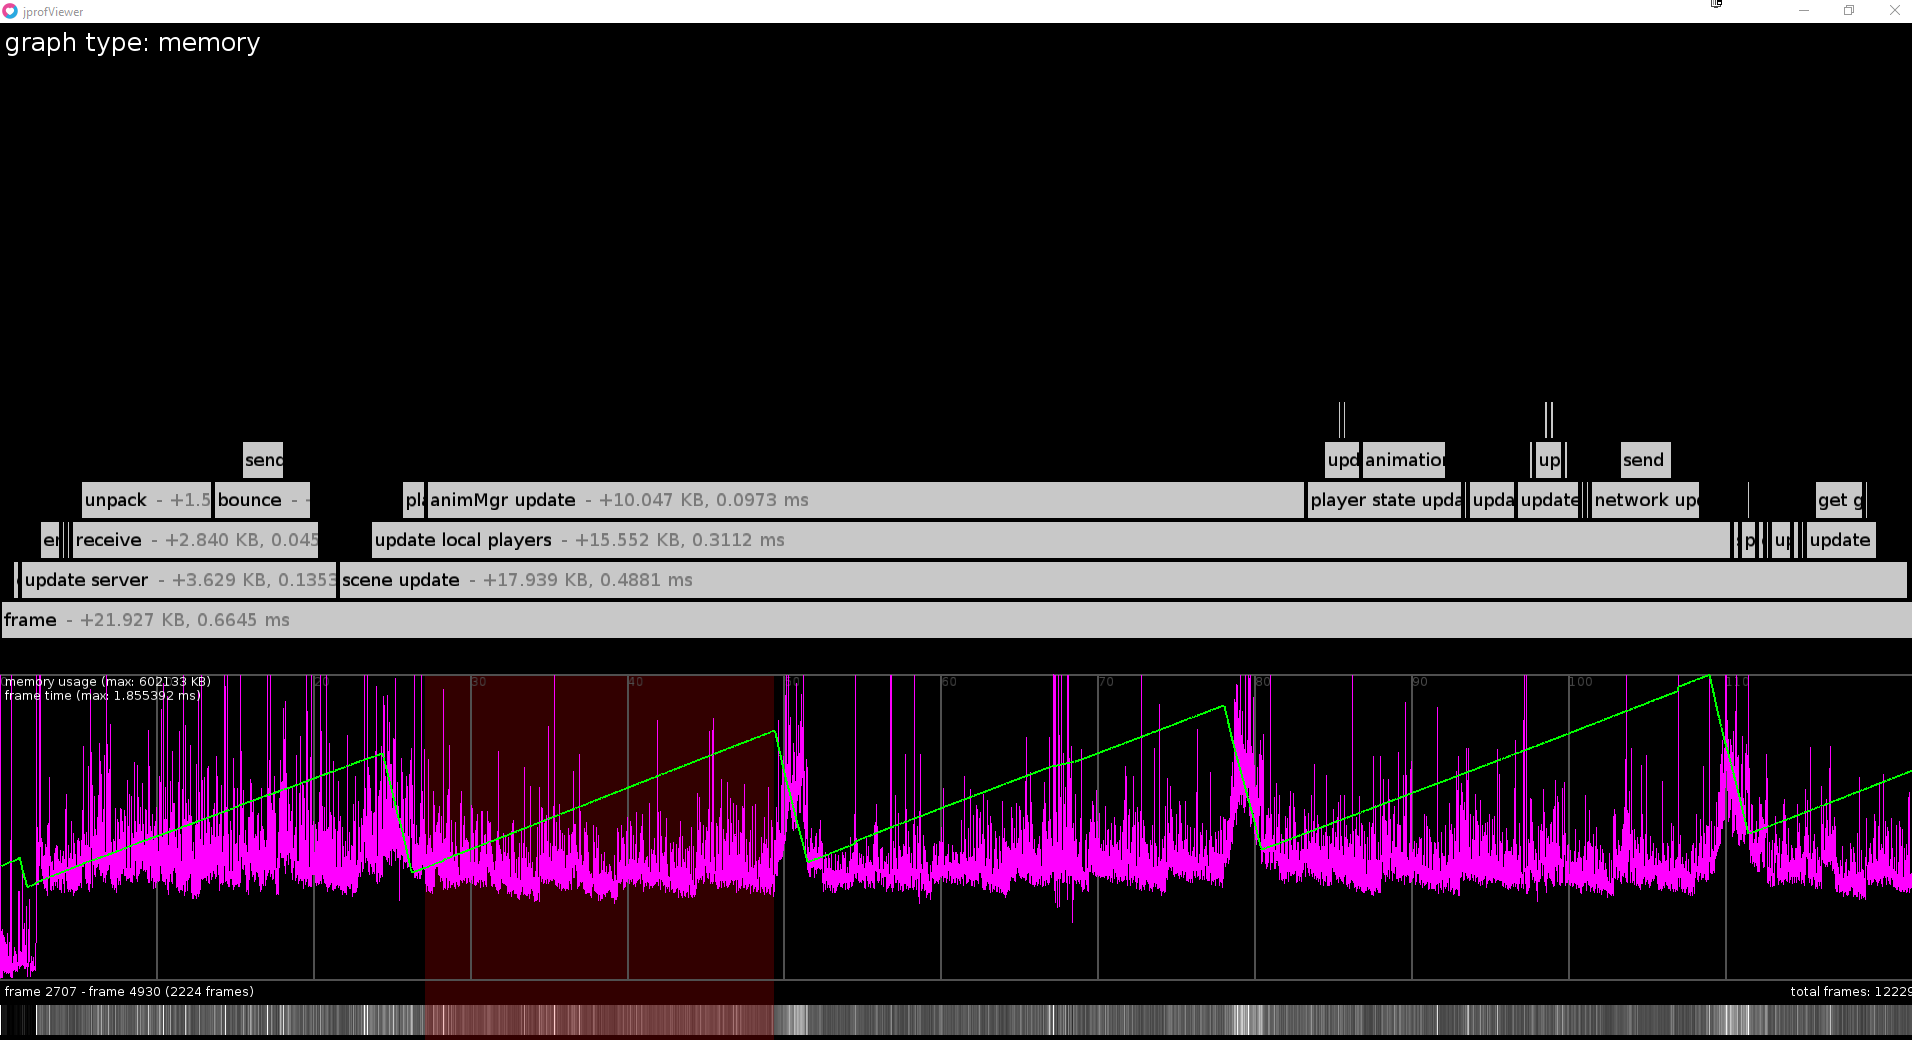
If a single frame is selected the position of the zones in the flame graph will correspond to their relative position in time inside the frame, for averaged frames both in memory and time mode the zones will just be centered above their parent. Their size will still hold meaning though and empty space surrounding these zones implies that there was memory consumed/freed or time spent without being enclosed by a profiling zone.
The different modes (`memory` and `time`) determine whether the scale and position of the zones inside the flame graph will be derived from either memory consumption changes or time duration respectively.
The purple graph displays the total duration of the frames over time and the green graph the total memory consumption over time.
### Graph Averaging Modes
* `max` mean is most useful for finding spikes. This is the default.
* `arithmetic` mean is what most people think of, when they think of an average. This is less sensitive to spikes, but still somewhat.
* `harmonic` mean is least sensitive to outliers and should be a bit smoother than the arithmetic mean.