Ecosyste.ms: Awesome
An open API service indexing awesome lists of open source software.
https://github.com/riptl/netdata-influx
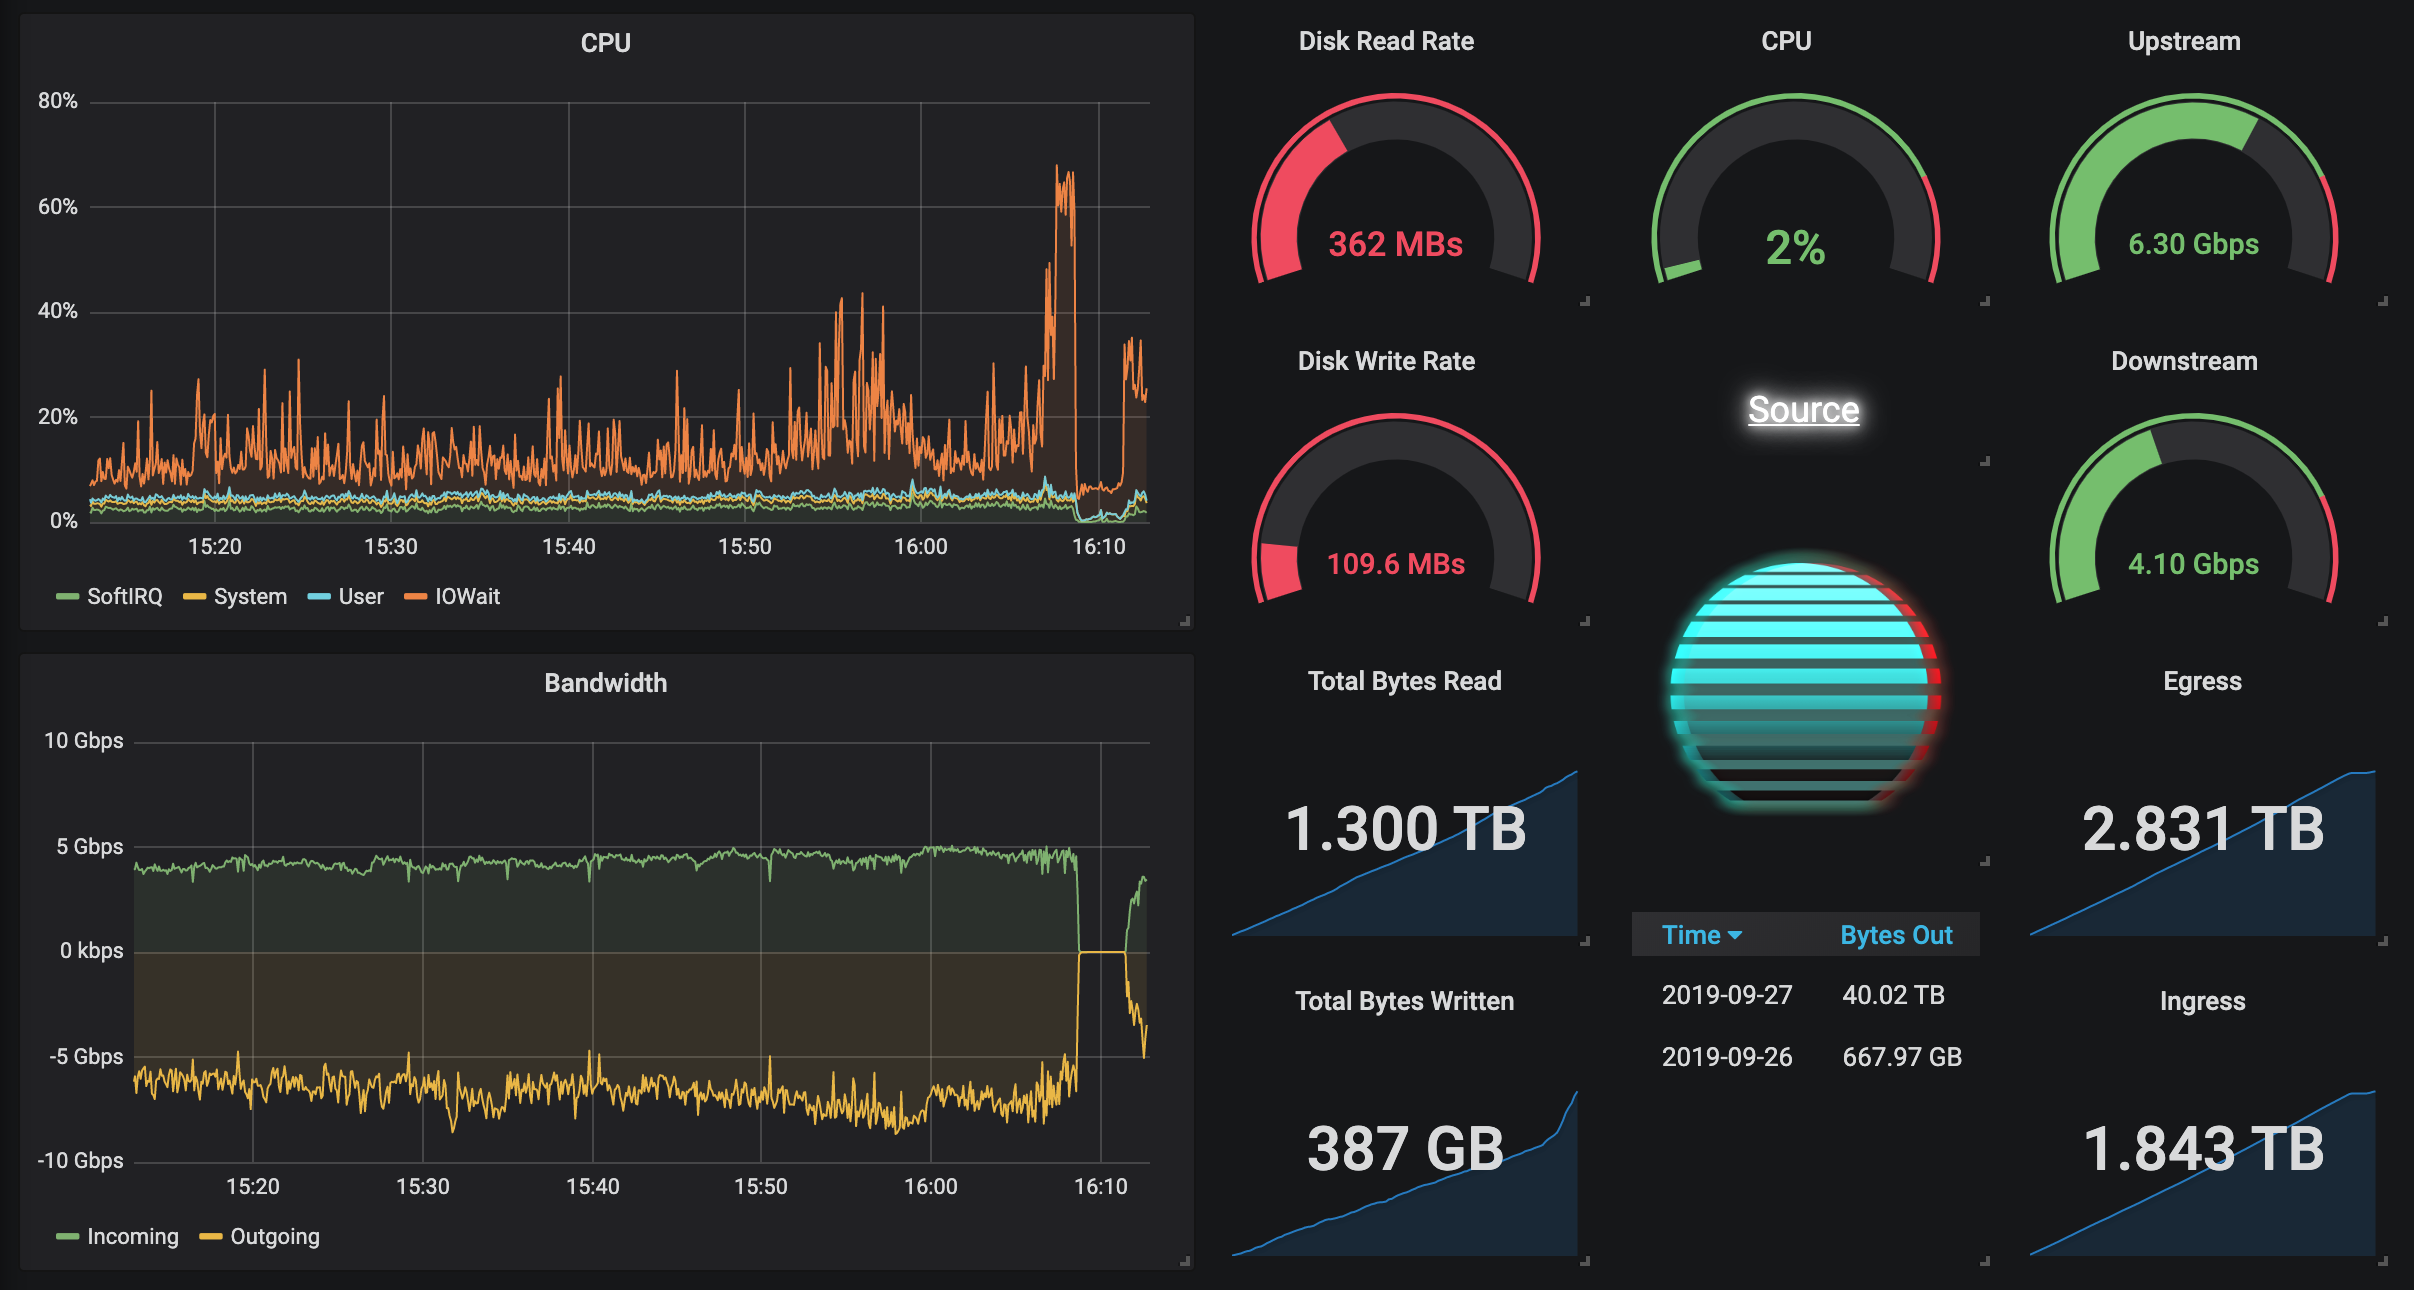
Netdata ➡️ InfluxDB metrics exporter & Grafana dashboard
https://github.com/riptl/netdata-influx
docker docker-compose grafana grafana-dashboard grafana-influxdb influxdb influxdb-grafana-docker monitoring netdata
Last synced: 2 months ago
JSON representation
Netdata ➡️ InfluxDB metrics exporter & Grafana dashboard
- Host: GitHub
- URL: https://github.com/riptl/netdata-influx
- Owner: riptl
- License: mit
- Archived: true
- Created: 2019-09-26T23:38:15.000Z (almost 5 years ago)
- Default Branch: main
- Last Pushed: 2023-07-30T16:28:48.000Z (12 months ago)
- Last Synced: 2024-03-30T19:46:30.362Z (3 months ago)
- Topics: docker, docker-compose, grafana, grafana-dashboard, grafana-influxdb, influxdb, influxdb-grafana-docker, monitoring, netdata
- Language: Go
- Homepage:
- Size: 443 KB
- Stars: 31
- Watchers: 4
- Forks: 4
- Open Issues: 2
-
Metadata Files:
- Readme: README.md
- License: LICENSE
Lists
- awesome-stars - riptl/netdata-influx - Netdata ➡️ InfluxDB metrics exporter & Grafana dashboard (Go)
README
# Netdata to InfluxDB exporter
* GitHub: https://github.com/terorie/netdata-influx
* Grafana: https://grafana.com/grafana/dashboards/10922
* Zero-config, no need to modify netdata settings
* Uses the Netdata V1 API to pull data (`dashboard_url + '/api'`)
* Periodically writes data to InfluxDB
### Showcase
#### [Demo Page](https://the-eye.terorie.dev/d/SwC1MrpWz/netdata-monitoring)
### Quickstart
Install InfluxDB, Netdata and Grafana using [Docker Compose](https://docs.docker.com/compose/install/) in under a minute!
**GitHub Container Registry**
A pre-built lightweight Docker image is available here:
[`ghcr.io/terorie/netdata-influx`](https://github.com/terorie/netdata-influx/pkgs/container/netdata-influx)
**Console:**
```sh
# Create workspace
mkdir netdata; cd netdata
# Get docker-compose config
wget https://raw.githubusercontent.com/terorie/netdata-influx/master/quickstart/docker-compose.yml
# Start services
docker-compose up -d
# Create netdata database
curl -i -XPOST http://localhost:8086/query --data-urlencode "q=CREATE DATABASE netdata"
```
**Grafana:**
- Visit `http://:3000`
- Login with `admin:admin`
- Add InfluxDB datasource
- URL: `http://influxdb:8086`, or with auth `http://user:pass@influxdb:8086`
- Details > Database: `netdata`
- Import dashboard with ID `10922` [(help)](https://grafana.com/docs/reference/export_import/)
### Exporter Configuration
To change settings or add more charts, use these config variables
| var | meaning | default |
| --- | ------- | ------- |
| `$NI_LOG_TIMESTAMPS` | Include timestamps in log | `"true"` |
| `$NI_INFLUX_ADDR` | Influx URL | — |
| `$NI_INFLUX_DB` | Influx database | — |
| `$NI_REFRESH_RATE` | Netdata polling rate | `"10s"` |
| `$NI_NETDATA` | Netdata API URL | — |
| `$NI_HOST_TAG` | Influx host tag (recommended) | `$NI_NETDATA` |
| `$NI_CHARTS` | Space-separated list of charts to monitor | `system.cpu system.net system.pgpgio`
| `$NI_POINTS` | Number of points to fetch (0 for all) | `0` |