Ecosyste.ms: Awesome
An open API service indexing awesome lists of open source software.
https://github.com/cytomining/pycytominer
Python package for processing image-based profiling data
https://github.com/cytomining/pycytominer
carpenter-lab cellprofiler cytominer image-processing microscopy morphological-profiling python way-lab
Last synced: about 2 months ago
JSON representation
Python package for processing image-based profiling data
- Host: GitHub
- URL: https://github.com/cytomining/pycytominer
- Owner: cytomining
- License: bsd-3-clause
- Created: 2019-07-03T18:22:51.000Z (almost 5 years ago)
- Default Branch: main
- Last Pushed: 2024-04-26T19:26:34.000Z (2 months ago)
- Last Synced: 2024-04-27T18:41:47.010Z (2 months ago)
- Topics: carpenter-lab, cellprofiler, cytominer, image-processing, microscopy, morphological-profiling, python, way-lab
- Language: Python
- Homepage: https://pycytominer.readthedocs.io
- Size: 688 MB
- Stars: 66
- Watchers: 6
- Forks: 32
- Open Issues: 99
-
Metadata Files:
- Readme: README.md
- Changelog: CHANGELOG.md
- Contributing: CONTRIBUTING.md
- License: LICENSE.md
- Code of conduct: CODE_OF_CONDUCT.md
- Citation: CITATION.cff
Lists
- awesome-cytodata - PyCytominer - Methods for image-based cell profiling in Python. (Software / Genetic Perturbations)
- awesome-biological-image-analysis - Pycytominer - Data processing functions for profiling perturbations. (Other)
README

# Data processing for image-based profiling
[](https://github.com/cytomining/pycytominer/actions/workflows/integration-test.yml?query=branch%3Amain)
[](https://codecov.io/github/cytomining/pycytominer?branch=main)
[](https://github.com/psf/black)
[](https://pycytominer.readthedocs.io/)
[](https://doi.org/10.48550/arXiv.2311.13417)
Pycytominer is a suite of common functions used to process high dimensional readouts from high-throughput cell experiments.
The tool is most often used for processing data through the following pipeline:
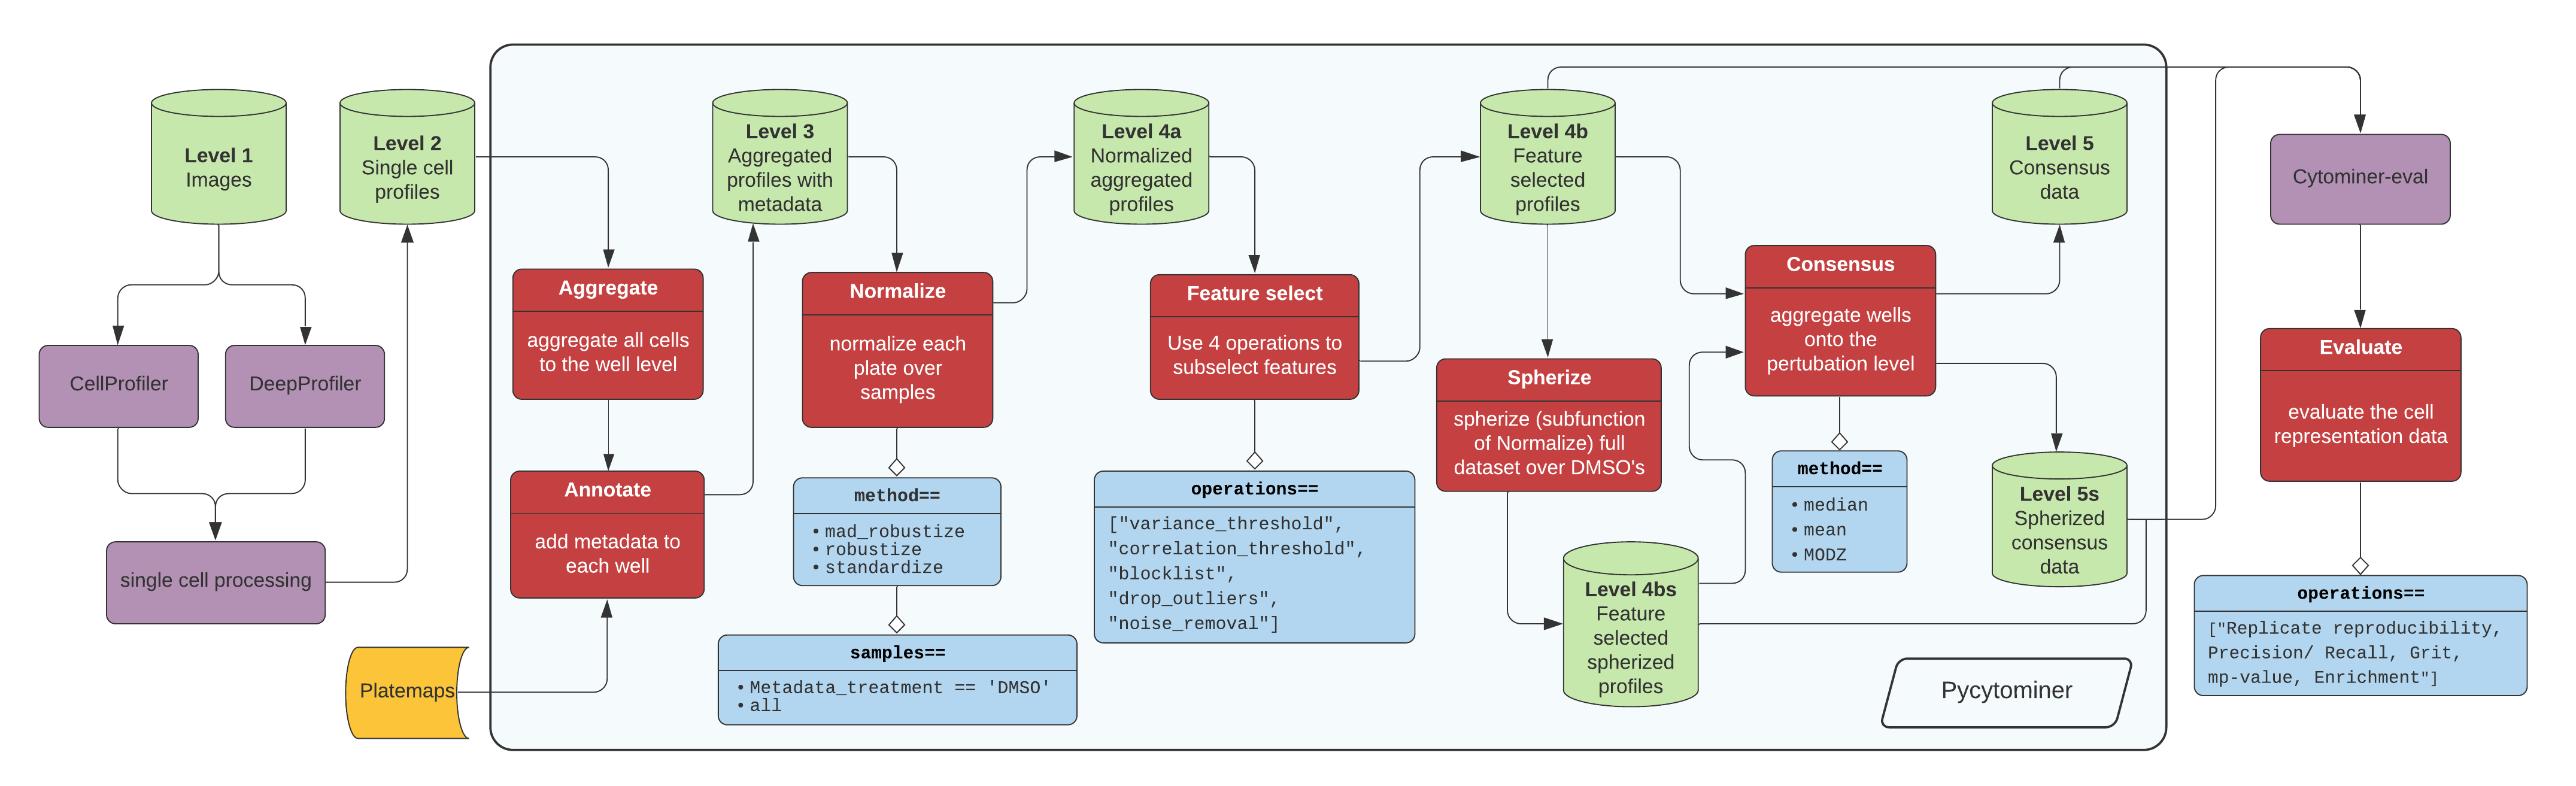
[Click here for high resolution pipeline image](https://github.com/cytomining/pycytominer/blob/main/media/pipeline.png)
Image data flow from a microscope to cell segmentation and feature extraction tools (e.g. CellProfiler or DeepProfiler).
From here, additional single cell processing tools curate the single cell readouts into a form manageable for pycytominer input.
For CellProfiler, we use [cytominer-database](https://github.com/cytomining/cytominer-database) or [CytoTable](https://github.com/cytomining/CytoTable).
For DeepProfiler, we include single cell processing tools in [pycytominer.cyto_utils](pycytominer/cyto_utils/).
From the single cell output, pycytominer performs five steps using a simple API (described below), before passing along data to [cytominer-eval](https://github.com/cytomining/cytominer-eval) for quality and perturbation strength evaluation.
## Installation
You can install pycytominer via pip:
```bash
pip install pycytominer
```
or conda:
```bash
conda install -c conda-forge pycytominer
```
## Frameworks
Pycytominer is primarily built on top of [pandas](https://pandas.pydata.org/docs/index.html), also using aspects of SQLAlchemy, sklearn, and pyarrow.
Pycytominer currently supports [parquet](https://parquet.apache.org/) and compressed text file (e.g. `.csv.gz`) i/o.
## API
Pycytominer has five major processing functions:
1. Aggregate - Average single-cell profiles based on metadata information (most often "well").
2. Annotate - Append metadata (most often from the platemap file) to the feature profile
3. Normalize - Transform input feature data into consistent distributions
4. Feature select - Exclude non-informative or redundant features
5. Consensus - Average aggregated profiles by replicates to form a "consensus signature"
The API is consistent for each of these functions:
```python
# Each function takes as input a pandas DataFrame or file path
# and transforms the input data based on the provided options and methods
df = function(
profiles_or_path,
features,
samples,
method,
output_file,
additional_options...
)
```
Each processing function has unique arguments, see our [documentation](https://pycytominer.readthedocs.io/) for more details.
## Usage
The default way to use pycytominer is within python scripts, and using pycytominer is simple and fun.
```python
# Real world example
import pandas as pd
import pycytominer
commit = "da8ae6a3bc103346095d61b4ee02f08fc85a5d98"
url = f"https://media.githubusercontent.com/media/broadinstitute/lincs-cell-painting/{commit}/profiles/2016_04_01_a549_48hr_batch1/SQ00014812/SQ00014812_augmented.csv.gz"
df = pd.read_csv(url)
normalized_df = pycytominer.normalize(
profiles=df,
method="standardize",
samples="Metadata_broad_sample == 'DMSO'"
)
```
### Pipeline orchestration
Pycytominer is a collection of different functions with no explicit link between steps.
However, some options exist to use pycytominer within a pipeline framework.
| Project | Format | Environment | pycytominer usage |
| :------------------------------------------------------------------------------- | :-------- | :------------------- | :---------------------- |
| [Profiling-recipe](https://github.com/cytomining/profiling-recipe) | yaml | agnostic | full pipeline support |
| [CellProfiler-on-Terra](https://github.com/broadinstitute/cellprofiler-on-Terra) | WDL | google cloud / Terra | single-cell aggregation |
| [CytoSnake](https://github.com/WayScience/CytoSnake) | snakemake | agnostic | full pipeline support |
A separate project called [AuSPICES](https://github.com/broadinstitute/AuSPICEs) offers pipeline support up to image feature extraction.
## Other functionality
Pycytominer was written with a goal of processing any high-throughput image-based profiling data.
However, the initial use case was developed for processing image-based profiling experiments specifically.
And, more specifically than that, image-based profiling readouts from [CellProfiler](https://github.com/CellProfiler) measurements from [Cell Painting](https://www.nature.com/articles/nprot.2016.105) data.
Therefore, we have included some custom tools in `pycytominer/cyto_utils` that provides other functionality:
- [Data processing for image-based profiling](#data-processing-for-image-based-profiling)
- [Installation](#installation)
- [Frameworks](#frameworks)
- [API](#api)
- [Usage](#usage)
- [Pipeline orchestration](#pipeline-orchestration)
- [Other functionality](#other-functionality)
- [CellProfiler CSV collation](#cellprofiler-csv-collation)
- [Creating a cell locations lookup table](#creating-a-cell-locations-lookup-table)
- [Generating a GCT file for morpheus](#generating-a-gct-file-for-morpheus)
- [Citing pycytominer](#citing-pycytominer)
Note, [`pycytominer.cyto_utils.cells.SingleCells()`](pycytominer/cyto_utils/cells.py) contains code to interact with single-cell SQLite files, which are output from CellProfiler.
Processing capabilities for SQLite files depends on SQLite file size and your available computational resources (for ex. memory and cores).
### CellProfiler CSV collation
If running your images on a cluster, unless you have a MySQL or similar large database set up then you will likely end up with lots of different folders from the different cluster runs (often one per well or one per site), each one containing an `Image.csv`, `Nuclei.csv`, etc.
In order to look at full plates, therefore, we first need to collate all of these CSVs into a single file (currently SQLite) per plate.
We currently do this with a library called [cytominer-database](https://github.com/cytomining/cytominer-database).
If you want to perform this data collation inside pycytominer using the `cyto_utils` function `collate` (and/or you want to be able to run the tests and have them all pass!), you will need `cytominer-database==0.3.4`; this will change your installation commands slightly:
```bash
# Example for general case commit:
pip install "pycytominer[collate]"
# Example for specific commit:
pip install "pycytominer[collate] @ git+https://github.com/cytomining/pycytominer@77d93a3a551a438799a97ba57d49b19de0a293ab"
```
If using `pycytominer` in a conda environment, in order to run `collate.py`, you will also want to make sure to add `cytominer-database=0.3.4` to your list of dependencies.
### Creating a cell locations lookup table
The `CellLocation` class offers a convenient way to augment a [LoadData](https://cellprofiler-manual.s3.amazonaws.com/CPmanual/LoadData.html) file with X,Y locations of cells in each image.
The locations information is obtained from a single cell SQLite file.
To use this functionality, you will need to modify your installation command, similar to above:
```bash
# Example for general case commit:
pip install "pycytominer[cell_locations]"
```
Example using this functionality:
```bash
metadata_input="s3://cellpainting-gallery/test-cpg0016-jump/source_4/workspace/load_data_csv/2021_08_23_Batch12/BR00126114/test_BR00126114_load_data_with_illum.parquet"
single_single_cell_input="s3://cellpainting-gallery/test-cpg0016-jump/source_4/workspace/backend/2021_08_23_Batch12/BR00126114/test_BR00126114.sqlite"
augmented_metadata_output="~/Desktop/load_data_with_illum_and_cell_location_subset.parquet"
python \
-m pycytominer.cyto_utils.cell_locations_cmd \
--metadata_input ${metadata_input} \
--single_cell_input ${single_single_cell_input} \
--augmented_metadata_output ${augmented_metadata_output} \
add_cell_location
# Check the output
python -c "import pandas as pd; print(pd.read_parquet('${augmented_metadata_output}').head())"
# It should look something like this (depends on the width of your terminal):
# Metadata_Plate Metadata_Well Metadata_Site ... PathName_OrigRNA ImageNumber CellCenters
# 0 BR00126114 A01 1 ... s3://cellpainting-gallery/cpg0016-jump/source_... 1 [{'Nuclei_Location_Center_X': 943.512129380054...
# 1 BR00126114 A01 2 ... s3://cellpainting-gallery/cpg0016-jump/source_... 2 [{'Nuclei_Location_Center_X': 29.9516027655562...
```
### Generating a GCT file for morpheus
The software [morpheus](https://software.broadinstitute.org/morpheus/) enables profile visualization in the form of interactive heatmaps.
Pycytominer can convert profiles into a `.gct` file for drag-and-drop input into morpheus.
```python
# Real world example
import pandas as pd
import pycytominer
commit = "da8ae6a3bc103346095d61b4ee02f08fc85a5d98"
plate = "SQ00014812"
url = f"https://media.githubusercontent.com/media/broadinstitute/lincs-cell-painting/{commit}/profiles/2016_04_01_a549_48hr_batch1/{plate}/{plate}_normalized_feature_select.csv.gz"
df = pd.read_csv(url)
output_file = f"{plate}.gct"
pycytominer.cyto_utils.write_gct(
profiles=df,
output_file=output_file
)
```
## Citing pycytominer
If you have used `pycytominer` in your project, please use the citation below.
You can also find the citation in the 'cite this repository' link at the top right under `about` section.
APA:
```text
Serrano, E., Chandrasekaran, N., Bunten, D., Brewer, K., Tomkinson, J., Kern, R., Bornholdt, M., Fleming, S., Pei, R., Arevalo, J., Tsang, H., Rubinetti, V., Tromans-Coia, C., Becker, T., Weisbart, E., Bunne, C., Kalinin, A. A., Senft, R., Taylor, S. J., Jamali, N., Adeboye, A., Abbasi, H. S., Goodman, A., Caicedo, J., Carpenter, A. E., Cimini, B. A., Singh, S., & Way, G. P. Reproducible image-based profiling with Pycytominer. https://doi.org/10.48550/arXiv.2311.13417
```