Ecosyste.ms: Awesome
An open API service indexing awesome lists of open source software.
https://github.com/tiagolr/dconsole
Haxe game-like console that provides runtime acess to methods, variables and more.
https://github.com/tiagolr/dconsole
Last synced: 2 months ago
JSON representation
Haxe game-like console that provides runtime acess to methods, variables and more.
- Host: GitHub
- URL: https://github.com/tiagolr/dconsole
- Owner: tiagolr
- License: mit
- Created: 2012-11-21T12:53:47.000Z (over 11 years ago)
- Default Branch: master
- Last Pushed: 2020-05-20T19:31:25.000Z (about 4 years ago)
- Last Synced: 2024-04-28T07:17:24.533Z (2 months ago)
- Language: Haxe
- Homepage:
- Size: 590 KB
- Stars: 170
- Watchers: 23
- Forks: 19
- Open Issues: 12
-
Metadata Files:
- Readme: README.md
- Changelog: CHANGELOG
- License: LICENSE
Lists
- awesome-snowkit - DConsole - game drop-down console that provides runtime acess to methods, variables and more. (People / Libraries)
README
# DConsole
**DConsole** or **The Console** is a real-time console that allows to:
* Run scripts.
* Access and modify fields and objects.
* Call registered functions.
* Monitor fields.
* Customize appearence.
* Profile the app in realtime.
* Register new commands that respond to user input.
**Latest Changes - 5.0.0**
* Luxe support added
For more changes or other versions, see [CHANGELOG](https://github.com/ProG4mr/dconsole/blob/master/CHANGELOG).
Currently supported targets:
* Openfl - flash
* Openfl - cpp (working with -Dlegacy flag)
* Openfl - neko (working with -Dlegacy flag)
* Luxe - Web
* Luxe - Windows
####Donsole-online
You can try dconsole [on this repo github pages](http://tiagolr.github.io/dconsole/).
####Install
```
haxelib install dconsole
```
####Getting Started
Using dconsole is straightforward:
```actionscript
import pgr.dconsole.DC;
DC.init();
DC.log("This text will be logged.");
DC.registerFunction(this.testFunction, "myfunction");
DC.registerObject(this, "myobject");
DC.registerClass(Math, "Math");
```
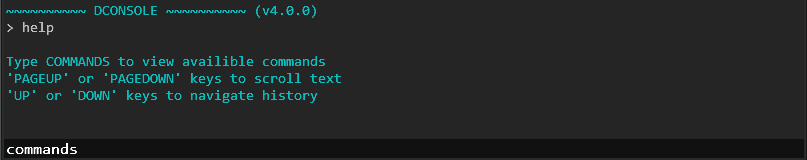
To show the console, press **TAB**, then type **"help"** or **"commands"**
to see what commands are available, also **"objects"** and **"functions"** are useful commands to show registered objects and functions.
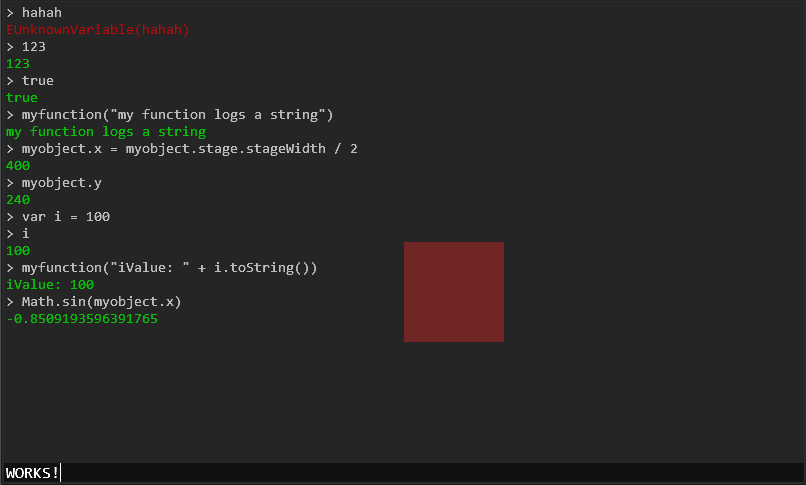
The console can be used to control your application, accessing registered objects and functions in realtime
without having to re-compile. Its also possible to evaluate complex expressions and scripts using haxe sintax.
####Monitor
The monitor allows you to register fields and monitor their value in real time.
For example, to monitor a display object x position:
```js
DG.monitorField(player, "x", "playerX");
```
Pressing **CTRL + TAB** brings up the monitor that shows the variable updated in real time
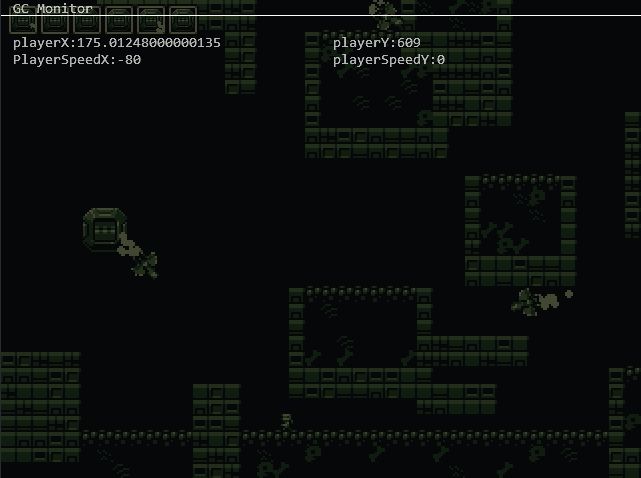
The screenshot shows monitor being used in Adam Atomic's Mode demo.
####Profiler
The profiler is lightweight and portable tool that shows:
* What code is eating more cpu.
* How many times is some code executed inside other code block.
* How much time code takes to execute (benchmark)
* Other statistics not shown by default like absolute elapsed, min, max, totalInstances etc..
To sample a code block do:
```js
DC.beginProfile("SampleName");
// Code goes here
DC.endProfile("SampleName");
```
Toggling the profiler with **SHIFT + TAB** shows real-time statistics that are updated according to refresh rate.
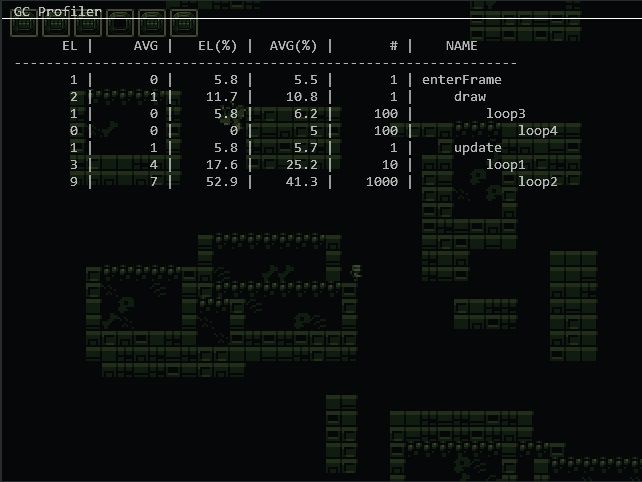
The screenshot shows the profiler using multiple nested samples, idents are used to vizualize the samples hierarchy.
* *EL* elapsed milliseconds
* *AVG* average elapsed milliseconds
* *EL(%)* elapsed percentage
* *AVG(%)* average elapsed percentage
* *#* Occurrences of sample inside root sample
* *Name* Sample name
###HTML5 / JS (Experimental)
DConsole can also run on html5 / javascript using jquery-terminal to process input and log console output (who needs web-kit console right?)
1. Add [jquery-terminal](http://terminal.jcubic.pl/) to your html page.
2. Add the tag ```
``` inside ``````
4. Add the following script ``````):
```html
<script src="http://code.jquery.com/jquery-2.1.1.min.js" >
terminal = $('#console').terminal(function(command, term) {
if (command !== '') {
pgr.dconsole.DC.eval(command);
} else {
term.echo('');
}
}, {
greetings: false,
name: 'dconsole',
width: "100%",
height: "200",
prompt: '> ',
});
document.addEventListener('console_log', function(evt) {
terminal.echo(evt.detail.data, {
finalize: function(div) {
div.css("color", "#" + evt.detail.color);
}
});
});
```
Notes: dead code elimination must be off ```-dce no```, otherwise problems may occur. You can also refer to this repo github pages [github pages](http://tiagolr.github.io/dconsole/) to see how to use dconsole with html5.
####Tips and Tricks
* *DC.init(100)* will start the console with 100% height.
* *DC.setVerboseErrors(true)* prints stack information when erros occur.
* Use *DC.registerCommand(...)* to add custom commands.
* Use *DC.registerClass(...)* to enable classes to be used from the console.
####Suggestions / Comments / Bugs
[Email me](mailto:[email protected]) suggestions, comments, bug reports etc..
Or create a new issue (even better).