Ecosyste.ms: Awesome
An open API service indexing awesome lists of open source software.
https://github.com/KDD-OpenSource/DeepADoTS
Repository of the paper "A Systematic Evaluation of Deep Anomaly Detection Methods for Time Series".
https://github.com/KDD-OpenSource/DeepADoTS
anomaly-detection deep-learning pytorch tensorflow time-series timeseries
Last synced: about 2 months ago
JSON representation
Repository of the paper "A Systematic Evaluation of Deep Anomaly Detection Methods for Time Series".
- Host: GitHub
- URL: https://github.com/KDD-OpenSource/DeepADoTS
- Owner: KDD-OpenSource
- License: mit
- Created: 2018-04-20T13:54:52.000Z (about 6 years ago)
- Default Branch: master
- Last Pushed: 2022-05-25T06:27:30.000Z (about 2 years ago)
- Last Synced: 2024-02-04T22:39:38.408Z (5 months ago)
- Topics: anomaly-detection, deep-learning, pytorch, tensorflow, time-series, timeseries
- Language: Python
- Homepage:
- Size: 3.59 MB
- Stars: 538
- Watchers: 17
- Forks: 113
- Open Issues: 11
-
Metadata Files:
- Readme: README.md
- License: LICENSE
Lists
- awesome-anomaly-detection - `[code
- A-list-of-awesome-anomaly-detection-resources - `[code
- awesome-TS-anomaly-detection_zh - DeepADoTS
- awesome-TS-anomaly-detection - DeepADoTS - based techniques for Anomaly Detection on Time-Series data. | MIT | ❌ (Anomaly Detection Software)
README
# Anomaly Detection on Time Series: An Evaluation of Deep Learning Methods. [](https://circleci.com/gh/KDD-OpenSource/DeepADoTS/tree/master)
The goal of this repository is to provide a benchmarking pipeline for anomaly detection on time series data for multiple state-of-the-art deep learning methods.
## Implemented Algorithms
| Name | Paper |
|--------------------|---------------------|
| LSTM-AD | [Long short term memory networks for anomaly detection in time series](https://www.elen.ucl.ac.be/Proceedings/esann/esannpdf/es2015-56), ESANN 2015 |
| LSTM-ED |[LSTM-based encoder-decoder for multi-sensor anomaly detection](https://arxiv.org/pdf/1607.00148.pdf), ICML 2016|
| Autoencoder | [Outlier detection using replicator neural networks](https://link.springer.com/content/pdf/10.1007%2F3-540-46145-0_17.pdf), DaWaK 2002 |
| Donut| [Unsupervised Anomaly Detection via Variational Auto-Encoder for Seasonal KPIs in Web Applications](https://arxiv.org/pdf/1802.03903.pdf), WWW 2018 |
| REBM | [Deep structured energy based models for anomaly detection](http://proceedings.mlr.press/v48/zhai16.pdf), ICML 2016|
|DAGMM| [Deep autoencoding gaussian mixture model for unsupervised anomaly detection](https://openreview.net/pdf?id=BJJLHbb0-), ICLR 2018|
|LSTM-DAGMM | Extension of [DAGMM](https://openreview.net/pdf?id=BJJLHbb0-) using an [LSTM](https://www.bioinf.jku.at/publications/older/2604.pdf)-Autoencoder instead of a Neural Network Autoencoder|
## Usage
```bash
git clone git://github.com/KDD-OpenSource/DeepADoTS.git
virtualenv venv -p /usr/bin/python3
source venv/bin/activate
pip install -r requirements.txt
python3 main.py
```
## Example
We follow the [scikit-learn API](http://scikit-learn.org/dev/developers/contributing.html#different-objects) by offering the interface methods `fit(X)` and `predict(X)`. The former estimates the data distribution in an unsupervised way while the latter returns an anomaly score for each instance - the higher, the more certain is the model that the instance is an anomaly. To compare the performance of methods, we use the [ROC AUC](http://scikit-learn.org/stable/modules/generated/sklearn.metrics.roc_auc_score.html) value.
We use MNIST to demonstrate the usage of a model since it is already available in TensorFlow and does not require downloading external data (even though the data has no temporal aspect).
```python
import pandas as pd
import tensorflow as tf
from sklearn.metrics import roc_auc_score
from src.algorithms import AutoEncoder
from src.datasets import Dataset
class MNIST(Dataset):
"""0 is the outlier class. The training set is free of outliers."""
def __init__(self, seed):
super().__init__(name="MNIST", file_name='') # We do not need to load data from a file
self.seed = seed
def load(self):
# 0 is the outlier, all other digits are normal
OUTLIER_CLASS = 0
mnist = tf.keras.datasets.mnist
(x_train, y_train), (x_test, y_test) = mnist.load_data()
# Label outliers with 1 and normal digits with 0
y_train, y_test = (y_train == OUTLIER_CLASS), (y_test == OUTLIER_CLASS)
x_train = x_train[~y_train] # Remove outliers from the training set
x_train, x_test = x_train / 255, x_test / 255
x_train, x_test = x_train.reshape(-1, 784), x_test.reshape(-1, 784)
self._data = tuple(pd.DataFrame(data=data) for data in [x_train, y_train, x_test, y_test])
x_train, y_train, x_test, y_test = MNIST(seed=0).data()
# Use fewer instances for demonstration purposes
x_train, y_train = x_train[:1000], y_train[:1000]
x_test, y_test = x_test[:100], y_test[:100]
model = AutoEncoder(sequence_length=1, num_epochs=40, hidden_size=10, lr=1e-4)
model.fit(x_train)
error = model.predict(x_test)
print(roc_auc_score(y_test, error)) # e.g. 0.8614
```
We can visualize the samples with respective error values as follows
```python
import numpy as np
import matplotlib.pyplot as plt
from matplotlib import offsetbox
"""Borrowed from https://github.com/scikit-learn/scikit-learn/blob/master/examples/manifold/plot_lle_digits.py#L44"""
error = (error - error.min()) / (error.max() - error.min()) # Normalize error
x_test = x_test.values
y_random = np.random.rand(len(x_test)) * 2 - 1
plt.figure(figsize=(20, 10))
ax = plt.subplot(111)
if hasattr(offsetbox, 'AnnotationBbox'):
shown_images = np.array([[1., 1.]])
for i in range(len(x_test)):
X_instance = [error[i], y_random[i]]
dist = np.sum((X_instance - shown_images) ** 2, 1)
if np.min(dist) < 4e-5:
# don't show points that are too close
continue
shown_images = np.r_[shown_images, [X_instance]]
imagebox = offsetbox.AnnotationBbox(offsetbox.OffsetImage(x_test[i].reshape(28, 28), cmap=plt.cm.gray_r), X_instance)
ax.add_artist(imagebox)
plt.xlim((0, 1.1))
plt.ylim((-1.2, 1.2))
plt.xlabel("Anomaly Score")
plt.title("Predicted Anomaly Score for the Test Set")
plt.show()
```
Which creates a plot like this
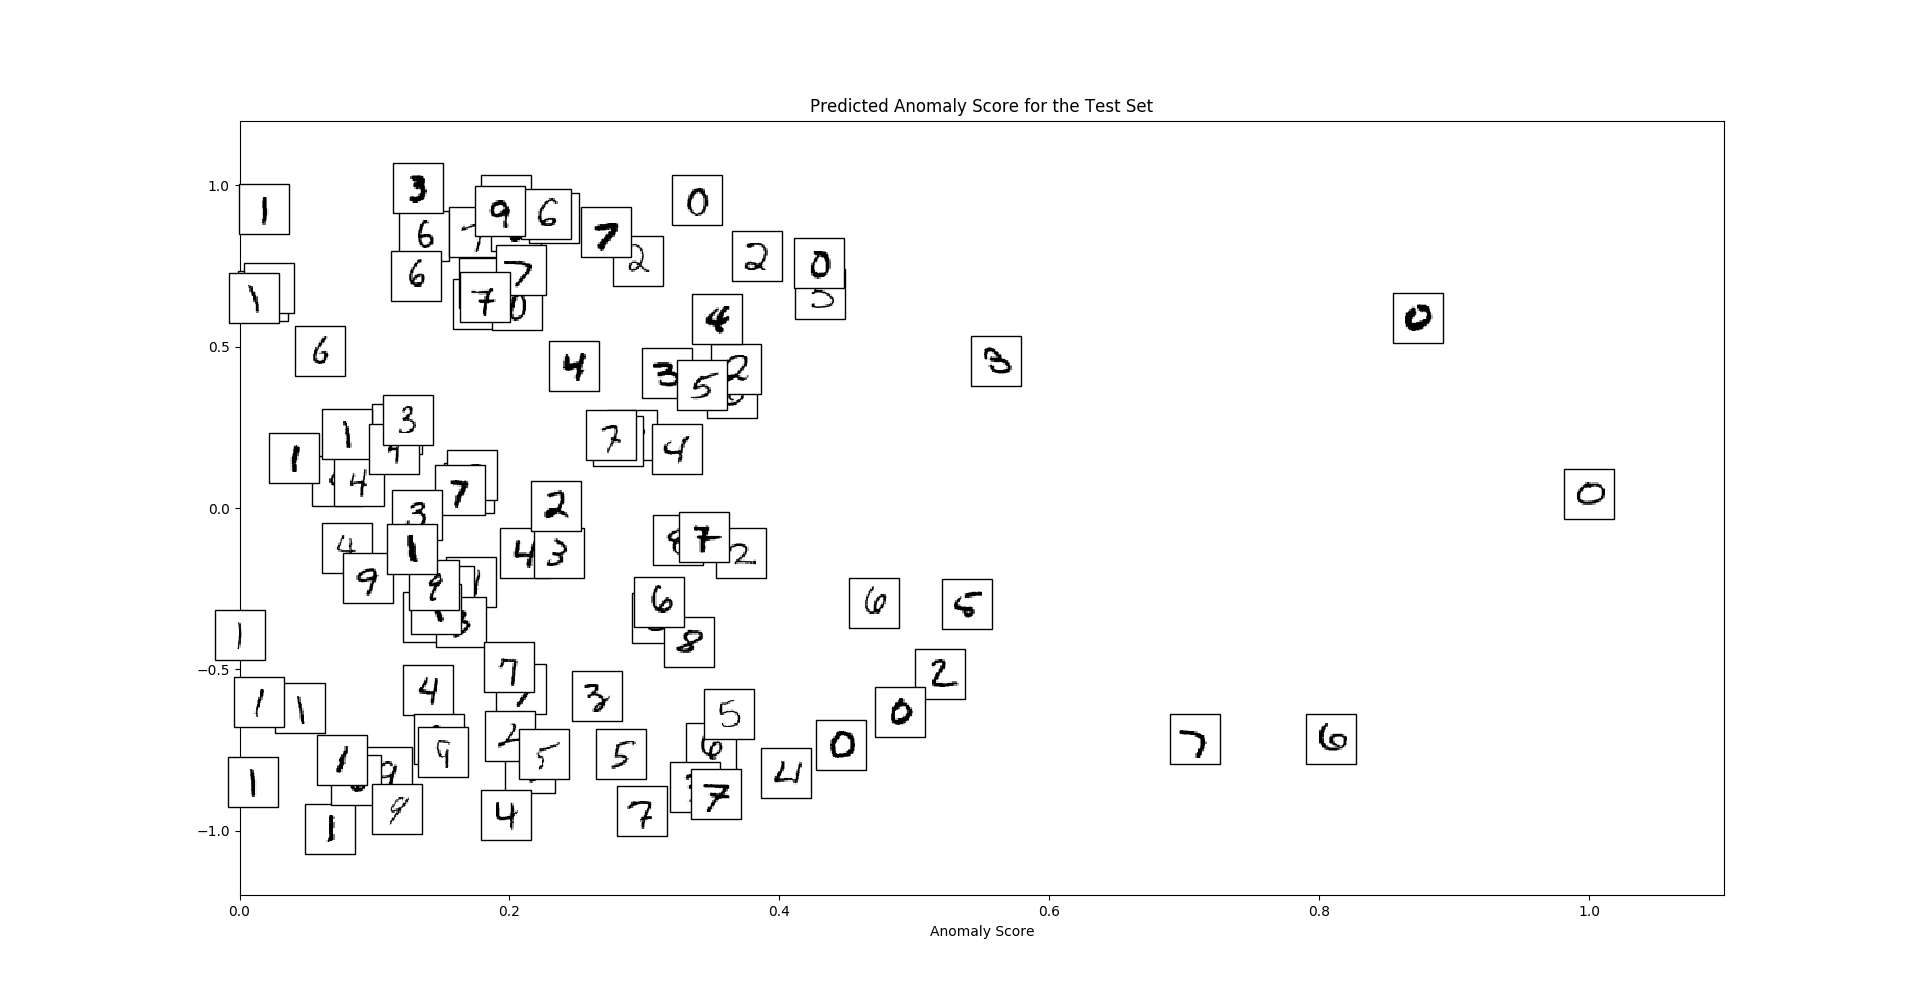
We can see that global outliers (zeros) and local outliers (strangely written digits) receive high anomaly scores.
## Deployment
- `docker build -t deep-adots .`
- `docker run -ti deep-adots /bin/bash -c "python3.6 /repo/main.py"`
## Authors/Contributors
Team:
* [Maxi Fischer](https://github.com/maxifischer)
* [Willi Gierke](https://github.com/WGierke)
* [Thomas Kellermeier](https://github.com/Chaoste)
* [Ajay Kesar](https://github.com/weaslbe)
* [Axel Stebner](https://github.com/xasetl)
* [Daniel Thevessen](https://github.com/danthe96)
Supervisors:
* [Lukas Ruff](https://github.com/lukasruff)
* [Fabian Geier](https://github.com/fabiangei)
* [Emmanuel Müller](https://github.com/emmanuel-mueller)
## Credits
[Base implementation for DAGMM](https://github.com/danieltan07/dagmm)
[Base implementation for Donut](https://github.com/haowen-xu/donut)
[Base implementation for Recurrent EBM](https://github.com/dshieble/Music_RNN_RBM)
[Downloader for real-world datasets](https://github.com/chickenbestlover/RNN-Time-series-Anomaly-Detection/blob/master/0_download_dataset.py)