Ecosyste.ms: Awesome
An open API service indexing awesome lists of open source software.
https://github.com/bluegreen-labs/snotelr
a snow data network (SNOTEL) R package
https://github.com/bluegreen-labs/snotelr
climate-data data-retrieval precipitation-data r-package rstats snotel snow
Last synced: about 2 months ago
JSON representation
a snow data network (SNOTEL) R package
- Host: GitHub
- URL: https://github.com/bluegreen-labs/snotelr
- Owner: bluegreen-labs
- License: agpl-3.0
- Created: 2016-12-20T16:41:28.000Z (over 7 years ago)
- Default Branch: master
- Last Pushed: 2024-02-04T09:49:37.000Z (5 months ago)
- Last Synced: 2024-04-05T13:46:07.210Z (3 months ago)
- Topics: climate-data, data-retrieval, precipitation-data, r-package, rstats, snotel, snow
- Language: R
- Homepage: https://bluegreen-labs.github.io/snotelr/
- Size: 59 MB
- Stars: 13
- Watchers: 5
- Forks: 7
- Open Issues: 1
-
Metadata Files:
- Readme: README.md
- License: LICENSE
Lists
- open-sustainable-technology - snotelr - R toolbox to facilitate easy SNOTEL data exploration and downloads through a convenient shiny based GUI. (Cryosphere / Snow and Permafrost)
README
# snotelr 
[](https://github.com/bluegreen-labs/snotelr/actions/workflows/R-CMD-check.yaml)
[](https://app.codecov.io/gh/bluegreen-labs/snotelr)
[](https://cran.r-project.org/package=snotelr)
[](https://cran.r-project.org/package=snotelr)
[](https://doi.org/10.5281/zenodo.7012728)
`snotelr` is an R toolbox to facilitate easy SNOTEL data exploration and downloads through a convenient R [shiny](https://shiny.posit.co/) based GUI. In addition it provides a routine to extract basic snow phenology metrics.
## How to cite this package in your article
You can cite this package like this "we obtained data from SNOTEL using the `snotelr` R package (Hufkens 2022)". Here is the full bibliographic reference to include in your reference list:
> Hufkens, K. (2022). snotelr: a toolbox to facilitate easy SNOTEL data exploration and downloads in R. Zenodo. https://doi.org/10.5281/zenodo.7012728.
## Installation
### stable release
To install the current stable release use a CRAN repository:
```r
install.packages("snotelr")
library("snotelr")
```
The use of the GUI requires the installation of additional packages, which are side loaded.
```r
install.packages(c("DT","shinydashboard", "plotly", "leaflet"))
```
### development release
To install the development releases of the package run the following
commands:
```r
if(!require(remotes)){install.packages("remotes")}
remotes::install_github("bluegreen-labs/snotelr")
library("snotelr")
```
Vignettes are not rendered by default, if you want to include additional
documentation please use:
```r
if(!require(remotes)){install.packages("remotes")}
remotes::install_github("bluegreen-labs/snotelr", build_vignettes = TRUE)
library("snotelr")
```
## Use
Most people will prefer the GUI to explore data on the fly. To envoke the GUI use the following command:
```r
library(snotelr)
snotel_explorer()
```
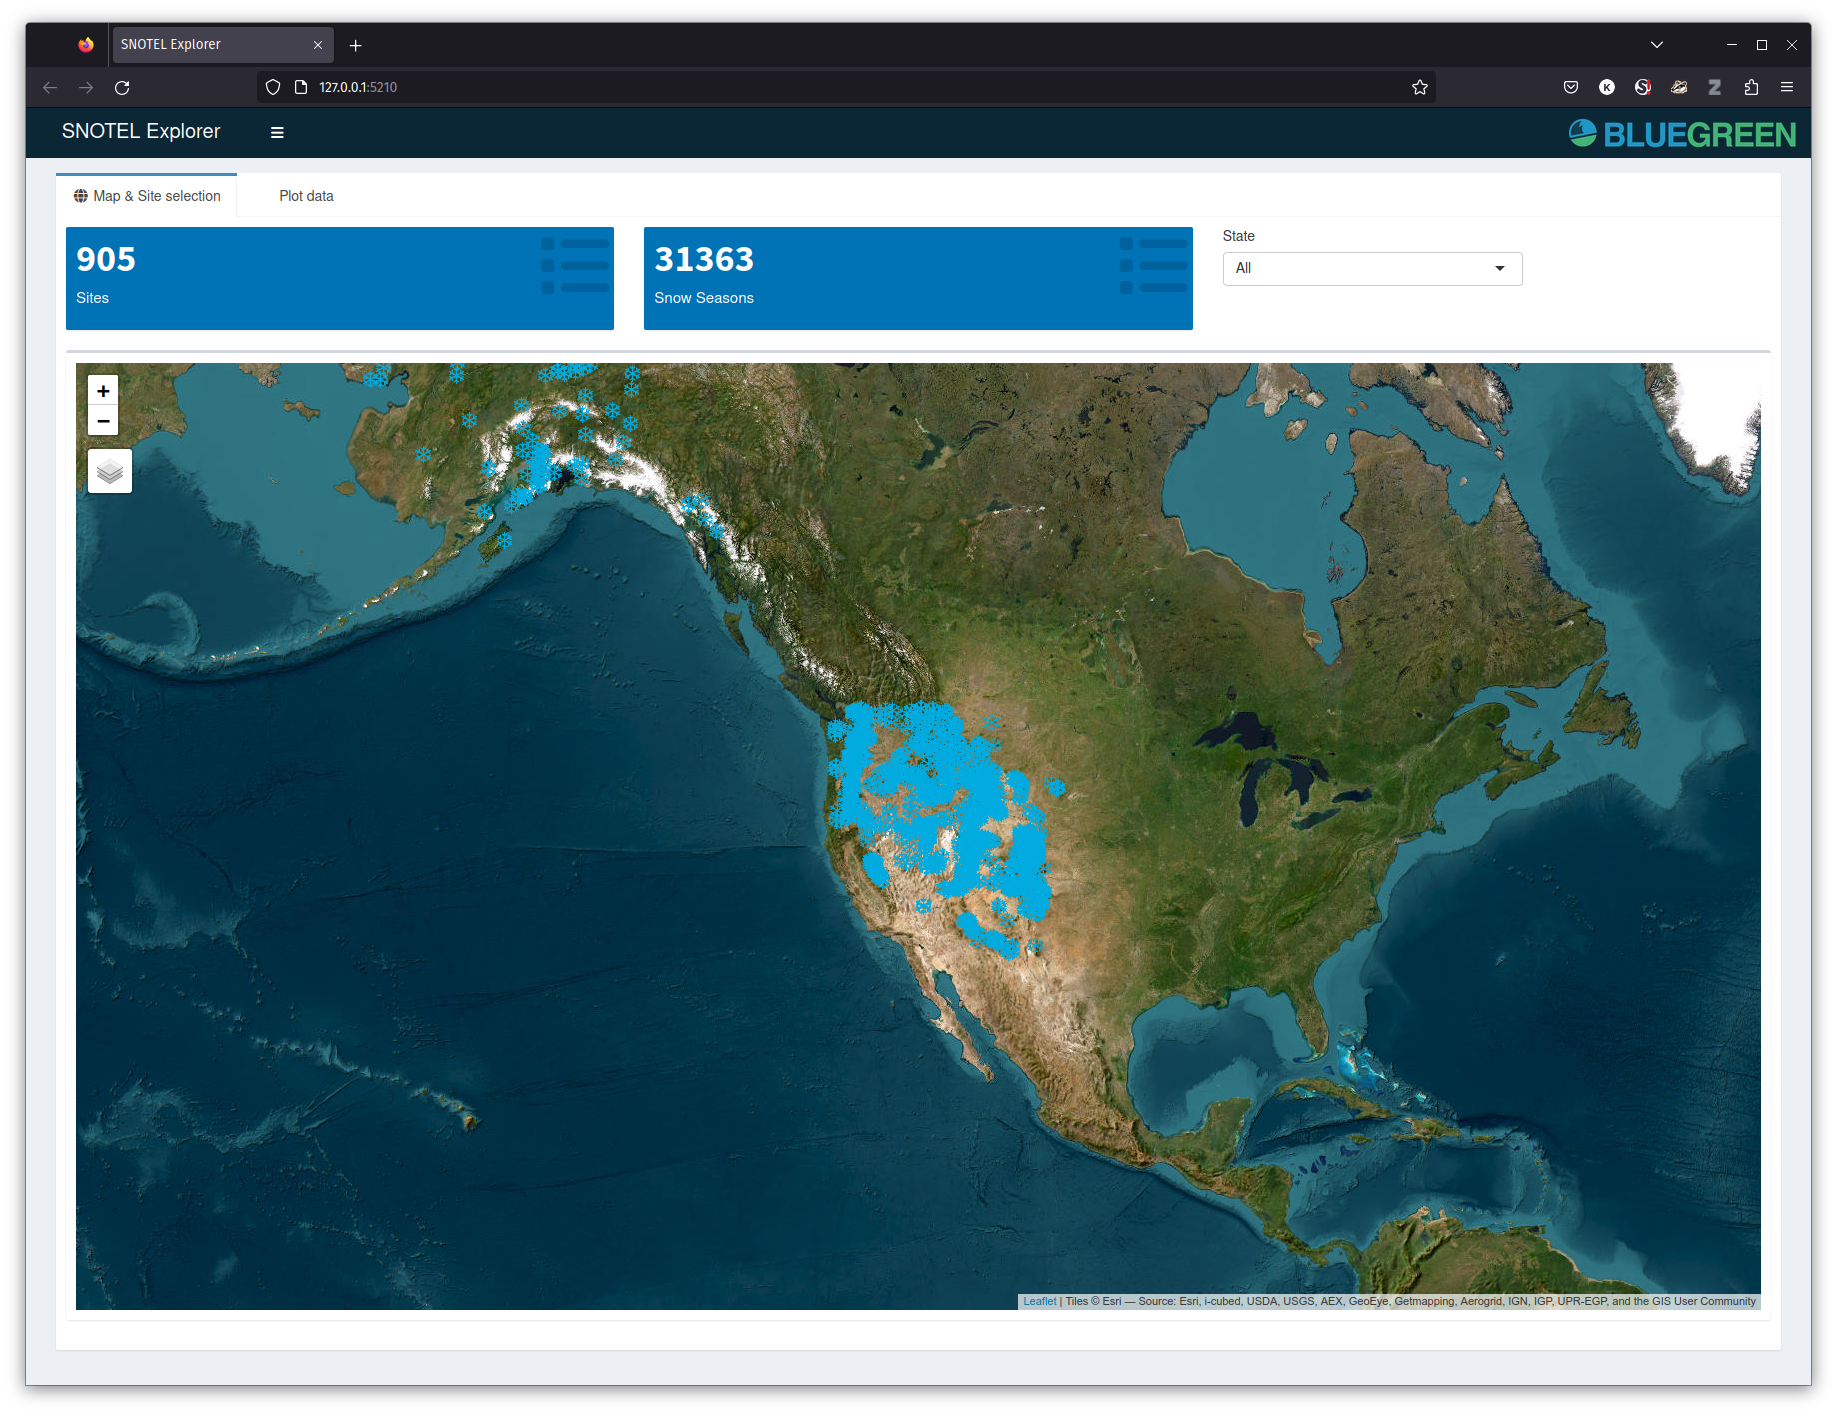
This will start a shiny application with an R backend in your default browser. The first window will display all site locations, and allows for subsetting of the data based upon state or a bounding box. The bounding box can be selected by clicking top-left and bottom-right.
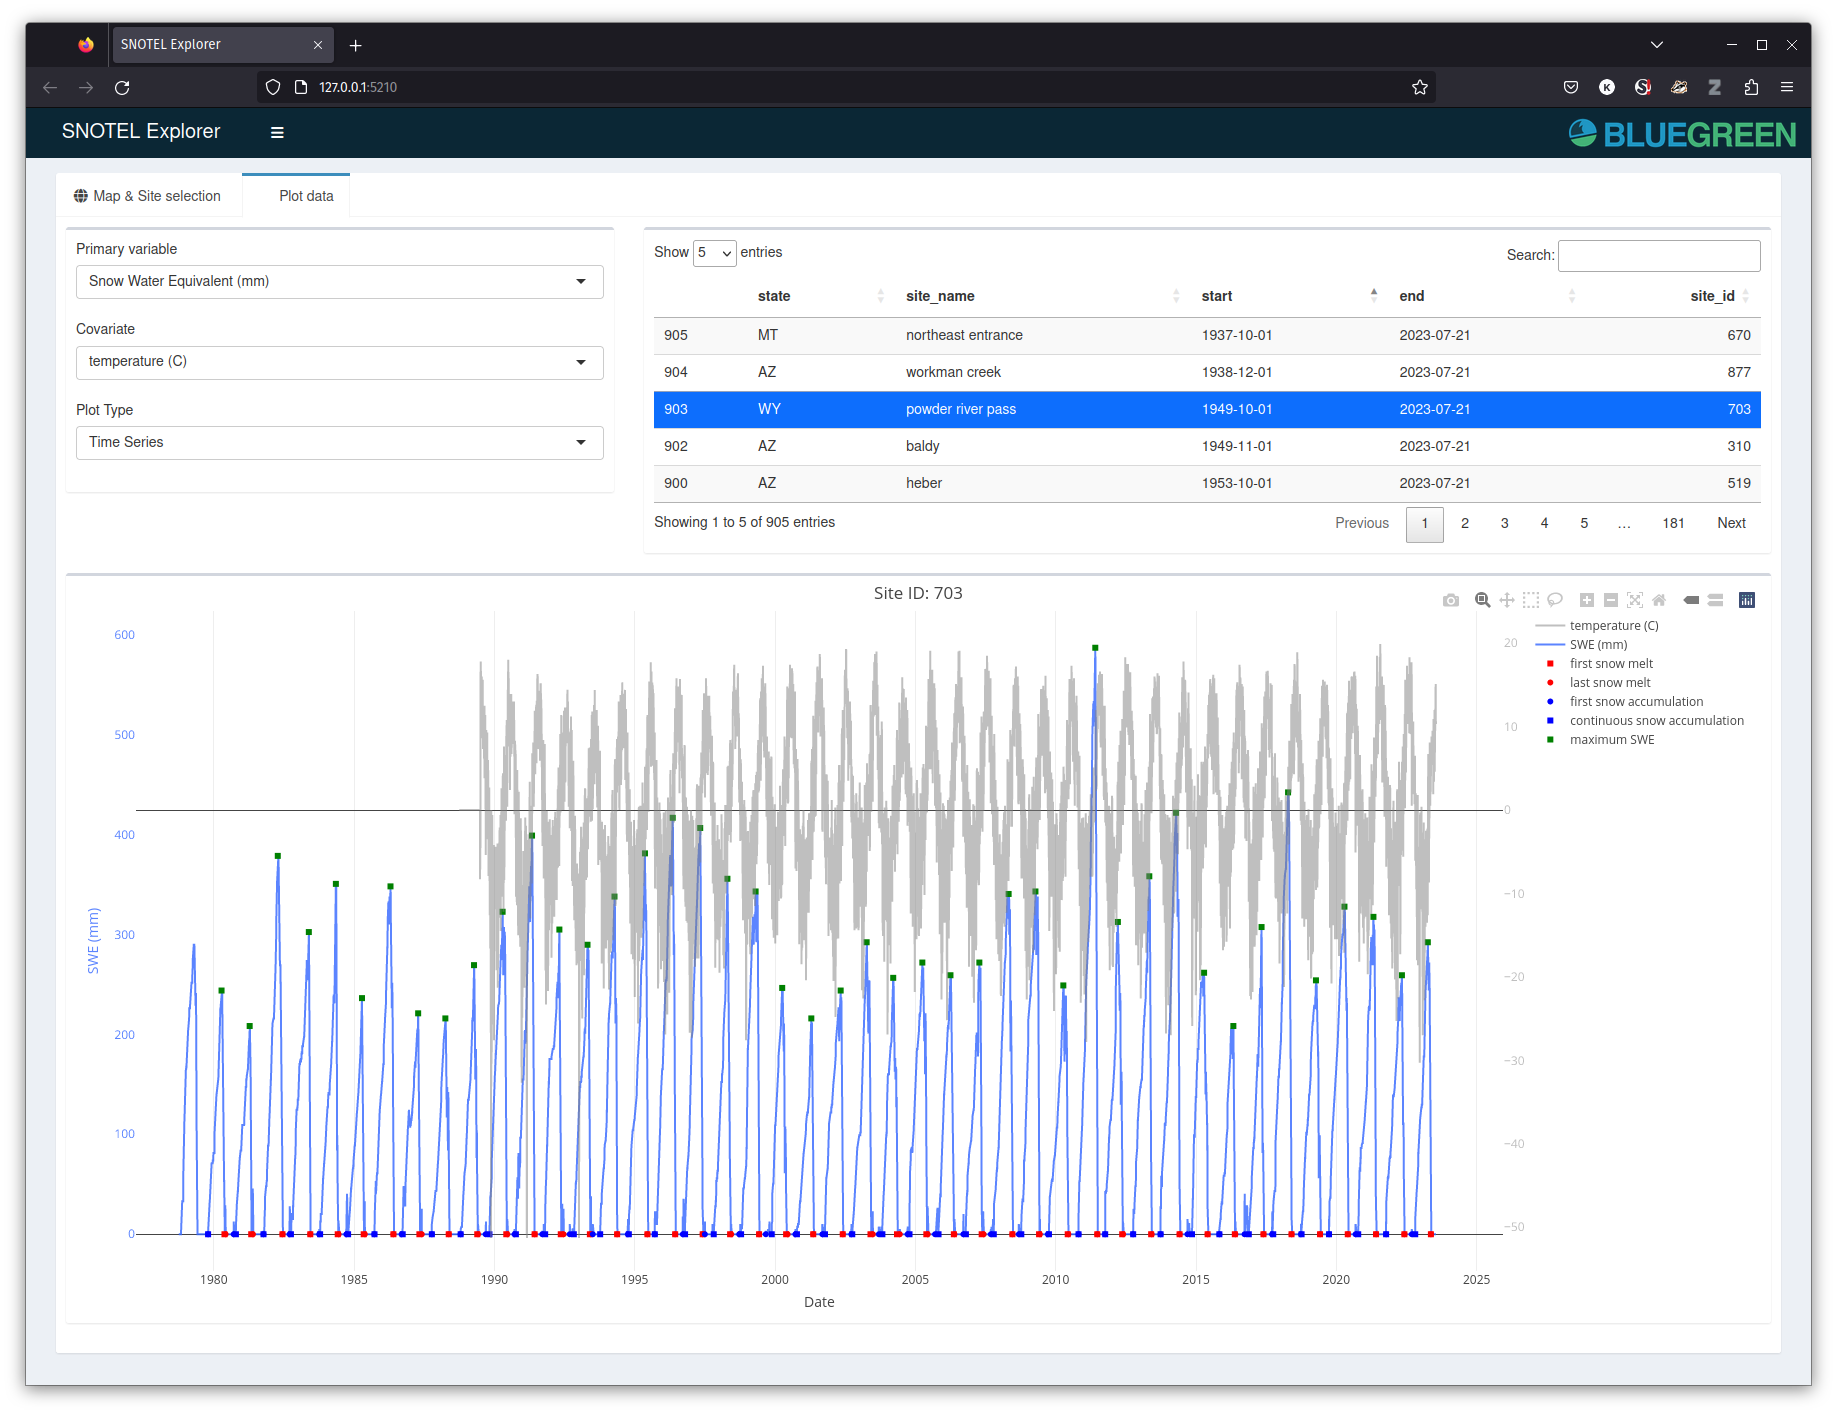
The *plot data* tab allows for interactive viewing of the soil water equivalent (SWE) data together with a covariate (temperature, precipitation). The SWE time series will also mark snow phenology statistics, mainly the day of:
- first snow melt
- a continuous snow free season (last snow melt)
- first snow accumulation (first snow deposited)
- continuous snow accumulation (permanent snow cover)
- seasonal maximum SWE (and its amount)
All values are provided as relative to January first of the year mentioned (spring), and absolute dates.
To access the full list of SNOTEL sites and associated meta-data use the **snotel_info()** function.
```r
# returns the site info as snotel_metadata.txt in the current working directory
snotel_info(path = ".")
# export to data frame
meta-data <- snotel_info(path = NULL)
# show some lines of the data frame
head(meta-data)
```
To query data for e.g. site 924 as shown in the image above use:
```r
snotel_download(site_id = 924)
```
For in depth analysis the statistics in the GUI can be retrieved using the **snotel_phenology()** function
```r
# with df a SNOTEL file or data frame in your R workspace
snotel_phenology(df)
```
# References
Hufkens, K. (2022). snotelr: a toolbox to facilitate easy SNOTEL data exploration and downloads in R. Zenodo. https://doi.org/10.5281/zenodo.7012728.
# Acknowledgements
This project was in part supported by the National Science Foundation’s Macro-system Biology Program (award EF-1065029) and the Marie Skłodowska-Curie Action (H2020 grant 797668). Logo design elements are taken from the FontAwesome library according to [these terms](https://fontawesome.com/license), where the globe element was inverted and intersected.