Ecosyste.ms: Awesome
An open API service indexing awesome lists of open source software.
https://github.com/yunusemrejs/chartjs-image-label
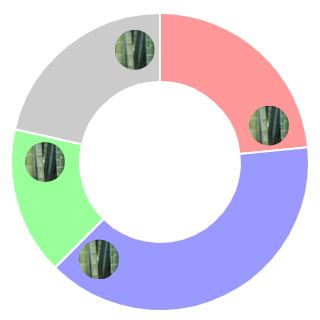
Chart.js plugin to add image labels to doughnut charts
https://github.com/yunusemrejs/chartjs-image-label
Last synced: 3 months ago
JSON representation
Chart.js plugin to add image labels to doughnut charts
- Host: GitHub
- URL: https://github.com/yunusemrejs/chartjs-image-label
- Owner: yunusemrejs
- License: mit
- Created: 2023-10-22T16:27:26.000Z (8 months ago)
- Default Branch: main
- Last Pushed: 2024-03-18T09:46:20.000Z (3 months ago)
- Last Synced: 2024-03-18T10:43:01.922Z (3 months ago)
- Language: TypeScript
- Size: 57.6 KB
- Stars: 0
- Watchers: 1
- Forks: 0
- Open Issues: 0
-
Metadata Files:
- Readme: README.md
- License: LICENSE
Lists
- awesome - image-label
README
# Chart.js Image Label Plugin
The **Chart.js Image Label Plugin** is an extension for [Chart.js](https://www.chartjs.org/) that allows you to add images as labels to a Doughnut chart. This plugin enables you to enhance your charts with images, making the visualization more engaging and informative.
What it looks like:
## Installation
You can install the Chart.js Image Label Plugin using npm or yarn:
```bash
npm install chartjs-plugin-image-label
```
## Usage
To use this plugin, follow these steps:
- Include the plugin in your Chart.js setup.
```javascript
import { Chart } from 'chart.js';
import ChartPluginImageLabel from 'chartjs-plugin-image-label';
const ctx = document.getElementById('myDoughnutChart');
new Chart(ctx, {
// other chart configuration
plugins: [ChartPluginImageLabel]
})
```
- Create your Doughnut chart and configure it with image labels:
```javascript
const ctx = document.getElementById('myDoughnutChart');
const data = {
labels: ['Label 1', 'Label 2', 'Label 3'],
datasets: [
{
data: [30, 40, 30],
backgroundColor: ['red', 'blue', 'green'],
},
],
};
new Chart(ctx, {
type: 'doughnut',
data: data,
options: {
plugins: {
imageLabel: {
verticalAlign: 'middle',
horizontalAlign: 'middle',
offset: 10,
imagesList: [{
imageUrl: 'https://picsum.photos/40',
imageWidth: 40,
imageHeight: 40
},
{
imageUrl: 'https://picsum.photos/40',
imageWidth: 40,
imageHeight: 40
},
{
imageUrl: 'https://picsum.photos/40',
imageWidth: 40,
imageHeight: 40
}]
}
}
},
});
```
## Configuration
The plugin supports the following configuration options:
| Option | Values | Description |
| ------------------ | --------------------------------- | --------------------------------------------------------------------------------------------------------- |
| `verticalAlign` | `top`, `middle`, `bottom` | Specifies the vertical alignment of the image label within the chart slice. |
| `horizontalAlign` | `start`, `middle`, `end` | Specifies the horizontal alignment of the image label within the chart slice. |
| `offset` | `Number` | Horizontal offset between slices |
| `imagesList` | Array of objects | An array of objects that define the images to be used as labels. |
### `imagesList` Object Structure
Each object in the `imagesList` array should have the following structure:
| Property | Type | Description |
| ------------------ | --------------- | ------------------------------------------------- |
| `imageUrl` | `String` | The URL of the image to be used as a label. |
| `imageWidth` | `Number` | The width of the image in pixels. |
| `imageHeight` | `Number` | The height of the image in pixels. |
## License
[MIT](http://opensource.org/licenses/MIT)
Copyright (c) 2023-present Yunus Emre Kara