Ecosyste.ms: Awesome
An open API service indexing awesome lists of open source software.
https://github.com/bmander/busbuzzard
Inference of probabilistic schedules from empirical data about transit vehicles.
https://github.com/bmander/busbuzzard
Last synced: about 2 months ago
JSON representation
Inference of probabilistic schedules from empirical data about transit vehicles.
- Host: GitHub
- URL: https://github.com/bmander/busbuzzard
- Owner: bmander
- Created: 2013-08-11T19:53:51.000Z (almost 11 years ago)
- Default Branch: master
- Last Pushed: 2013-09-05T21:34:50.000Z (almost 11 years ago)
- Last Synced: 2024-01-11T21:52:58.606Z (6 months ago)
- Language: Python
- Size: 313 KB
- Stars: 9
- Watchers: 2
- Forks: 2
- Open Issues: 0
-
Metadata Files:
- Readme: README.md
Lists
- awesome-transit - Busbuzzard - Inference of probabilistic schedules from empirical data about transit vehicles. (Uncategorized / Uncategorized)
- awesome-stars - bmander/busbuzzard - Inference of probabilistic schedules from empirical data about transit vehicles. (Python)
- awesome-transit - Busbuzzard - Inference of probabilistic schedules from empirical data about transit vehicles. (Uncategorized / Uncategorized)
README
Busbuzzard
==========
Inference of probabilistic schedules from empirical data about transit vehicles.
## Massage GPS data into a set of observed stop_time events
#### Step 0: Get the data
* A CSV of points logged from the NextBus API.
* For example: https://dl.dropboxusercontent.com/u/1158424/route_5.csv.zip
* Try to find someone with a larger data dump, to get a larger data dump.
* An unzipped GTFS that describes the service recorded in the NextBus CSV
* Try http://www.gtfs-data-exchange.com/ for current and past GTFS feeds
#### Step 1: Slice a route out of the NextBus CSV dump
`$ python slice_route.py data/nextbus.csv data/route_27.csv 27`
#### Step 2: Chain NextBus vehicle fixes into strings representing trip instances
`$ python chain.py data/route_27.csv data/route_27_chained.csv`
#### Step 3: Assign NextBus fix chains to GTFS trips
`$ python python match.py data/route_27_chained.csv data/your_gtfs_dir 27 data/route_27_your_gtfs.matches`
#### Step 4: Cache GTFS patterns
`$ python find_gtfs_patterns.py data/your_gtfs_dir data/your_gtfs_patterns.json`
#### Step 5: Compute passbys
`$ python passby.py data/your_gtfs_dir data/your_gtfs_patterns.json data/route_27_chained.csv data/route_27_your_gtfs.matches data/route_27_your_gtfs_passbys.csv`
## Visualize scheduled and observed stop_time events
Run viz_stop.py without stop, pattern, or service_id qualifiers
`python viz_stop.py data/route_5_fallwinter_passbys.csv data/sfmta_fallwinter_2012`
Which complains that it needs a stop_id, but helpfully gives you some options, like:
>Pick a stop. Here are some options:
>stop:3923 count:1386
>stop:3927 count:18021
>stop:4228 count:21447
>stop:4229 count:23270
>stop:4224 count:20978
>stop:4225 count:23290
Pick one and run again with a stop
`python viz_stop.py data/route_5_fallwinter_passbys.csv data/sfmta_fallwinter_2012 4228`
Now it complains that you need a direction, but supplies some, like:
>Pick a direction. Here are some options:
>direction:1 count:21447
Pick one and run again, then it compains that you need a service_id, on account of how a pattern can run on different service_ids
`python viz_stop.py data/route_5_fallwinter_passbys.csv data/sfmta_fallwinter_2012 4228 1`
>Pick a service_id. Here are some options:
>service_id:1 count:15780
>service_id:3 count:2896
>service_id:2 count:2771
Finally select a service_id:
`python viz_stop.py data/route_5_fallwinter_passbys.csv data/sfmta_fallwinter_2012 4228 1 1`
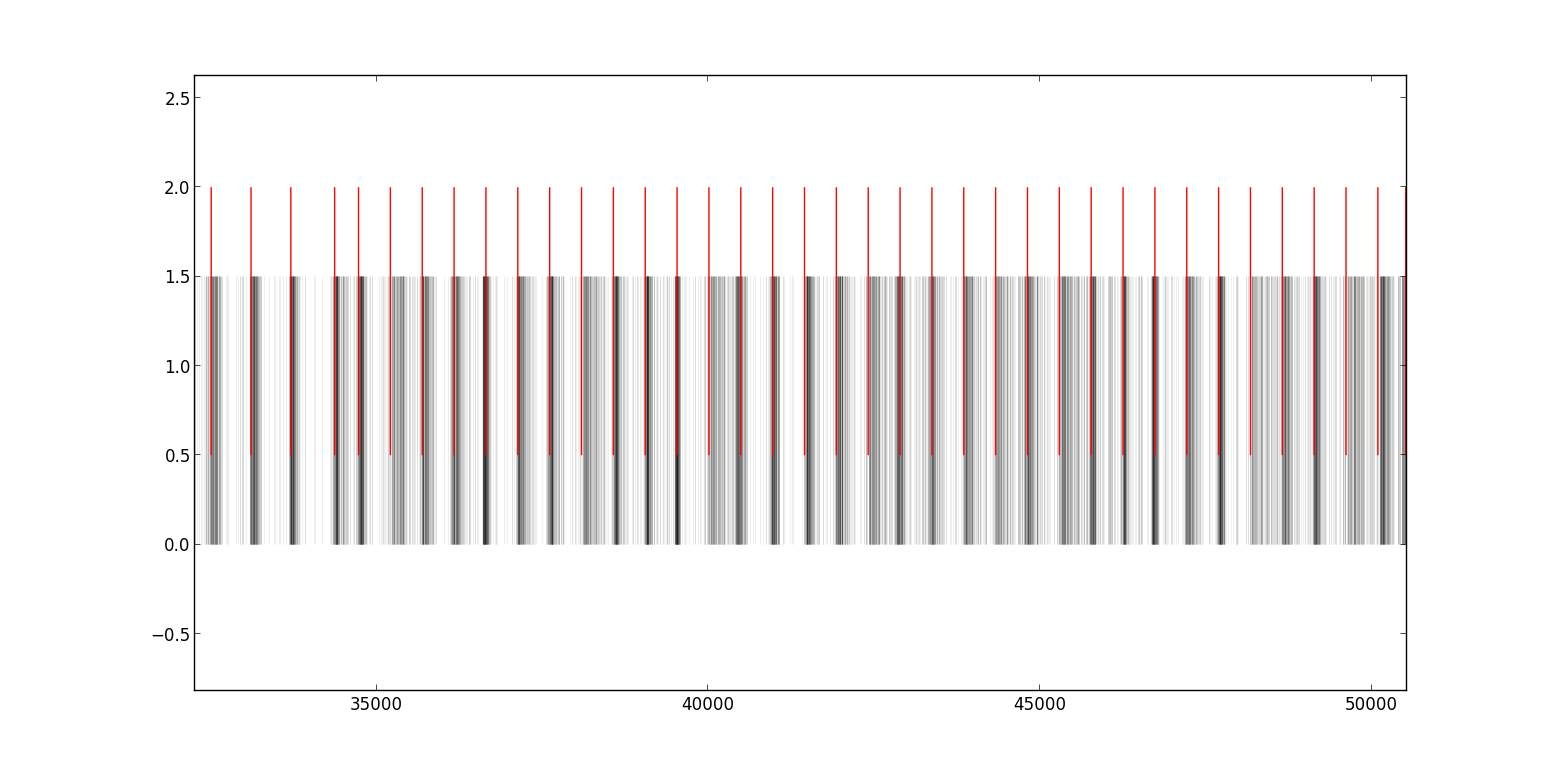
Which brings up a pyplot window illustrating a timeline of every scheduled and observed event at stop 4228, on direction 1, with a service_id of 1.
## Visualize empirical schedule
`python viz_waits.py data/route_5_fallwinter_passbys.csv data/sfmta_fallwinter_2012/ 4228 1 1`
Creates a matplotlib window with contents like:
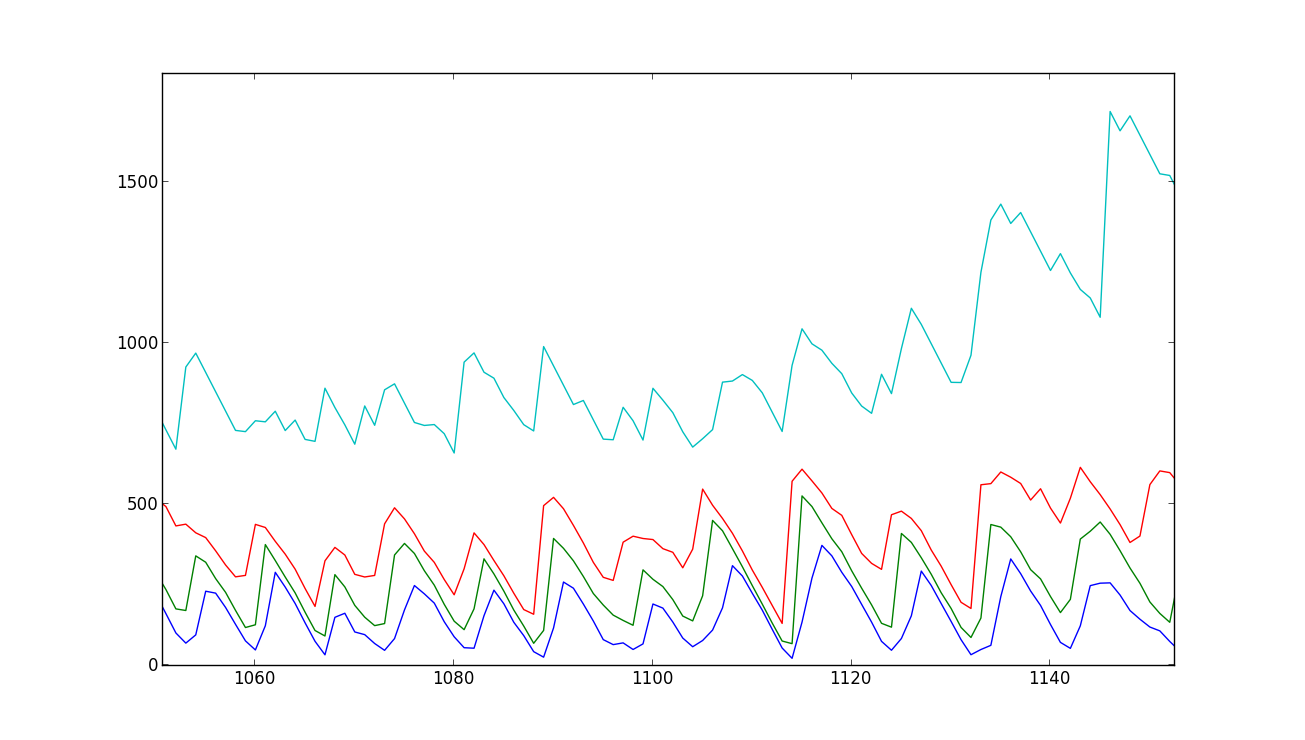
Each line plots the quantile of the time to arrival of the next vehicle. The X axis represents time, in minutes, since midnight. The Y axis is seconds wait. The blue line is the time under which a vehicle arrived 25% of the time. The green line represents the amount of time under which a vehicle arrived half the time. Red, 75%, and teal 95%.