Ecosyste.ms: Awesome
An open API service indexing awesome lists of open source software.
https://github.com/BlinkTagInc/gtfs-to-chart
Generate stringline charts from GTFS transit data
https://github.com/BlinkTagInc/gtfs-to-chart
Last synced: about 2 months ago
JSON representation
Generate stringline charts from GTFS transit data
- Host: GitHub
- URL: https://github.com/BlinkTagInc/gtfs-to-chart
- Owner: BlinkTagInc
- License: mit
- Created: 2020-05-10T06:16:19.000Z (about 4 years ago)
- Default Branch: master
- Last Pushed: 2023-07-18T23:19:39.000Z (12 months ago)
- Last Synced: 2024-01-27T05:12:02.985Z (5 months ago)
- Language: JavaScript
- Size: 874 KB
- Stars: 26
- Watchers: 3
- Forks: 8
- Open Issues: 4
-
Metadata Files:
- Readme: README.md
- Changelog: CHANGELOG.md
- License: LICENSE.md
Lists
- awesome-transit - GTFS-to-Chart - Creates stringline charts showing all vehicles on a transit route from GTFS data. (Uncategorized / Uncategorized)
- awesome-transit - GTFS-to-Chart - Creates stringline charts showing all vehicles on a transit route from GTFS data. (Uncategorized / Uncategorized)
README
➡️
Installation |
Quick Start |
Configuration
⬅️


Generate stringline charts from GTFS transit data.

`gtfs-to-chart` creates stringline charts showing all vehicles on a transit route from GTFS data.
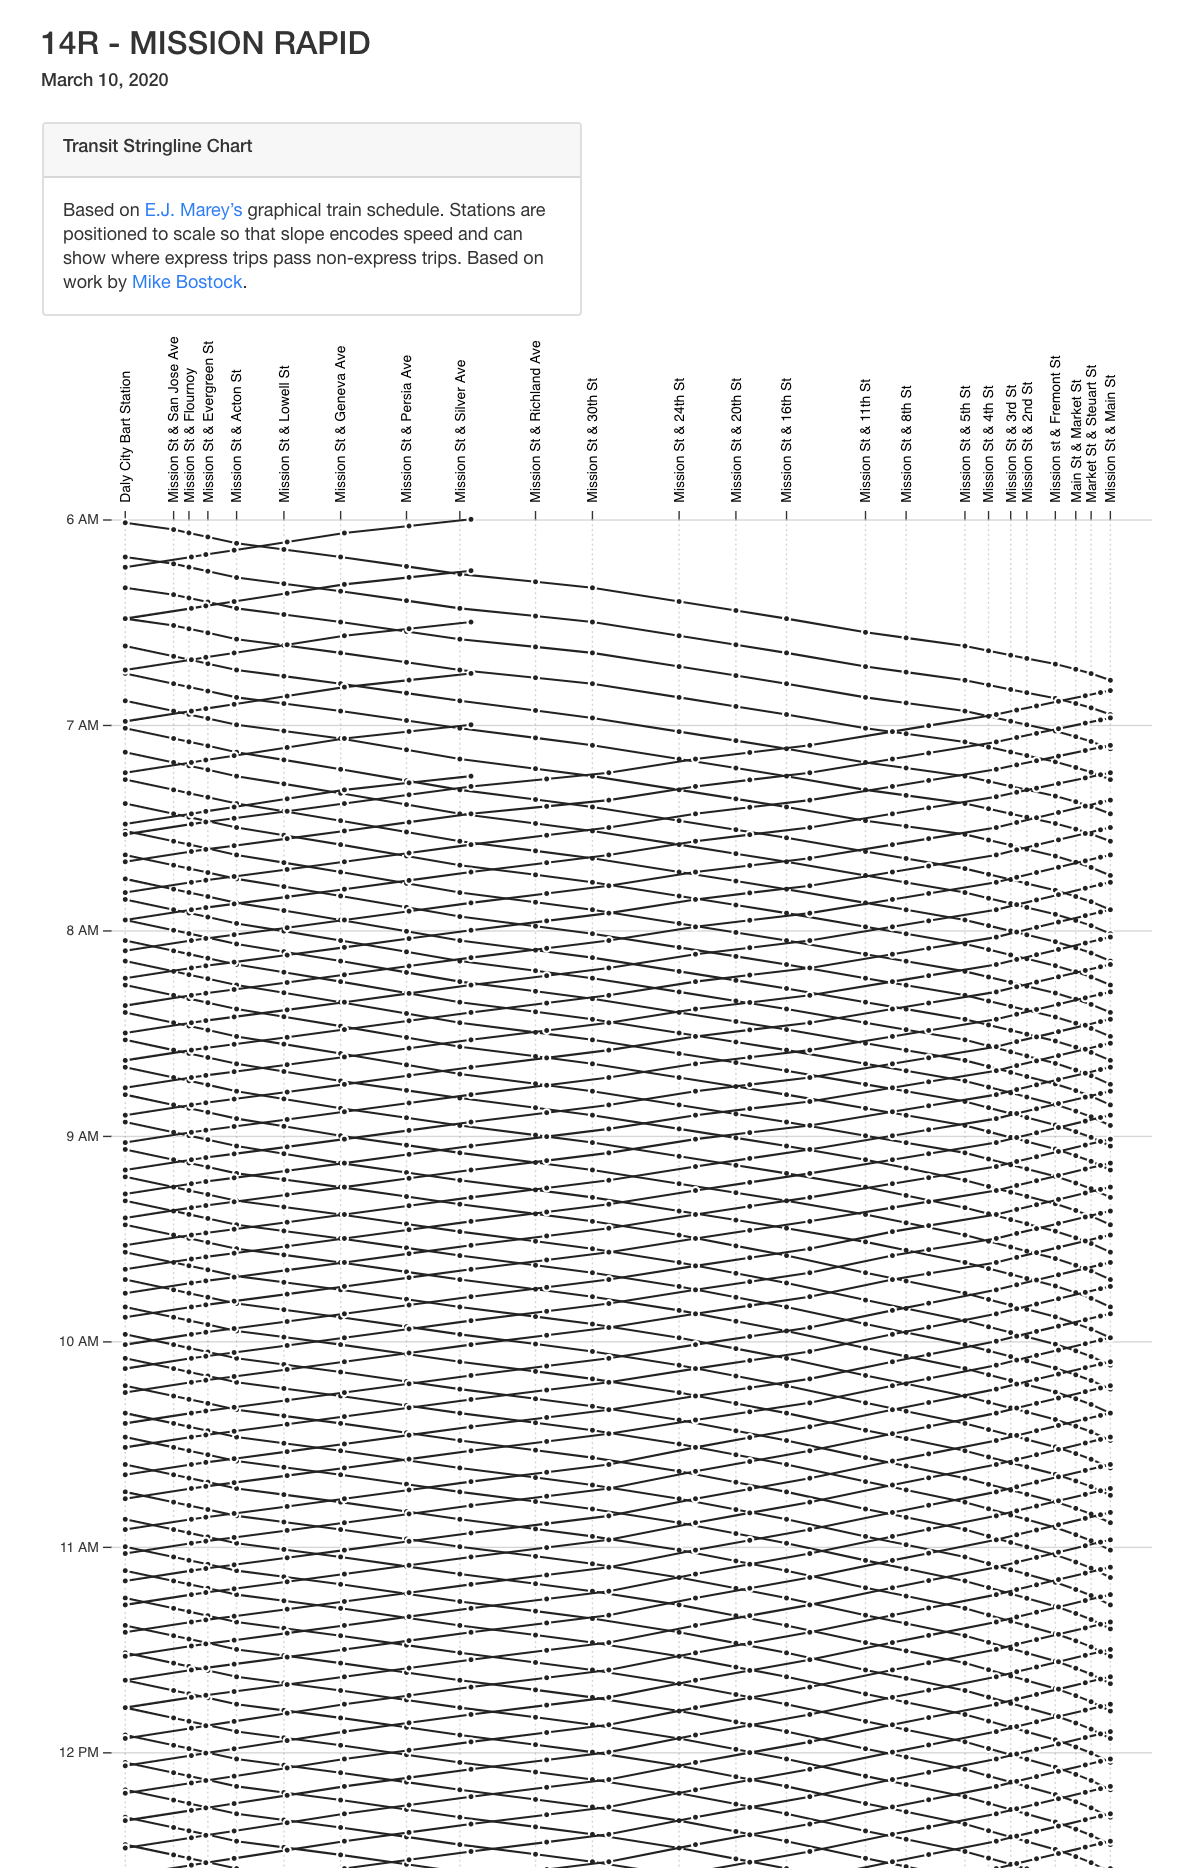
[E.J. Marey](https://en.wikipedia.org/wiki/%C3%89tienne-Jules_Marey) was the first person to propose this type of graphical train schedule.
The chart generated shows stations across the x-axis, spaced to scale. Each line on the chart represents a transit vehicle moving through time. The slope of the line indicates speed at that point in the journey, with steeper slopes indicating slower speeds (as more time is passing as the vehicle moves).
Try out some live interactive charts created with GTFS-to-chart:
* [SFMTA Route 14R Pre-COVID-19](https://gtfs-charts.brendannee.vercel.app/sfmta-2020-03-10/14R.html)
* [SFMTA Route 14R Post-COVID-19](https://gtfs-charts.brendannee.vercel.app/sfmta-2020-07-21/14R.html)
* [SacRT Blue line Pre-COVID-19](https://gtfs-charts.brendannee.vercel.app/sacrt-2020-03-10/Blue.html)
* [SacRT Blue line Post-COVID-19](https://gtfs-charts.brendannee.vercel.app/sacrt-2020-07-21/Blue.html)
For routes that operate in two directions, both are shown on the same chart. Lines sloping downwards are vehicles heading one way and lines sloping upwards are vehicles heading in the reverse direction. The point at which lines cross indicates the exact time and location where two vehicles heading in the opposite direction pass each other.
If express service is offered on a route, the chart will show where express vehicles overtake non-express vehicles. This is shown where two lines sloped in the same direction cross.
If a vehicle has a scheduled stop with a different departure time than arrival time, the line will be vertical for a short distance at the stop representing the dwell time at the stop.
This library can be used to generate stringline charts for any transit agency that provides data in [GTFS format](https://developers.google.com/transit/gtfs/). To generate charts for a specific agency, just add the agency name and URL of the GTFS file in a `config.json` file as described below.
Not all transit routes work well with this type of visualization.
* Routes where not all trips follow the same pattern will not work well. For instance, a bus route that sometimes makes some different stops depending on the trip.
* Routes where one direction follows a different pattern than the other. For instance, a bus route that takes a completely different route on the way back.
* Circular routes do not currently work well, as the line jumps across the chart for the last stop.
Are you using `gtfs-to-chart`? Let us know via email ([email protected]) or via opening a github issue or pull request if your agency is using this library.
## Credits
This library was based off of code developed by [Mike Bostock](https://observablehq.com/@mbostock/mareys-trains).
## Installation
If you would like to use this library as a command-line utility, you can install it globally directly from [npm](https://npmjs.org):
npm install gtfs-to-chart -g
If you are using this as a node module as part of an application, you can include it in your project's `package.json` file.
## Quick Start
### Command-line example
gtfs-to-chart --configPath /path/to/your/custom-config.json
### Code example
```js
import gtfsToChart from 'gtfs-to-chart';
import { readFile } from 'fs/promises';
const config = JSON.parse(await readFile(new URL('./config.json', import.meta.url)));
gtfsToChart(config)
.then(() => {
console.log('Chart Generation Successful');
process.exit();
})
.catch(err => {
console.error(err);
process.exit(1);
});
```
## Configuration
Copy `config-sample.json` to `config.json` and then add your projects configuration to `config.json`. This is a JSON file, so ensure that your config.json is valid JSON.
cp config-sample.json config.json
All files starting with `config*.json` are .gitignored - so you can create multiple configuration files such as `config-caltrain.json`.
| option | type | description |
| ------ | ---- | ----------- |
| [`agencies`](#agencies) | array | An array of GTFS files to be imported. |
| [`beautify`](#beautify) | boolean | Whether or not to beautify the HTML output. |
| [`chartDate`](#chartdate) | string | The date to use for generating the stringline chart. |
| [`templatePath`](#templatepath) | string | Path to custom pug template for rendering chart html. |
### agencies
{Array} Specify the GTFS files to be imported in an `agencies` array. GTFS files can be imported via a `url` or a local `path`.
Each file needs an `agency_key`, a short name you create that is specific to that GTFS file. For GTFS files that contain more than one agency, you only need to list each GTFS file once in the `agencies` array, not once per agency that it contains.
To find an agency's GTFS file, visit [transitfeeds.com](http://transitfeeds.com). You can use the
URL from the agency's website or you can use a URL generated from the transitfeeds.com
API along with your API token.
* Specify a download URL:
```json
{
"agencies": [
{
"agency_key": "county-connection",
"url": "http://cccta.org/GTFS/google_transit.zip"
}
]
}
```
* Specify a path to a zipped GTFS file:
```json
{
"agencies": [
{
"agency_key": "myAgency",
"path": "/path/to/the/gtfs.zip"
}
]
}
```
* Specify a path to an unzipped GTFS file:
```json
{
"agencies": [
{
"agency_key": "myAgency",
"path": "/path/to/the/unzipped/gtfs/"
}
]
}
```
* Exclude files - if you don't want all GTFS files to be imported, you can specify an array of files to exclude.
```json
{
"agencies": [
{
"agency_key": "myAgency",
"path": "/path/to/the/unzipped/gtfs/",
"exclude": [
"shapes",
"stops"
]
}
]
}
```
### beautify
{Boolean} Whether or not to beautify the HTML output. Defaults to `false`.
```json
"beautify": false
```
### chartDate
{String} The date to use for generating charts in YYYYMMDD format. Charts will be for service on this date. Defaults to today's date.
```json
"chartDate": "20200505"
```
### templatePath
{String} Path to a folder containing (pug)[https://pugjs.org/] template for rendering charts. This is optional. Defaults to using the templates provided in `views/chart`. All files within the `/views/custom` folder will be .gitignored, so you can copy the `views/chart` folder to `views/custom/myagency` and make any modifications needed. Any custom views folder should conatain pug templates called `chart_page.pug` and `overview_page.pug`.
```json
"templatePath": "views/custom/my-agency/"
```
## Running
To generate charts, run `gtfs-to-chart`.
gtfs-to-chart
By default, `gtfs-to-chart` will look for a `config.json` file in the project root. To specify a different path for the configuration file:
gtfs-to-chart --configPath /path/to/your/custom-config.json
This will download the GTFS file specified in `config.js` . Then, `gtfs-to-chart` will build the HTML charts and save them in `charts/:agency_key`.
### Options
`configPath`
Allows specifying a configuration json file. Defaults to config.json in the current directory.
gtfs-to-chart --configPath /path/to/your/custom-config.json
`skipImport`
Skips importing GTFS into SQLite. Useful if you are rerunning with an unchanged GTFS file. If you use this option and the GTFS file hasn't been imported, you'll get an error.
gtfs-to-chart --skipImport
## Processing very large GTFS files.
By default, node has a memory limit of 512 MB or 1 GB. Use the `max-old-space-size` option. For example to allocate 2 GB:
node --max-old-space-size=2000 /usr/local/bin/gtfs-to-chart
## Contributing
Pull requests are welcome, as is feedback and [reporting issues](https://github.com/blinktaginc/gtfs-to-chart/issues).
### Tests
npm test