Ecosyste.ms: Awesome
An open API service indexing awesome lists of open source software.
https://github.com/aymenhafeez/animplotlib
A thin wrapper around the matplotlib FuncAnimation class.
https://github.com/aymenhafeez/animplotlib
animation matplotlib python
Last synced: about 1 month ago
JSON representation
A thin wrapper around the matplotlib FuncAnimation class.
- Host: GitHub
- URL: https://github.com/aymenhafeez/animplotlib
- Owner: aymenhafeez
- License: mit
- Created: 2019-12-04T19:48:31.000Z (over 4 years ago)
- Default Branch: master
- Last Pushed: 2023-11-04T11:09:38.000Z (8 months ago)
- Last Synced: 2024-05-10T22:44:28.500Z (about 1 month ago)
- Topics: animation, matplotlib, python
- Language: Python
- Homepage:
- Size: 39.9 MB
- Stars: 2
- Watchers: 2
- Forks: 1
- Open Issues: 0
-
Metadata Files:
- Readme: README.md
- License: LICENSE
Lists
- awesome-stars - animplotlib - A thin wrapper around the matplotlib FuncAnimation class. (Python)
README
# animplotlib
This package acts as a thin wrapper around the
`matplotlib.animation.FuncAnimation` class to simplify animating `matplotlib`
plots.

## Installation
```
pip install animplotlib
```
## User manual
There are two classes which can be called: `AnimPlot`, for 2-D plots,
and `AnimPlot3D`, for 3-D plots.
### AnimPlot
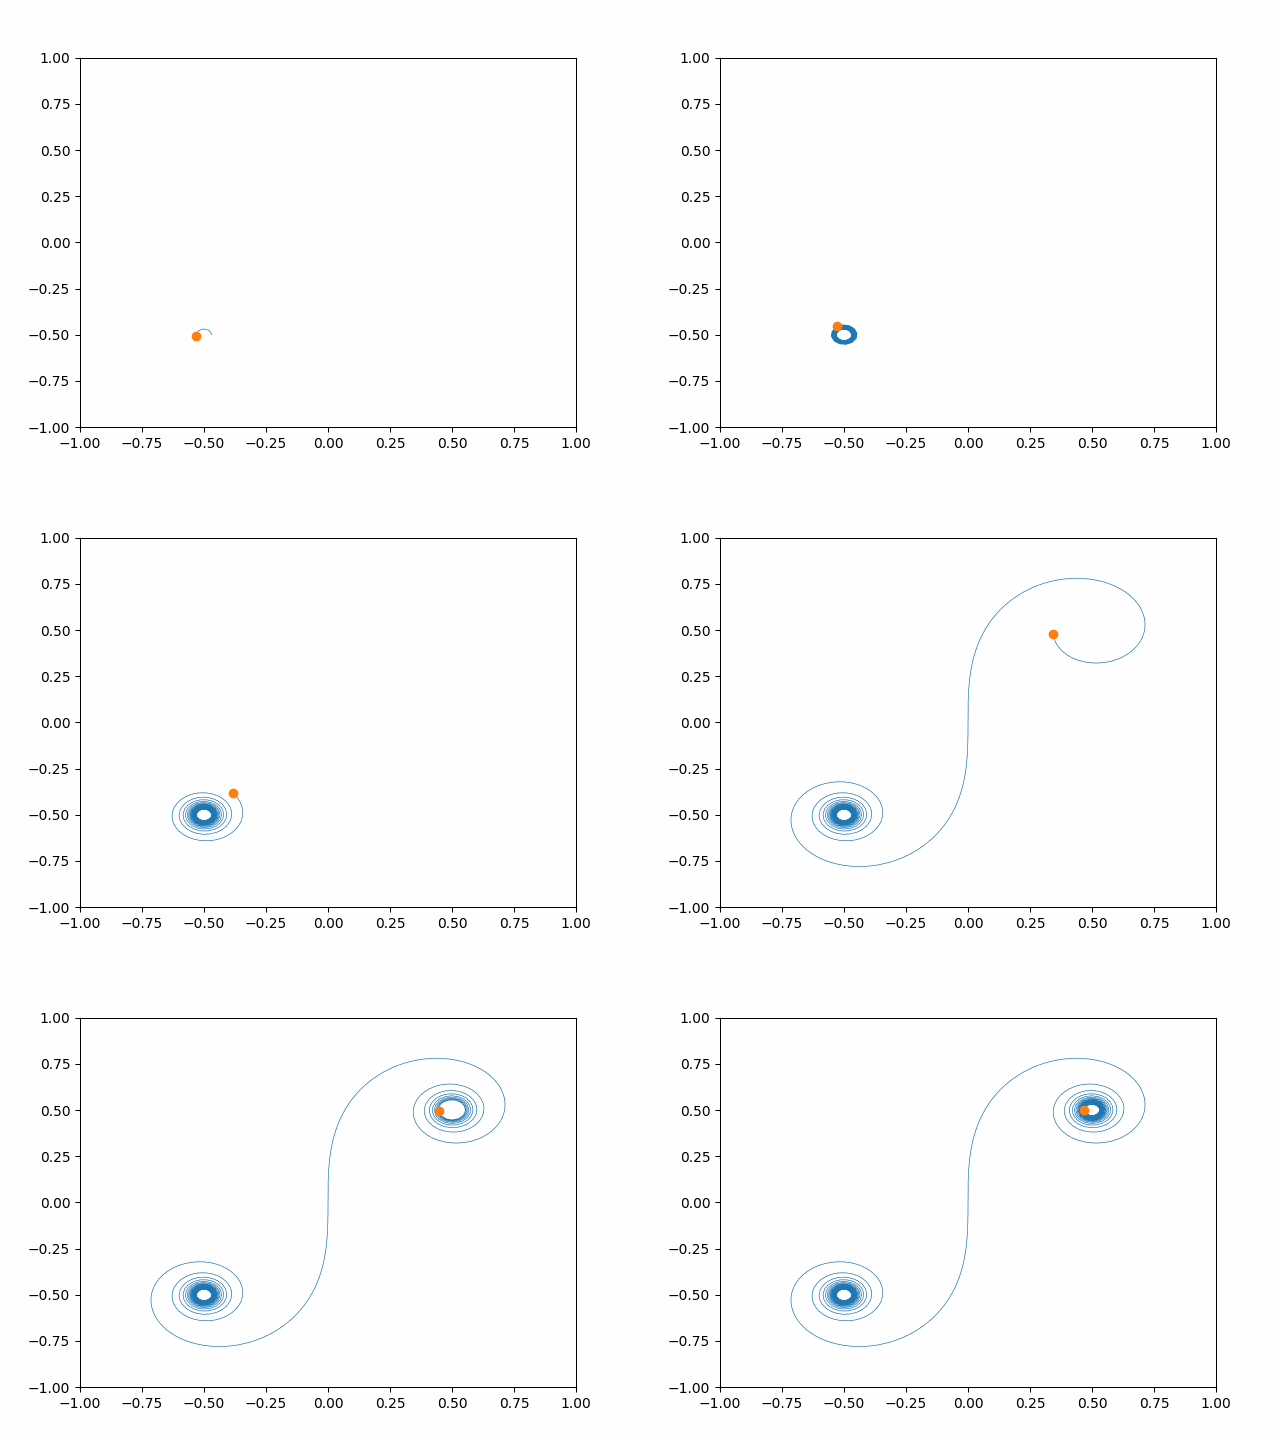
As an example, below is a demonstration of the steps required to make a
basic plot of an Euler spiral. An Euler spiral can be obtained by plotting
the [Fresnel integrals](https://en.wikipedia.org/wiki/Fresnel_integral),
which can be generated using `scipy.special`.
Import the necessary libraries and create a `matplotlib` figure and axes:
```python
import animplotlib as anim
import numpy as np
import matplotlib.pyplot as plt
import scipy.special as sc
fig = plt.figure()
ax = fig.add_subplot(111)
```
Generate the points being plotted:
```python
x = np.linspace(-10, 10, 2500)
y, z = sc.fresnel(x)
```
Create two empty `matplotlib` plots: one to plot the points up to the current
most point (i.e. the 'line') and one to plot the current most point:
```python
line, = ax.plot([], [], lw=1)
point, = ax.plot([], [], 'o')
ax.set_xlim(-1, 1)
ax.set_ylim(-1, 1)
```
Call the `AnimPlot` class and show the plot:
```python
animation = anim.AnimPlot(fig, line, point, y, z, l_num=len(x),
plot_speed=5)
plt.show()
```
`l_num` is the number of points before the current most point being plotted to
`line`. The default value is set to 10, however in this example it makes sense
to set it to the same length as `x` (i.e. all the points before the current most
point are plotted). Similarly, an argument `p_num` can be passed to determine
the number of points being plotted to `point`. This is set to 1 by default.
Optional arguments:
* `plot_speed` (`int`) : set to 10 by default.
* `l_num` (`int`) : The number of points being plotted to `line` each frame. By
default this is set to 10.
* `p_num` (`int`) : The number of points being plotted to `point` each frame. By
default, this is set to 1, i.e. only the current most point is plotted each
frame (the orange point in the gif).
* `save_as` (`str`) : file name to save the animation as a gif in the
current working directory.
* `**kwargs` : other arguments passable into
`matplotlib.animation.FuncAnimation` (see [the docs](https://matplotlib.org/3.1.0/api/_as_gen/matplotlib.animation.FuncAnimation.html) for more info).

### AnimPlot3D
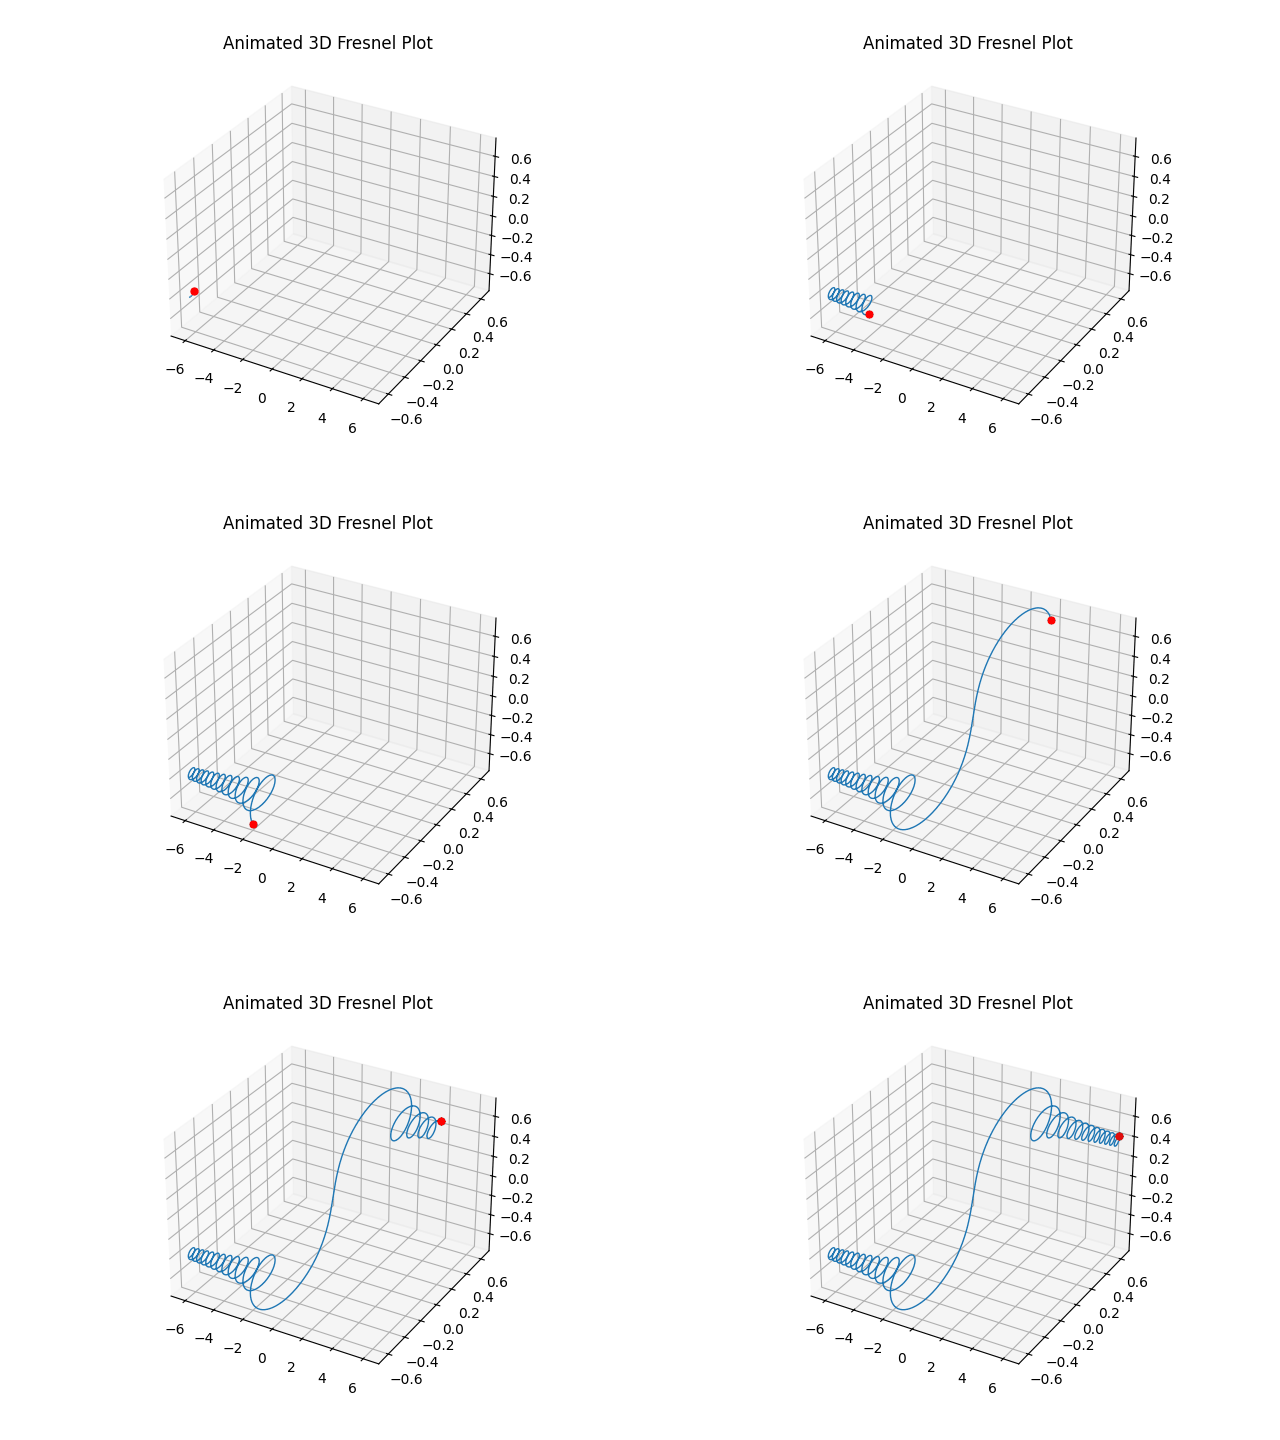
Creating a 3-D animated plot is similar to creating a 2-D plot but with a
few additional steps.
```python
import animplotlib as anim
import numpy as np
import matplotlib.pyplot as plt
import scipy.special as sc
fig = plt.figure()
ax = fig.add_subplot(111, projection='3d')
x = np.linspace(-10, 10, 3000)
y, z = sc.fresnel(x)
```
For 3-D plots, two empty `matplotlib` plots must be created:
```python
lines, = [ax.plot([], [], [])]
points, = [ax.plot([], [], [], 'o')]
```
The second plot, `points`, by default plots the 'ith' point each frame. After
that set the x, y and z limits and call the `AnimPlot3D` class.
```python
ax.set_xlim(-10, 10)
ax.set_ylim(-1, 1)
ax.set_zlim(-1, 1)
animation = anim.AnimPlot3D(fig, ax, [lines], [points], x, y, z, plot_speed=5)
plt.show()
```

Optional arguments:
* `plot_speed` (`int`) : set to 10 by default.
* `rotation_speed` (`int`) : proportional to `plot_speed`. Off by default,
enabled by setting a value.
* `l_num` (`int`) : The number of points being plotted to `lines` each frame. By
default, all the points up until the current point get plotted.
* `p_num` (`int`) : The number of points being plotted to `points` each frame. By
default, this is set to 1, i.e. only the current most point is plotted each
frame (the orange point in the gif).
* `save_as` (`str`) : file name to save the animation as a gif in the
current working directory.
* `**kwargs` : other arguments passable into
`matplotlib.animation.FuncAnimation` (see [the
docs](https://matplotlib.org/3.1.0/api/_as_gen/matplotlib.animation.FuncAnimation.html)
for more info).
Both the 2-D and 3-D plots can be customised visually the same way you would
a normal `matplotlib` plot.