Ecosyste.ms: Awesome
An open API service indexing awesome lists of open source software.
https://github.com/gpbl/SwiftChart
Line and area chart library for iOS
https://github.com/gpbl/SwiftChart
area-chart chart charting-library ios ios-lib line-charts swift
Last synced: about 2 months ago
JSON representation
Line and area chart library for iOS
- Host: GitHub
- URL: https://github.com/gpbl/SwiftChart
- Owner: gpbl
- License: mit
- Created: 2014-11-06T22:57:27.000Z (over 9 years ago)
- Default Branch: master
- Last Pushed: 2022-04-24T12:10:41.000Z (about 2 years ago)
- Last Synced: 2024-02-26T14:47:50.408Z (4 months ago)
- Topics: area-chart, chart, charting-library, ios, ios-lib, line-charts, swift
- Language: Swift
- Homepage:
- Size: 268 KB
- Stars: 1,041
- Watchers: 23
- Forks: 161
- Open Issues: 45
-
Metadata Files:
- Readme: README.md
- Changelog: CHANGELOG.md
- License: LICENSE.txt
- Code of conduct: CODE_OF_CONDUCT.md
Lists
- awesome-ios - SwiftChart - Line and area chart library for iOS. (Charts)
- awesome-swift - SwiftChart - A simple line and area charting library for iOS. Supports multiple series, partially filled series and touch events. (Libs / Chart)
- awesome-swift - SwiftChart - A simple line and area charting library for iOS. Supports multiple series, partially filled series and touch events. (Libs / Chart)
- awesome-swifte - SwiftChart - A simple line and area charting library for iOS. Supports multiple series, partially filled series and touch events. (Libs / Chart)
- awesome-swifty - SwiftChart - A simple line and area charting library for iOS. Supports multiple series, partially filled series and touch events. (Libs / Chart)
- awesome-swift4 - SwiftChart - A simple line and area charting library for iOS. Supports multiple series, partially filled series and touch events. (Libs / Chart)
- awesome-ios2 - SwiftChart - Line and area chart library for iOS. (Charts / Other free courses)
- fucking-awesome-swift - SwiftChart - A simple line and area charting library for iOS. Supports multiple series, partially filled series and touch events. (Libs / Chart)
- awesome-ios - SwiftChart - Line and area chart library for iOS. (Charts / Other free courses)
- awesome-ios-star - SwiftChart - Line and area chart library for iOS. (Charts)
- awesome-swiftxx - SwiftChart - A simple line and area charting library for iOS. Supports multiple series, partially filled series and touch events. (Libs / Chart)
- awesome-ios - SwiftChart - Line and area chart library for iOS. (Charts / Getting Started)
- awesome-ios - SwiftChart - Line and area chart library for iOS. (Charts / Other free courses)
- awesome-swiftqq - SwiftChart - A simple line and area charting library for iOS. Supports multiple series, partially filled series and touch events. (Libs / Chart)
- awesome-swift - SwiftChart - A simple line and area charting library for iOS. Supports multiple series, partially filled series and touch events. (Libs / Chart)
- awesome-ios - SwiftChart - Line and area chart library for iOS. (Charts / Getting Started)
- awesome-stars - gpbl/SwiftChart - Line and area chart library for iOS (Swift)
- awesome-iosx - SwiftChart - Line and area chart library for iOS. (Charts)
- awesome-ios - SwiftChart - Line and area chart library for iOS. (Charts / Getting Started)
- awesome-iosr - SwiftChart - Line and area chart library for iOS. (Charts)
- learn.awesome.ios - SwiftChart - Line and area chart library for iOS. (Charts / Getting Started)
- awesome-ios - SwiftChart - Line and area chart library for iOS. (Charts / Getting Started)
- awesome-swift - SwiftChart - Line and area chart library for iOS ` 📝 3 years ago ` (Chart [🔝](#readme))
README
SwiftChart
===========
[](http://cocoapods.org/pods/SwiftChart)
[](http://cocoapods.org/pods/SwiftChart)
[](http://cocoapods.org/pods/SwiftChart)
A simple line and area charting library for iOS.
* 📈 Line and area charts
* 🌞 Multiple series
* 🌒 Partially filled series
* 🏊 Works with signed `Double`
* 🖖 Touch events


---
Table of Content
- [Getting started](#getting-started)
- [Installing SwiftChart via CocoaPods](#installing-swiftchart-via-cocoapods)
- [Installing SwiftChart manually](#installing-swiftchart-manually)
- [What’s included in SwiftChart](#whats-included-in-swiftchart)
- [How to use SwiftChart](#how-to-use-swiftchart)
- [Initialize a chart from the Interface Builder](#initialize-a-chart-from-the-interface-builder)
- [Initialize a chart programmatically](#initialize-a-chart-programmatically)
- [Adding a series to a chart](#adding-a-series-to-a-chart)
- [Using partially filled series](#using-partially-filled-series)
- [Using different colors above and below zero](#using-different-colors-above-and-below-zero)
- [Adding multiple series to a chart](#adding-multiple-series-to-a-chart)
- [Configuring touch events](#configuring-touch-events)
- [API](#api)
- [`Chart` class](#chart-class)
- [Chart options](#chart-options)
- [Public Methods](#public-methods)
- [`ChartSeries` class](#chartseries-class)
- [`ChartDelegate` protocol](#chartdelegate-protocol)
- [`ChartColors` enum](#chartcolors-enum)
- [`ChartPoint` typealias](#chartpoint-typealias)
- [`ChartLabelOrientation` enum](#chartlabelorientation-enum)
- [Common issues and solutions](#common-issues-and-solutions)
- [The chart is not showing](#the-chart-is-not-showing)
- [License](#license)
# Getting started
## Installing SwiftChart via CocoaPods
SwiftChart is available through [CocoaPods](http://cocoapods.org). To install
it, simply add the following line to your Podfile:
```ruby
pod "SwiftChart"
```
## Installing SwiftChart manually
1. Download **SwiftChart.zip** from the [last release](https://github.com/gpbl/SwiftChart/releases/latest) and extract its content in your project's folder.
2. From the Xcode project, choose *Add Files to ...* from the *File* menu and add the extracted files.
## What’s included in SwiftChart
The library includes:
- the [Chart](Source/Chart.swift#L40) main class, to initialize and configure the chart’s content, e.g. for adding series or setting up the its appearance
- the [ChartSeries](Source/ChartSeries.swift) class, for creating datasets and configure their appearance
- the [ChartDelegate](Source/Chart.swift#L10-L32) protocol, which tells other objects about the chart’s touch events
- the [ChartColor](Source/ChartColors.swift) struct, containing some predefined colors
**Example**
```swift
let chart = Chart()
let series = ChartSeries([0, 6, 2, 8, 4, 7, 3, 10, 8])
series.color = ChartColors.greenColor()
chart.add(series)
```
To run the example project, clone the repo, and run `pod install` from the Example directory first.
# How to use SwiftChart
## Initialize a chart from the Interface Builder
The chart can be initialized from the Interface Builder. Drag a normal View into a View Controller and assign to it the `Chart` Custom Class from the Identity Inspector.
## Initialize a chart programmatically
To initialize a chart programmatically, use the `Chart(frame: ...)` initializer, which requires a `frame`:
```swift
let chart = Chart(frame: CGRect(x: 0, y: 0, width: 200, height: 100))
```
If you prefer to use Autolayout, set the frame to `0` and add the constraints later:
```swift
let chart = Chart(frame: CGRectZero)
// add constraints now
```
## Adding a series to a chart
Initialize each series before adding them to the chart. To do so, pass an array to initialize a `ChartSeries` object:
```swift
let chart = Chart(frame: CGRect(x: 0, y: 0, width: 200, height: 100))
let series = ChartSeries([0, 6.5, 2, 8, 4.1, 7, -3.1, 10, 8])
chart.add(series)
```
**Result:**
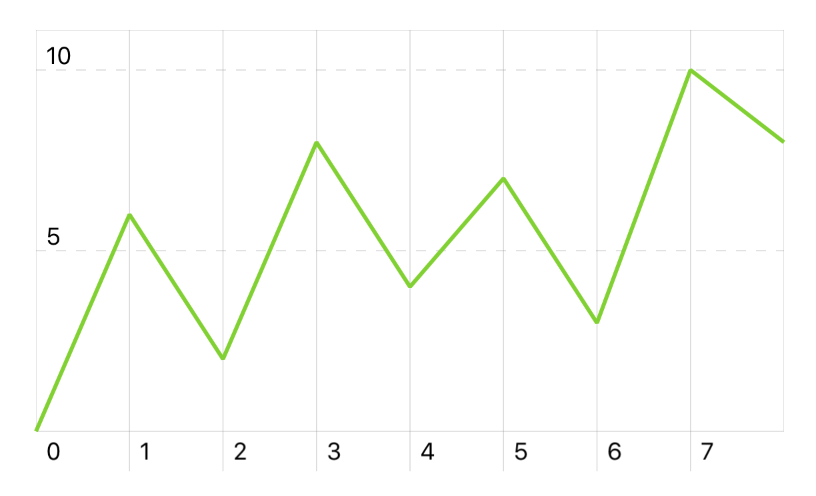
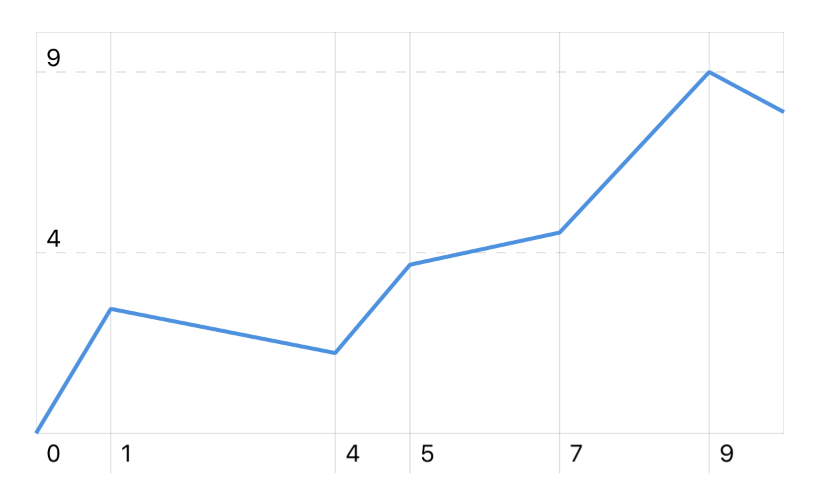
As you can see, as default the values on the x-axis are the progressive indexes of the passed array. You can customize those values by passing an array of `(x: Double, y: Double)` tuples to the series initializer:
```swift
let chart = Chart(frame: CGRect(x: 0, y: 0, width: 200, height: 100))
// Create a new series specifying x and y values
let data = [
(x: 0, y: 0),
(x: 1, y: 3.1),
(x: 4, y: 2),
(x: 5, y: 4.2),
(x: 7, y: 5),
(x: 9, y: 9),
(x: 10, y: 8)
]
let series = ChartSeries(data: data)
chart.add(series)
```
**Result:**
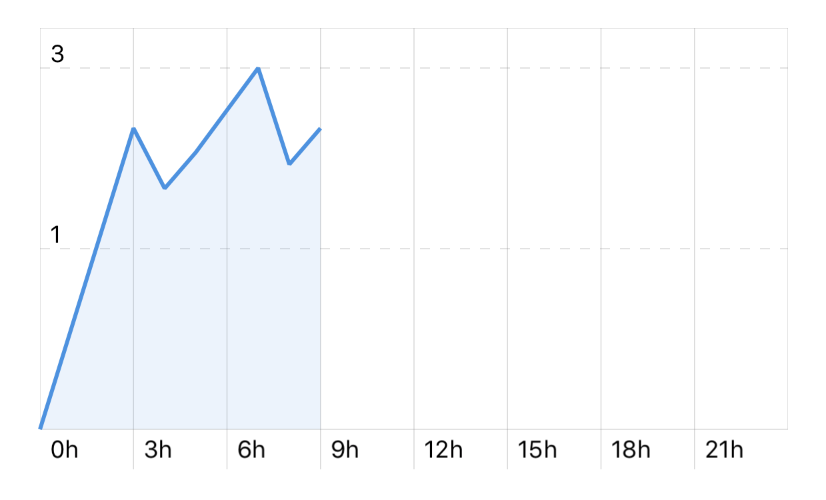
## Using partially filled series
Use the `chart.xLabels` property to make the x-axis showing more labels than those inferred from the actual data. For example,
```swift
let chart = Chart(frame: CGRect(x: 0, y: 0, width: 200, height: 100))
let data = [
(x: 0, y: 0),
(x: 3, y: 2.5),
(x: 4, y: 2),
(x: 5, y: 2.3),
(x: 7, y: 3),
(x: 8, y: 2.2),
(x: 9, y: 2.5)
]
let series = ChartSeries(data: data)
series.area = true
// Use `xLabels` to add more labels, even if empty
chart.xLabels = [0, 3, 6, 9, 12, 15, 18, 21, 24]
// Format the labels with a unit
chart.xLabelsFormatter = { String(Int(round($1))) + "h" }
chart.add(series)
```
**Result:**
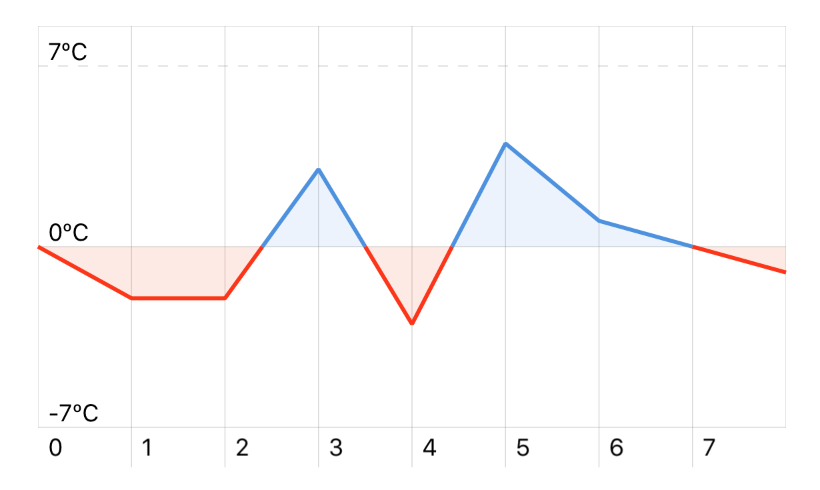
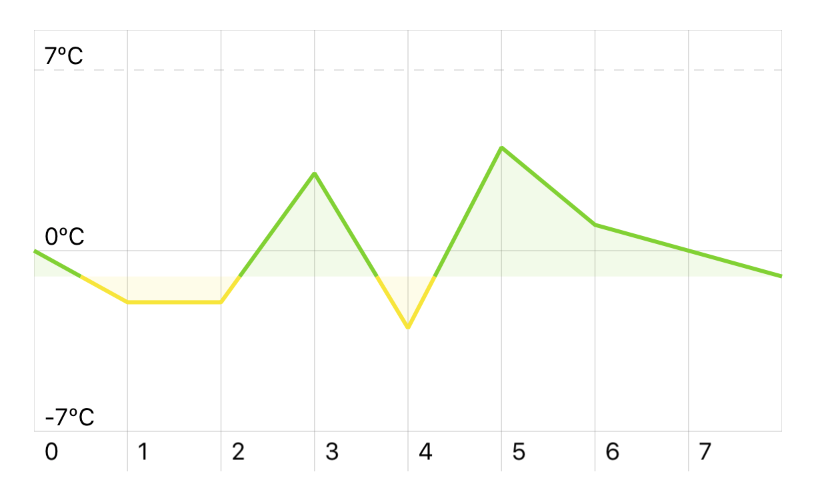
## Using different colors above and below zero
The chart displays the series in different colors when below or above the zero-axis:
```swift
let chart = Chart(frame: CGRect(x: 0, y: 0, width: 200, height: 100))
let data: [Double] = [0, -2, -2, 3, -3, 4, 1, 0, -1]
let series = ChartSeries(data)
series.area = true
chart.add(series)
// Set minimum and maximum values for y-axis
chart.minY = -7
chart.maxY = 7
// Format y-axis, e.g. with units
chart.yLabelsFormatter = { String(Int($1)) + "ºC" }
```
**Result:**
You can customize the zero-axis and the colors with the `colors` options in the `ChartSeries` class.
```swift
series.colors = (
above: ChartColors.greenColor(),
below: ChartColors.yellowColor(),
zeroLevel: -1
)
```
**Result:**
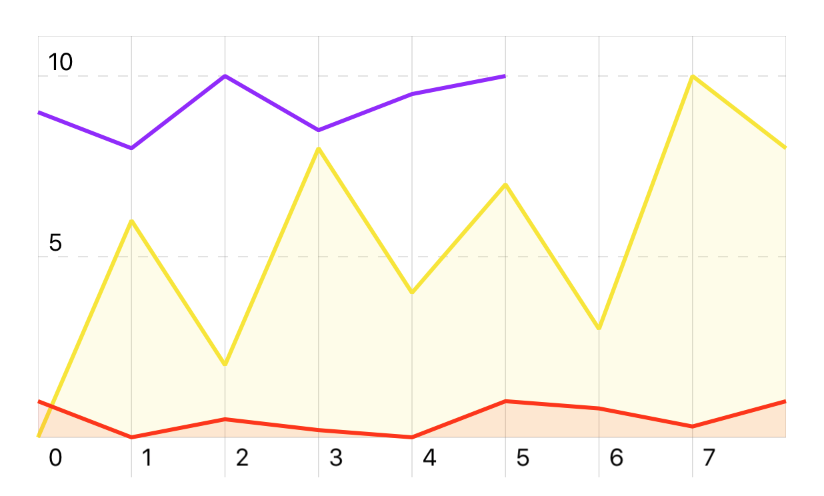
## Adding multiple series to a chart
Using the `chart.add(series: ChartSeries)` and `chart.add(series: Array)` methods you can add more series. Those will be indentified with a progressive index in the chart’s `series` property.
```swift
let chart = Chart(frame: CGRect(x: 0, y: 0, width: 200, height: 100))
let series1 = ChartSeries([0, 6, 2, 8, 4, 7, 3, 10, 8])
series1.color = ChartColors.yellowColor()
series1.area = true
let series2 = ChartSeries([1, 0, 0.5, 0.2, 0, 1, 0.8, 0.3, 1])
series2.color = ChartColors.redColor()
series2.area = true
// A partially filled series
let series3 = ChartSeries([9, 8, 10, 8.5, 9.5, 10])
series3.color = ChartColors.purpleColor()
chart.add([series1, series2, series3])
```
**Result:**
## Configuring touch events
To make the chart respond to touch events, implement the `ChartDelegate` protocol in your class, e.g. a View Controller, and then set the chart’s `delegate` property:
```swift
class MyViewController: UIViewController, ChartDelegate {
override func viewDidLoad() {
let chart = Chart(frame: CGRect(x: 0, y: 0, width: 100, height: 200))
chart.delegate = self
}
// Chart delegate
func didTouchChart(chart: Chart, indexes: Array, x: Double, left: CGFloat) {
// Do something on touch
}
func didFinishTouchingChart(chart: Chart) {
// Do something when finished
}
func didEndTouchingChart(chart: Chart) {
// Do something when ending touching chart
}
}
```
The `didTouchChart` method passes an array of indexes, one for each series, with an optional `Int` referring to the data’s index:
```swift
func didTouchChart(chart: Chart, indexes: Array, x: Double, left: CGFloat) {
for (seriesIndex, dataIndex) in enumerate(indexes) {
if dataIndex != nil {
// The series at `seriesIndex` is that which has been touched
let value = chart.valueForSeries(seriesIndex, atIndex: dataIndex)
}
}
}
```
You can use `chart.valueForSeries()` to access the value for the touched position.
The `x: Double` argument refers to the value on the x-axis: it is inferred from the horizontal position of the touch event, and may be not part of the series values.
The `left: CGFloat` is the x position on the chart’s view, starting from the left side. It may be used to set the position for a label moving above the chart:
# API
## `Chart` class
Use the `Chart` class to initialize and configure the chart’s content, e.g. for adding series or setting up the its appearance.
**Example**
```swift
let chart = Chart(frame: CGRect(x: 0, y: 0, width: 200, height: 100))
```
### Chart options
| Option Name | Description |
|-------------------------------|-------------------------------------------------------------------------------------------------------------------------------------------------------------------------------------------------------------|
| `areaAlphaComponent` | Alpha factor for the areas colors (`CGFloat`, default `0.1`) |
| `axesColor` | The color of the axes (`UIColor`, default `.gray`) |
| `bottomInset` | Height of the area at the bottom of the chart, containing the labels for the x-axis (`CGFloat`, default `20`) |
| `delegate` | The delegate to listen to touch events (`ChartDelegate`) |
| `highlightLineColor` | The color of the highlight line (`UIColor`, default `gray`) |
| `highlightLineWidth` | The width of the highlight line (`CGFloat`, default `0.5`) |
| `hideHighlightLineOnTouchEnd` | Hide the highlight line when the touch event ends, e.g. when stop swiping over the chart (`Bool`, default `false`) |
| `gridColor` | The color of the grid (`UIColor`, default `.gray`) |
| `labelColor` | The color of the labels (`UIColor`, default `.black`) |
| `labelFont` | The font used for the labels (`UIFont?`) |
| `lineWidth` | The width of the chart's lines (`CGFloat`, default `2`) |
| `maxX` | A custom maximum x-value (`Double?`) |
| `maxY` | A custom maximum y-value (`Double?`) |
| `minX` | A custom minimum x-value (`Double?`) |
| `minY` | A custom minimum y-value (`Double?`) |
| `showXLabelsAndGrid` | Enable the lines for the labels on the x-axis (`Bool`, default `true`) |
| `showYLabelsAndGrid` | Enable the lines for the labels on the y-axis (`Bool`, default `true`) |
| `topInset` | Height of the area at the top of the chart, acting a padding to make place for the top y-axis label (`CGFloat`, default `20`) |
| `xLabels` | The values to display as labels on the x-axis. You can format these values with the `xLabelFormatter` attribute. As default, it will display the values of the series which has the most data. `[Double]?` |
| `xLabelsFormatter` | Function to format the labels on the x-axis (`(Int, Double) -> String`) |
| `xLabelsOrientation:` | Set the x-axis labels orientation to `vertical` or `horizontal` (`ChartLabelOrientation`, default `.horizontal`) |
| `xLabelsTextAlignment:` | Alignment for the text in the x-labels (`NSTextAlignment`, default `.left`) |
| `xLabelsSkipLast:` | Skip the last x-label. Setting this to `false` will make the label overflow the frame width, so use carefully (`Bool`, default `true`) |
| `yLabels` | Values to display as labels of the y-axis. If not specified, will display the lowest, the middle and the highest values. |
| `yLabelsFormatter` | Function to format the labels on the y-axis (`(Int, Double) -> String`) |
| `yLabelsOnRightSide` | Place the y-labels on the right side (`Bool`, default `false`) |
### Public Methods
| Method Name | Description |
|-------------------|--------------------------------------------------------------------------------------------------------------------------|
| `add` | Add a series to the chart `(_ series: ChartSeries)` `(_ series: [ChartSeries])` |
| `removeSeriesAt` | Remove the series at the specified index `(_ index: Int)` |
| `removeAllSeries` | Remove all the series |
| `valueForSeries` | Returns the value for the specified series at the given index `(_ seriesIndex: Int, atIndex dataIndex: Int?) -> Double?` |
## `ChartSeries` class
Use the `ChartSeries` class to create a chart series and configure its appearance and behavior.
**Example**
```swift
let data: [Double] = [0, -2, -2, 3, -3, 4, 1, 0, -1]
let series = ChartSeries(data)
```
| Option Name | Description |
|-------------|----------------------------------------------------------------------------------------------------------------------------------------------------|
| `area` | Draws an area below the series line (`Bool`, default `false`) |
| `line` | When set to `false`, will hide the series line. Useful for drawing only the area with `area=true` (`Bool`, default `true`) |
| `color` | The series color. You can use the `ChartColors` struct for some colors shortcuts. (`UIColor`, default `.blueColor()`) |
| `colors` | A tuple to specify the color above or below the zero (or the value specified by `zeroLevel`) `(above: UIColor, below: UIColor, zeroLevel: Double)` |
## `ChartDelegate` protocol
Use the `ChartDelegate` protocol to tell other objects about the chart’s touch events.
| Method | Description |
|--------------------------|--------------------------------------------------------------------------------------------------------------------------------------------------------|
| `didTouchChart` | Tells the delegate that the specified chart has been touched |
| `didFinishTouchingChart` | Tells the delegate that the user finished touching the chart. The user will "finish" touching the chart only swiping left/right outside the chart. |
| `didEndTouchingChart` | Tells the delegate that the user ended touching the chart. The user will "end" touching the chart whenever the `touchesDidEnd` method is being called. |
## `ChartColors` enum
Shorthands for various colors.
**Example**
```swift
let series = ChartSeries([0, 6, 2, 8, 4, 7, 3, 10, 8])
series.color = ChartColors.blueColor()
```
# Common issues and solutions
If you have issue with this library, please tag your question with `swiftchart` on [Stack Overflow](http://stackoverflow.com/tags/swiftcharts/info).
## The chart is not showing
The `Chart` class inherits from `UIView`, so if your chart is not displaying it is likely a problem related to the view's size. Check your view constraints and make sure you initialize it on `viewDidLoad`, when UIKit can calculate the view dimensions.
Some tips for debugging an hidden chart:
* start your app and then debug the UI Hierarchy from the Debug navigator
* initialize a simple UIView with a colored background instead of the chart to easily see how the view is positioned
* try to not to nest the chart in a subview for better debugging
# License
SwiftChart is available under the MIT license. See the LICENSE file for more info.