https://github.com/34j/colormap-complex
Complex / 2d multivariate bivariate colormap / Domain coloring for Matplotlib, Plotly etc. (pure-numpy)
https://github.com/34j/colormap-complex
bivariate bivariate-analysis color colormap colour-science complex-analysis complex-numbers domain-coloring domain-colouring matplotlib multivariate multivariate-analysis
Last synced: about 1 year ago
JSON representation
Complex / 2d multivariate bivariate colormap / Domain coloring for Matplotlib, Plotly etc. (pure-numpy)
- Host: GitHub
- URL: https://github.com/34j/colormap-complex
- Owner: 34j
- License: apache-2.0
- Created: 2025-04-20T10:23:13.000Z (about 1 year ago)
- Default Branch: main
- Last Pushed: 2025-05-08T01:55:35.000Z (about 1 year ago)
- Last Synced: 2025-05-08T21:58:17.725Z (about 1 year ago)
- Topics: bivariate, bivariate-analysis, color, colormap, colour-science, complex-analysis, complex-numbers, domain-coloring, domain-colouring, matplotlib, multivariate, multivariate-analysis
- Language: Python
- Homepage:
- Size: 1.88 MB
- Stars: 2
- Watchers: 2
- Forks: 0
- Open Issues: 5
-
Metadata Files:
- Readme: README.md
- Changelog: CHANGELOG.md
- Contributing: CONTRIBUTING.md
- Funding: .github/FUNDING.yml
- License: LICENSE
- Code of conduct: .github/CODE_OF_CONDUCT.md
Awesome Lists containing this project
README
# Colormap Complex


---
**Documentation**: https://colormap-complex.readthedocs.io
**Source Code**: https://github.com/34j/colormap-complex
---
Complex / 2d colormap
## Installation
Install this via pip (or your favourite package manager):
```shell
pip install colormap-complex
```
## Usage
```python
from colormap_complex import colormap
import numpy as np
lin = np.linspace(-1, 1, 100)
x, y = np.meshgrid(lin, lin)
z = x + 1j * y
c = colormap(type="oklab")(z.real, z.imag, scale=True)
plt.imshow(c, extent=(-1, 1, -1, 1), origin='lower')
```
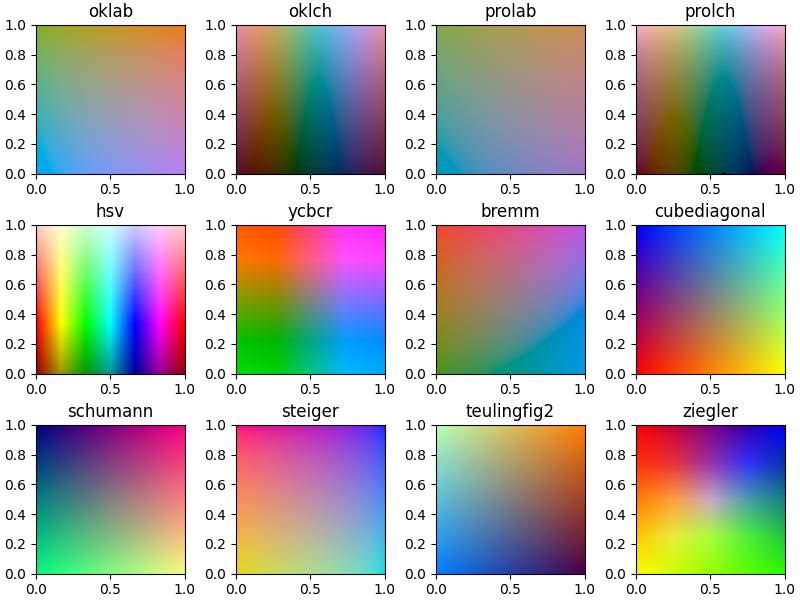
### All colormaps
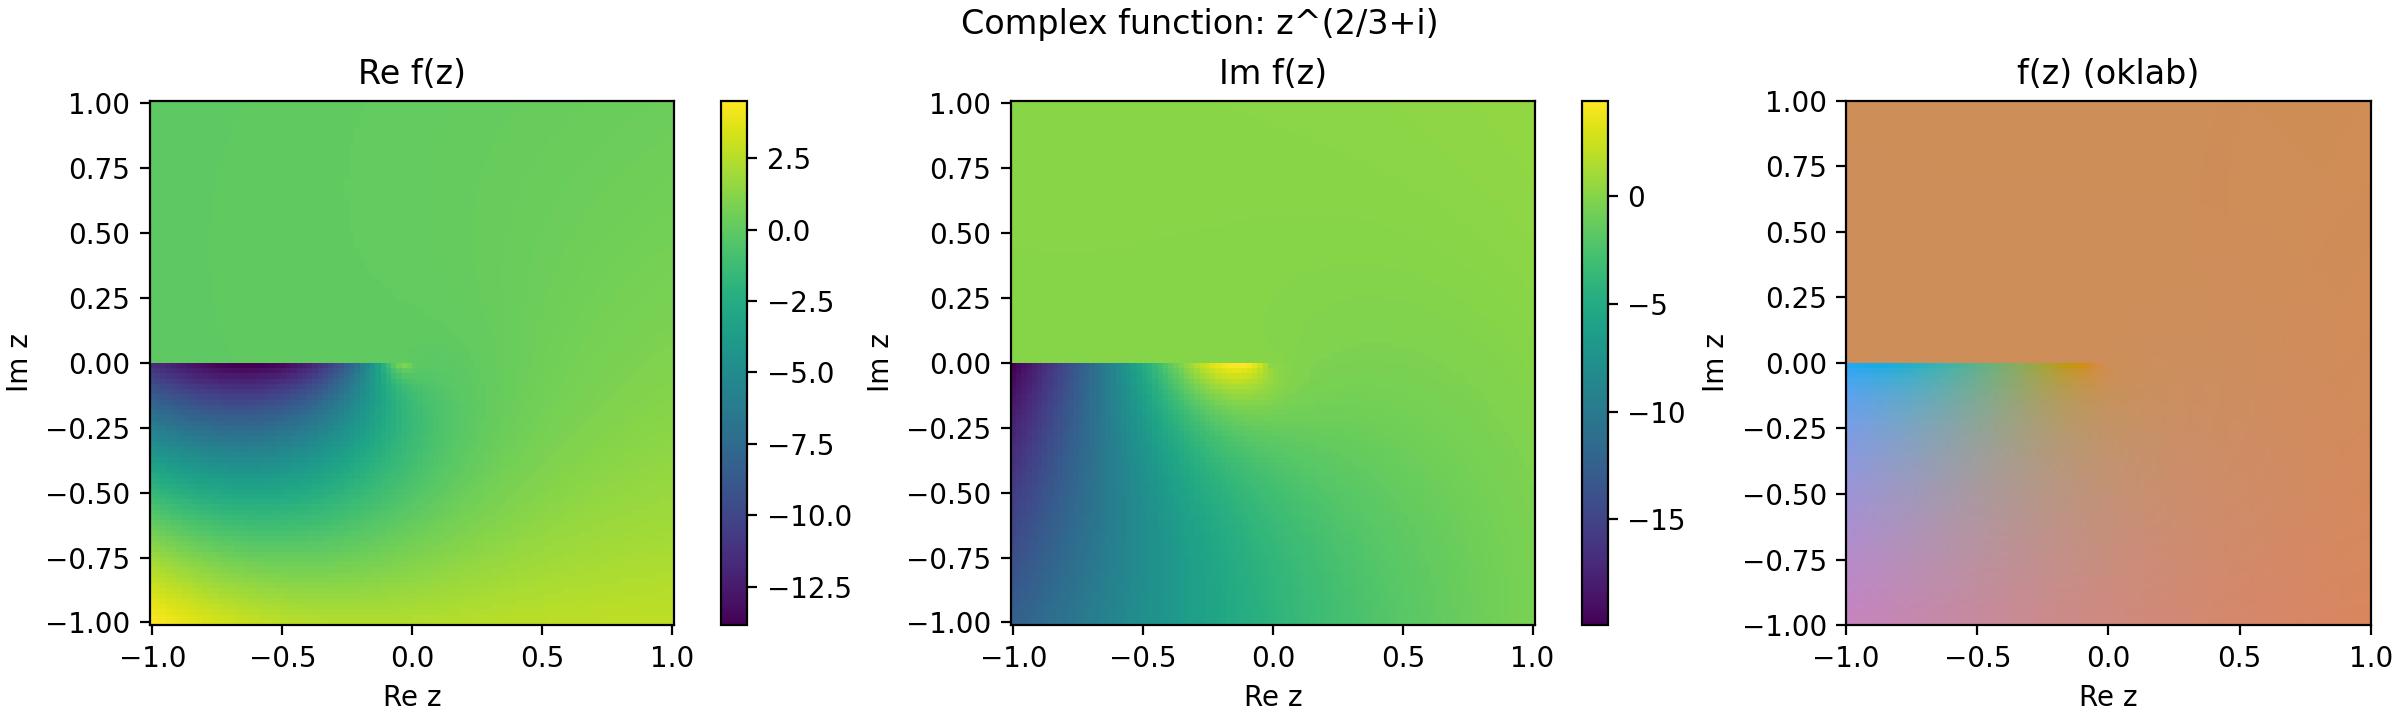
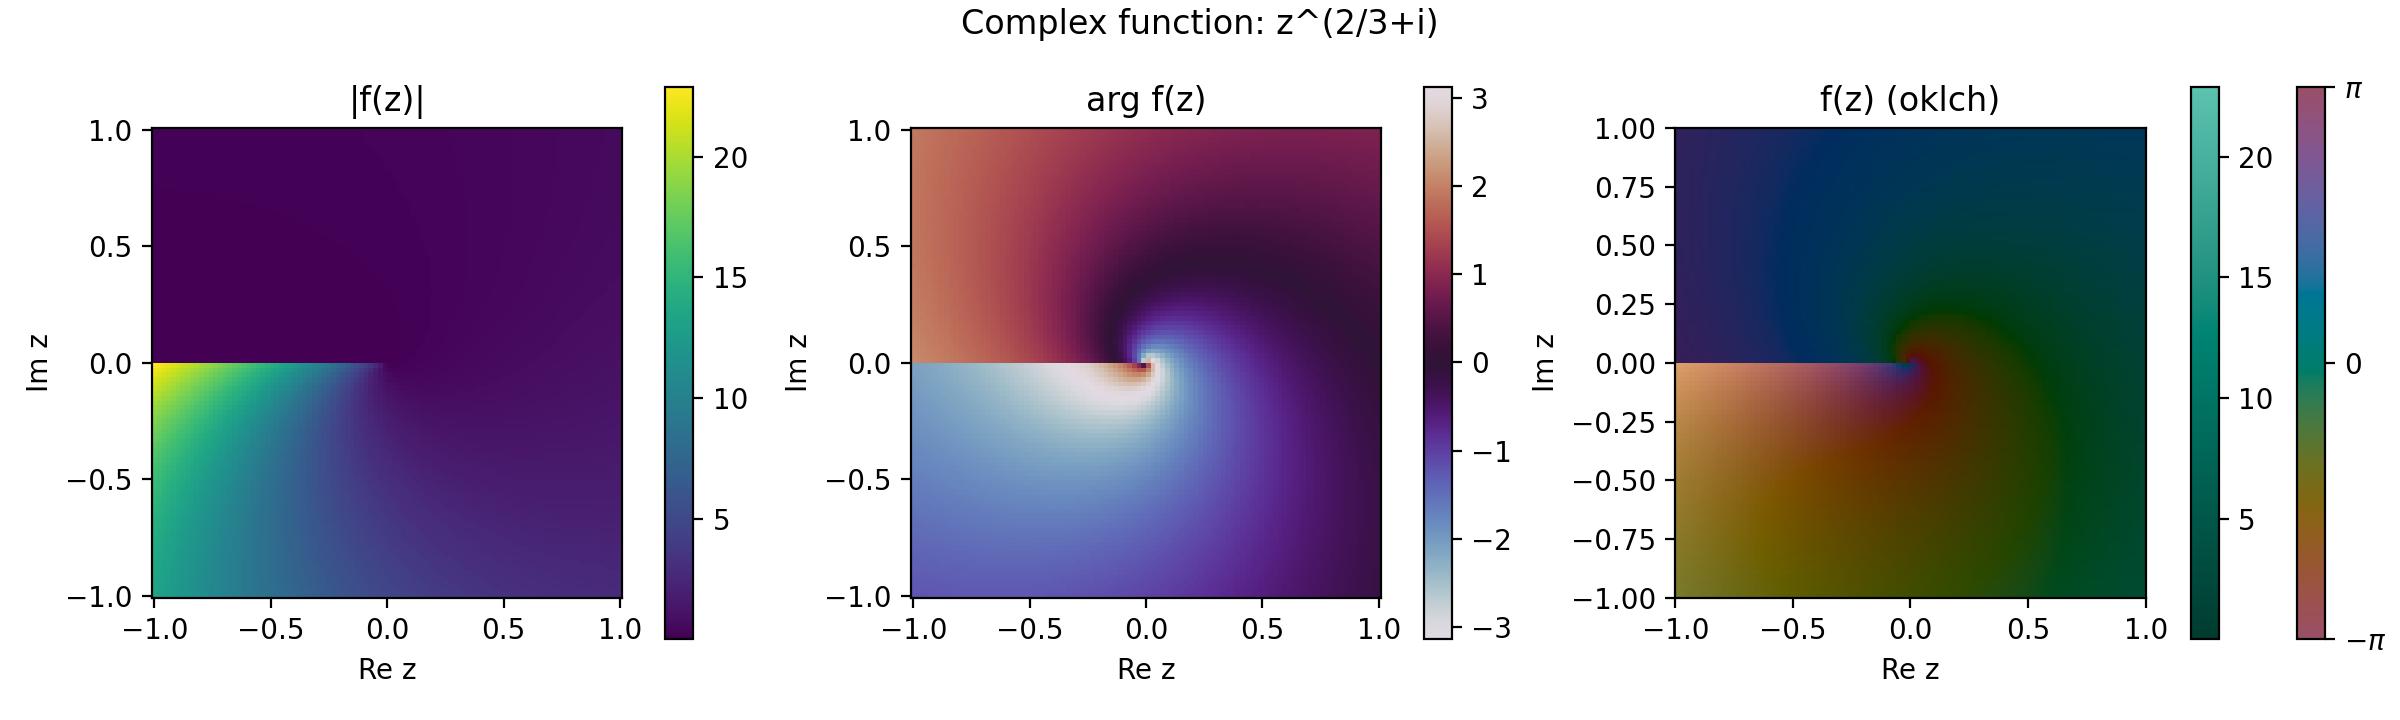
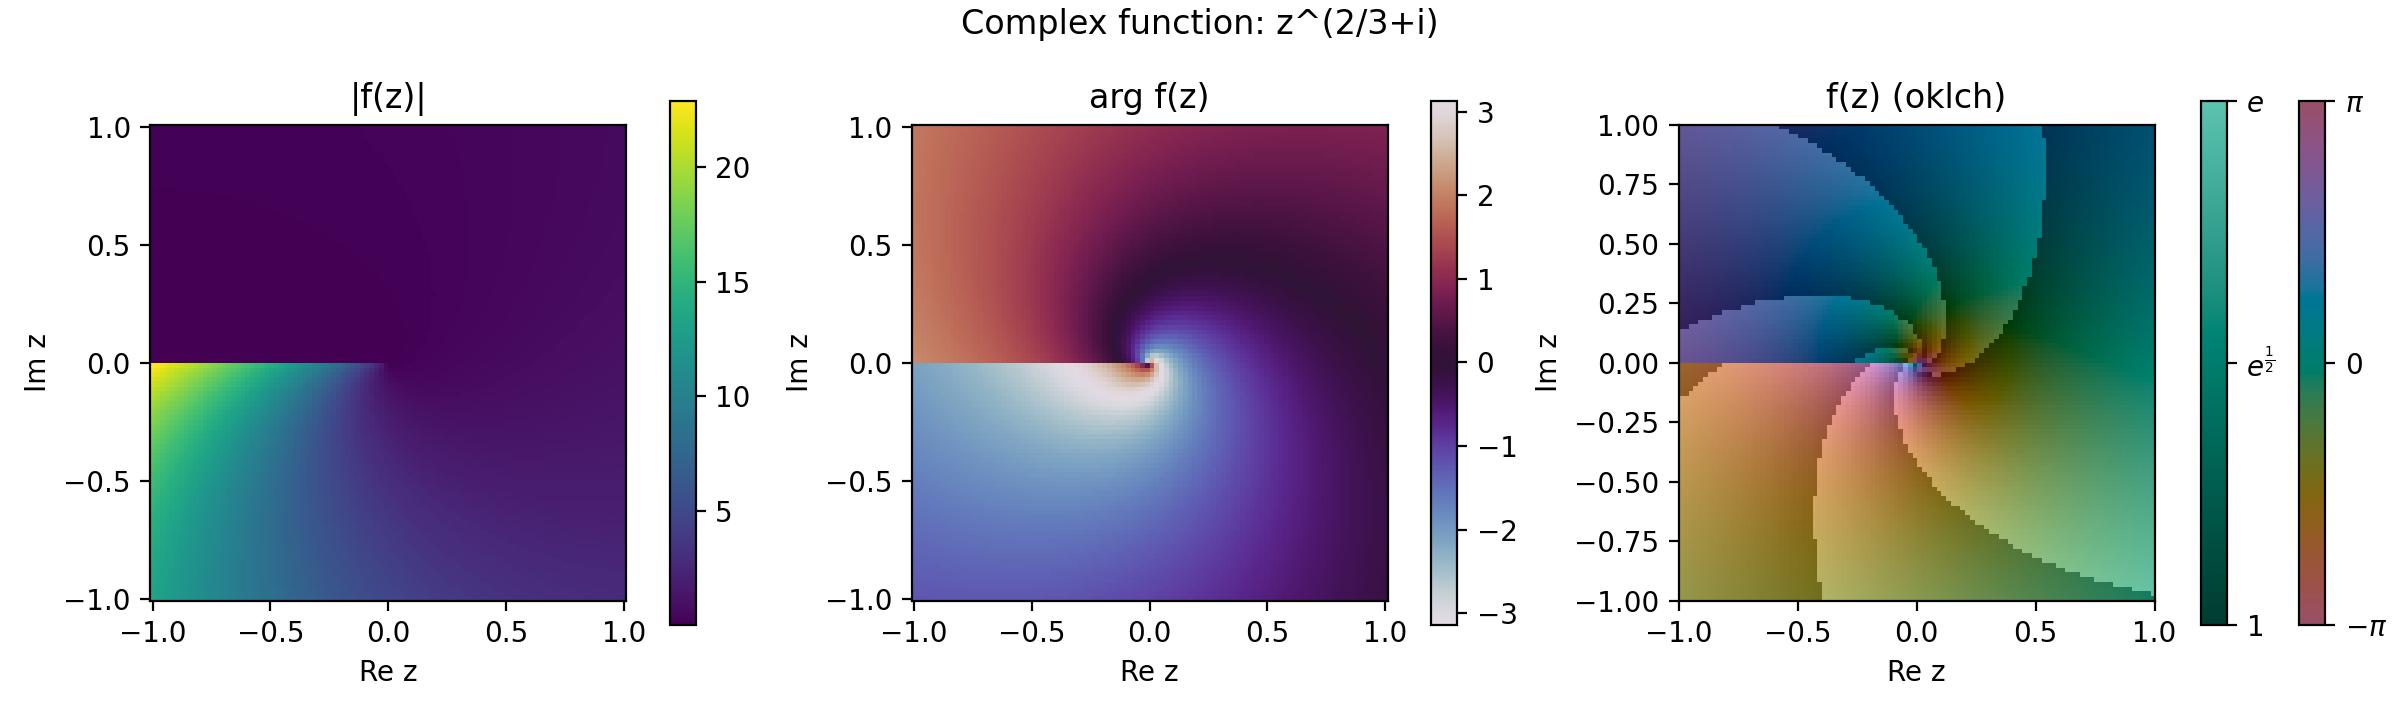
### Examples
### Description
- `"bremm", "cubediagonal", "schumann", "steiger", "teulingfig2", "ziegler"` colormaps are collected from [spinthil/pycolormap-2d](https://github.com/spinthil/pycolormap-2d) which is based on:
> M. Steiger, J. Bernard, S. Thum, S. Mittelstädt, M. Hutter, D. A. Keim, and J. Kohlhammer, “Explorative Analysis of 2D Color Maps,” in International Conferences in Central Europe on Computer Graphics, Visualization and Computer Vision, 2015, vol. 23, pp. 151–160.
- Other colormaps are built on top of [colour-science/colour](https://github.com/colour-science/colour) and created by the author.
- `"oklab", "prolab"` are perceptually uniform (lightness) colormaps.
- `"oklch", "prolch"` are perceptually uniform (chroma) colormaps. X axis corresponds to Hue and Y axis to Lightness.
## Alternatives
- [nschloe/cplot: :rainbow: Plot complex functions](https://github.com/nschloe/cplot/tree/main)
## Contributors ✨
Thanks goes to these wonderful people ([emoji key](https://allcontributors.org/docs/en/emoji-key)):
This project follows the [all-contributors](https://github.com/all-contributors/all-contributors) specification. Contributions of any kind welcome!
## Credits
[](https://github.com/copier-org/copier)
This package was created with
[Copier](https://copier.readthedocs.io/) and the
[browniebroke/pypackage-template](https://github.com/browniebroke/pypackage-template)
project template.