https://github.com/86lekwenshiung/binary-classification-on-west-nile-virus
Binary Classification on West Nile Virus Dataset.
https://github.com/86lekwenshiung/binary-classification-on-west-nile-virus
boosting-algorithms geopy tree-algorithms
Last synced: 4 months ago
JSON representation
Binary Classification on West Nile Virus Dataset.
- Host: GitHub
- URL: https://github.com/86lekwenshiung/binary-classification-on-west-nile-virus
- Owner: 86lekwenshiung
- Created: 2021-10-09T07:30:47.000Z (over 3 years ago)
- Default Branch: main
- Last Pushed: 2021-11-06T08:21:10.000Z (over 3 years ago)
- Last Synced: 2025-01-11T05:19:14.384Z (6 months ago)
- Topics: boosting-algorithms, geopy, tree-algorithms
- Language: Jupyter Notebook
- Homepage:
- Size: 63.2 MB
- Stars: 0
- Watchers: 1
- Forks: 1
- Open Issues: 0
-
Metadata Files:
- Readme: README.md
Awesome Lists containing this project
README
# West Nile Virus Prediction
___
Source : https://www.purdue.edu/uns/html4ever/2006/060814.Rossmann.westnile.html
## Executive Summary
In 2016 Chicago had 108 Human cases of West Nile Virus (WNV)[5] based on studies, there is an average USD 11,000 1-year persistent cost due to medical cost and personal loss. Since WNV is spread through mosquitoes, there have been efforts to track the population of mosquitos with traps spread throughout the city. As a solution, Chicago has attempted to reduce the mosquito population since 2011 by starting a pesticide regime using Zenivex-E4-Etofenprox mosquito adulticide. In this project, the historical records of mosquito populations with and without WNV in Chicago and machine learning techniques are used to predict the presence of WNV. Then a cost-benefit analysis is conducted to determine a strategy for pesticide spraying.
To predict the presence of WNV, supervised learning models such as XGBoost and Random Forest are trained and tested. XGBoost having the best AUC score.
A Cost-Benefit analysis also revealed that an estimated annual human costs from WNV can budget a citywide pesticide spray up to 7-8 times in a year.
## Introduction
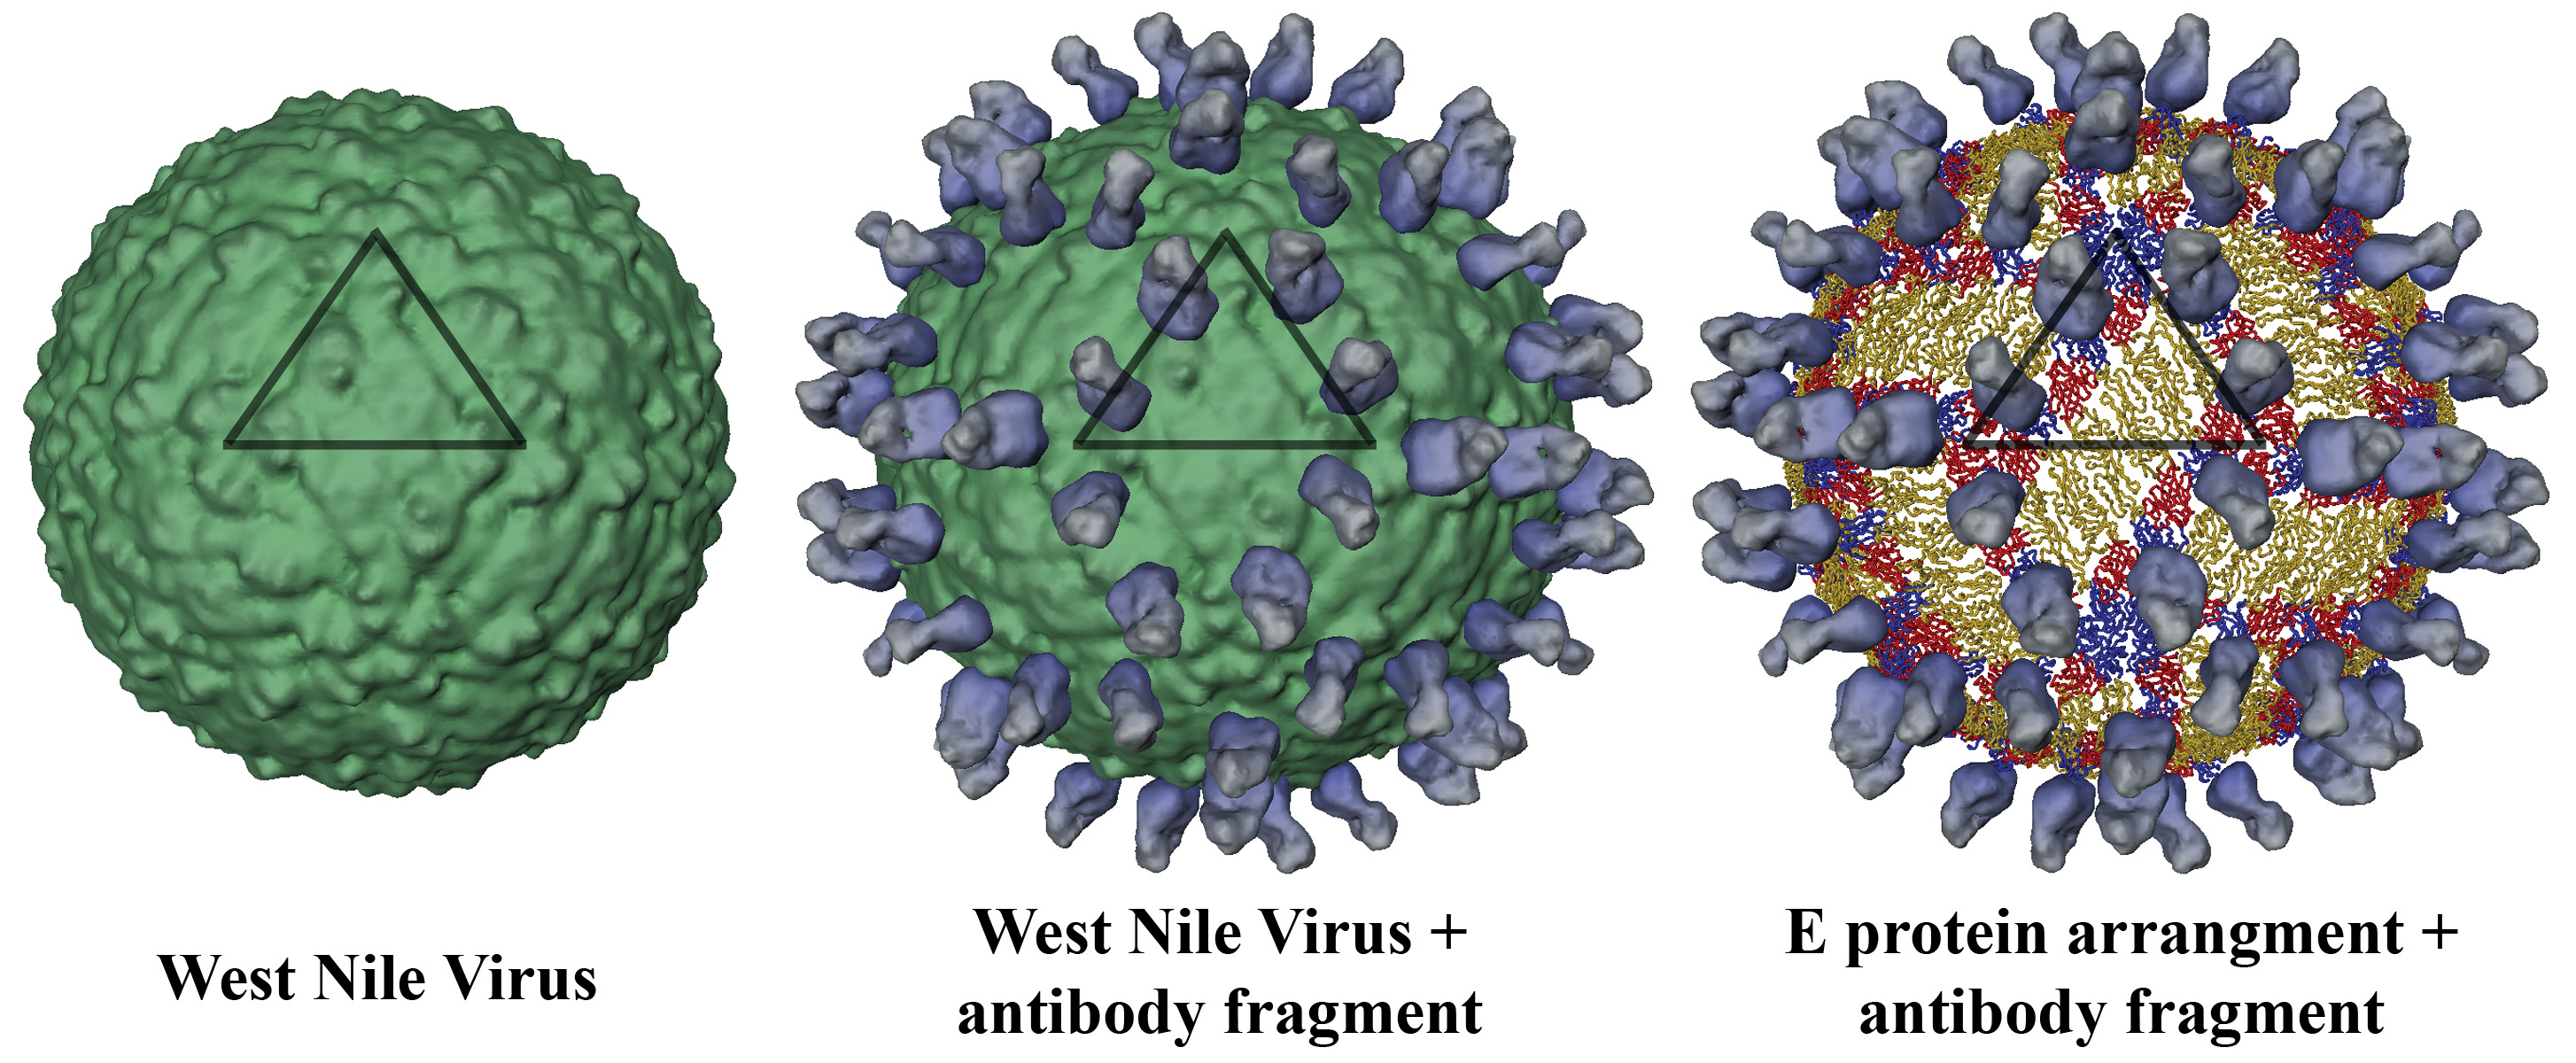
WNV is a single-stranded RNA virus that causes West Nile fever. It is a member of the family Flaviviridae, from the genus Flavivirus, which also contains the Zika virus, dengue virus, and yellow fever virus. The virus is primarily transmitted by mosquitoes, mostly species of Culex. It has been causing significant and sometimes severe human diseases. Although pesticides are known to be effective in dealing with the virus-carrying mosquitoes, it is expensive to deploy pesticides throughout the city. (West Nile virus - Wikipedia)
As data scientists, we want **to understand the factors driving the spread of WNV by leveraging on data collected by Chicago's surveillance system, weather stations, and pesticide spray deployment, in order to develop a classification model that could predict the presence of WNV within the area of the city. Through these studies, we hope to suggest a cost-efficient and effective method of deploying pesticides within the area.**
This project is the fourth project for General Assembly Singapore's Data Science Immersive Flex Batch 2 program (DSIF2) and was part of a Kaggle competition to predict the occurrence of West Nile Virus in the city of Chicago.
The project explores data collected from various sources, namely:
• Mosquito trap data collected by the city's surveillance and control system
• Location data of spraying efforts
• Weather data
The data from these three sources were combined to form a dataset for analysis and modelling. Feature engineering exercises were performed to add information relevant to the classification models. **The two best models will be selected as the final result for this project.**
## Project Team Members
• Julian Chang - EDA, Cost-Benefit Analysis
• Ahmad Khalil - EDA, Documentation
• Terence Lek - Modelling, Documentation
• Henri David Oei - EDA, Modelling
• Elang Setiawan - Feature Engineering, Documentation
## Implementation
### Data
The following datasets were provided for this project:
• train.csv
• test.csv
• spray.csv
• weather.csv
### Data Dictionary
|Data |Source |Description |
|--- |--- |--- |
|Date |train.csv |Date of sample collected (yyyy-mm-dd) |
|Address |train.csv |Street address of mosquito trap |
|Species |train.csv |Species of mosquito trapped |
|Block |train.csv |Block number of mosquito trap |
|Street |train.csv |Street name of mosquito trap |
|Trap |train.csv |Mosquito Trap ID. Letter behind Trap ID indicate it is near a main Trap |
|AddressNumberAndStreet |train.csv |Full address of mosquito trap |
|Latitude |train.csv |Latitude coordinate of mosquito trap |
|Longitude |train.csv |Longitude coordinate of mosquito trap |
|AddressAccuracy |train.csv |Accuracy of the address |
|NumMosquitos |train.csv |Number of mosquitoes caught in trap |
|WnvPresent |train.csv |Presence of West Nile Virus (0=No, 1=Yes)|
|Date |spray.csv |The date of mosquito spray (yyyy-mm-dd) |
|Time |spray.csv |The time of mosquito spray (H:mm:ss AM/PM)|
|Latitude |spray.csv |Latitude coordinate of mosquito spray |
|Longitude |spray.csv |Longitude coordinate of mosquito spray |
|Station |weather.csv |Weather Station ID |
|Date |weather.csv |Date of reading (yyyy-mm-dd) |
|Tmax |weather.csv |Maximum Temperature |
|Tmin |weather.csv |Minimum Temperature |
|Tavg |weather.csv |Average Temperature |
|Depart |weather.csv | Departure from normal |
|DewPoint |weather.csv |Temperature of water condensation |
|WetBulb |weather.csv | Temperature of wet bulb thermometer |
|Heat |weather.csv |Heating |
|Cool |weather.csv | Cooling |
|Sunrise |weather.csv |Time of sunrise |
|Sunset |weather.csv |Time of sunset |
|CodeSum |weather.csv | Weather phenomena |
|Depth |weather.csv | Depth |
|Water1 |weather.csv | Water |
|SnowFall |weather.csv | Precipitation depth |
|PrecipTotal |weather.csv | Precipitation depth |
|StnPressure |weather.csv | Average station pressure |
|SeaLevel |weather.csv | Average sea level pressure |
|ResultSpeed |weather.csv |Wind speed |
|ResultDir |weather.csv |Wind direction |
|AvgSpeed |weather.csv |Wind average speed |
## Evaluation Metrics
Since this is a classification model , we will evaluate how our model will perform in classifying between the presence and the absence of Wnv. Depending on the preprocessing method, different evaluation metrics will be used accordingly.
* For Imbalanced Data : F1 Score , Precision , AUC
* For Balanced Data : F1 Score , Accuracy
* Others Metrics : Recall Score
## Workflow Process
### 1. General EDA
### 2. EDA on Geolocation
### 3. Data Preprocessing
### 4. Feature Engineering
### 5. Create Model
### 6. Processing Dataframe for Kaggle Submission
### 7. Cost Benefit Analysis
---------------------------
## 1. General EDA
* 1. Traps
There are 136 traps.
T900 (at Ohare airport) is sampled the most.
Most sampling was performed in 2007 and decreased afterward. Very inconsistent and high oversampling in August 2007 leading to high population of mosquitos in 2007.


* 2. Mosquito Species
Although all species sampled are carriers of WNV, the presence of WNV was tested positive for Culex restuans, C. pipiens, and C.pipiens/restuans. In addition, these 3 categories made up more than 96% of the sample of the species sampled.
Source: https://www.cdc.gov/westnile/resources/pdfs/MosquitoSpecies1999-2016.pdf


## 2. EDA on Geolocation
We visualise the geolocation of the data on maps for better understanding.


## 3. Data Preprocessing
We removed duplicates, split the dataset, dropped columns and performed a SMOTENN to deal with imbalance data.
## 4. Feature Engineering
We generated three feature categories for our modeling process:
* Dates: Year, Month, WeekofYear
* Sprayed: 0 means trap not sprayed, 1 means trap is sprayed
* Weather: Impute missing data and remove strongly correlated data form station 1.
## 5. Modelling & Evaluation
Several classifier models were developed, where the hyperparameters were tuned for each model to obtain the best cross-validated AUC scores. Because there were heavy imbalances in the data collected (about 95% of the data indicated no Wnv), an over-sampling method known as SMOTENN (Synthetic Minority Over-sampling Technique) was adopted. It was also the reason for optimizing the models on AUC scores instead of accuracy. Comparing the AUC and recall scores, the production model selected was the XGBoost model. Comparing the train and test accuracy scores of the selected model, there was evidence of slight overfitting of the data but the small difference was acceptable by our means.
| | Model | Train_AUC | Test_AUC | Precision | Specificity| Recall | F1_score |
|--- |-- |--- | --- | --- | --- | ---- | ------ |
| 0 | GB (No Smote) | 0.89 | 0.83 | 0.00 | 0.99 | 0.00 | 0.00|
| 1 | GB (Smote) | 0.99 | 0.81 | 0.17 | 0.86 | 0.53 | 0.26 |
| 2 | RFC (No Smote)| 0.98 | 0.75 | 0.33 | 0.97 | 0.21 | 0.26|
| 3 | RFC (Smote) | 1.00 | 0.75 | 0.22 | 0.92 | 0.39 | 0.28 |
| 4 | XGB (No Smote)|0.88|0.83|0.00|1.00|0.00|0.0|
| 5 | XGB (Smote) |0.99|0.82|0.18|0.85|0.57|0.27|
## 6. Processing Dataframe for Kaggle Submission
Submission to kaggle resulted in a score of 0.62.
## 7. Cost Benefit Analysis
In this project we analyzed the costs (using pesticide Zenivex E4[1]) based on estimates of $500 for a session for 0.5 acre of land[2]. The cost is $149,000 for 0.6 km^2 [3]. By spending on treatment there will be fewer people dying or falling ill thus increasing workplace productivity and healthcare savings (average $11,000)[4]. We based our calculation on a study done in 2016 where 108 WNV cases[5] were found incurring an estimated medical bill of $1,190,000
The current spray strategy in 2013 is found to be insignificant when compared to areas without treatment. While the spraying regime is performed sporadically in Chicago, there may be some coverage in 2013, but it is not widespread. In terms of pesticide spray strategy, it is found that the effective coverage is low, having treated areas only sprayed once. Estimated human cost (from hospital and productivity costs) of WNV was calculated on the city’s infected population in 2016. The estimated human costs can budget a citywide pesticide spray up to 7-8 times.
Since the benefits outweigh the costs the county should socialise the cost and share the prevention costs with the community as a whole.
Moving forward, more geographic and demographic information could also be useful in studying the presence of Wnv. Since Wnv is spread through mosquitoes, we could expect that proportion of open water sources, percentage of grassland, forests, and urban landscape are all factors of the livelihood of these mosquitoes. We can expand the studies to the rest of the United States with more data on more mosquitoes species as other states have other species as the main vector species.
## References
* [1. Pesticide info](https://www.cmmcp.org/pesticide-information/pages/zenivex-e4-etofenprox)
* [2. Cost of spray](https://www.callnorthwest.com/2020/05/how-much-does-a-mosquito-treatment-cost/)
* [3. Chicago spray strategy](https://www.chicago.gov/city/en/depts/cdph/provdrs/healthy_communities/news/2020/august/city-to-spray-insecticide-thursday-to-kill-mosquitoes.html)
* [4. WNV cost](https://bmcinfectdis.biomedcentral.com/articles/10.1186/s12879-019-4596-9)
* [5. No. of WNV 2016 in Chicago](https://www.ncbi.nlm.nih.gov/pmc/articles/PMC7241786/)