https://github.com/Codennnn/Green-Wall
⬜🟩 GitHub Contributions Graph Generator. :octocat:
https://github.com/Codennnn/Green-Wall
contribution-graph github-api
Last synced: over 1 year ago
JSON representation
⬜🟩 GitHub Contributions Graph Generator. :octocat:
- Host: GitHub
- URL: https://github.com/Codennnn/Green-Wall
- Owner: Codennnn
- License: mit
- Created: 2022-08-29T14:57:09.000Z (almost 4 years ago)
- Default Branch: main
- Last Pushed: 2024-12-22T03:10:04.000Z (over 1 year ago)
- Last Synced: 2025-02-20T18:01:43.132Z (over 1 year ago)
- Topics: contribution-graph, github-api
- Language: TypeScript
- Homepage: https://green-wall.leoku.dev
- Size: 1.46 MB
- Stars: 522
- Watchers: 2
- Forks: 19
- Open Issues: 3
-
Metadata Files:
- Readme: README.md
- License: LICENSE
Awesome Lists containing this project
README
# [Green Wall](https://green-wall.leoku.dev/)
_Take a snapshot 📸 of your GitHub contributions, then share it!_
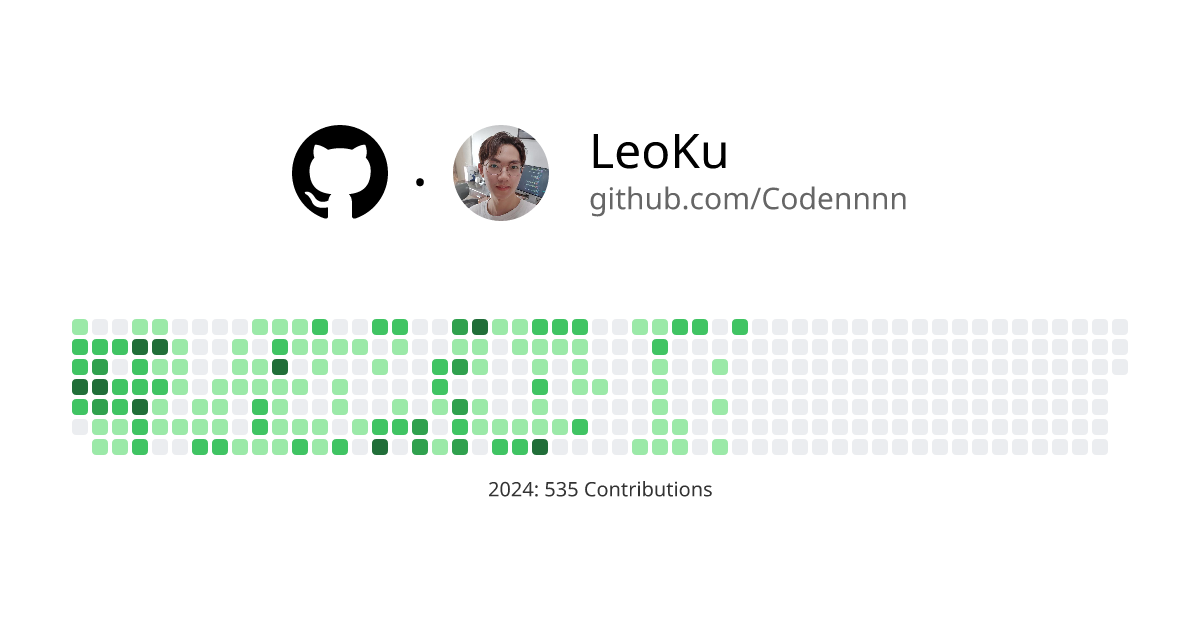
**Green Wall** is a powerful web tool that simplifies the way you review your GitHub :octocat: contributions over time. This tool allows you to generate an image of your contributions, which you can save and share with others.
[](https://green-wall.leoku.dev/)
## How it works
This project leverages the GitHub GraphQL API to retrieve data and employs Next.js API Routes to handle requests. For insights into how we manage your data, refer to [this file](./src/app/api/contribution/%5Busername%5D/route.ts).
## Usage
To showcase a live preview of your contributions on your GitHub README or website, you can use the following examples.
**Optional Parameters**
| Parameter | Description | Type | Default Value | Example |
|-----------|----------------------------------|----------|---------------|------------------|
| `year` | Specify calendar year to display | `number` | Latest year | `?year=2023` |
| `theme` | Choose color theme for image | `string` | `Classic` | `?theme=Violet` |
| `width` | Set custom image width | `number` | 1200 | `?width=800` |
| `height` | Set custom image height | `number` | 630 | `?height=400` |
**HTML**
```html

```
**Markdown**
```markdown

```
This will produce a preview similar to the one shown below.
## Tampermonkey
We also offer a [Tampermonkey script](https://greasyfork.org/en/scripts/492478-greenwall-view-all-contribution-graphs-in-github) that enables you to view the 'Green Wall' on anyone's GitHub profile page. The script adds a button to the user's GitHub Profile page, and clicking it will display the user's contribution graphs over the years.
The source code for the script is located in the file [`/plugins/script.ts`](./plugins/script.ts).
https://github.com/user-attachments/assets/694a5653-348b-4bec-9736-21e777e3ede8
## Credits
- _Inspired by:_ [GitHub Contributions Chart Generator](https://github.com/sallar/github-contributions-chart).
- _Framework:_ Next.js.
- _Font:_ [Rubik](https://fonts.google.com/specimen/Rubik) by Google Fonts.
- _Icons:_ [heroicons](https://heroicons.com).
## Running Locally
To run this project, which uses the [GitHub API](https://docs.github.com/en/graphql) to fetch data, you'll need a personal access token for authentication. For details on obtaining this token, see "[Creating a personal access token](https://docs.github.com/en/authentication/keeping-your-account-and-data-secure/creating-a-personal-access-token)".
Once you have your personal access token, create a file named `.env.local` at the root of the project and insert the token as follows:
```sh
# .env.local
# The format should be: GITHUB_ACCESS_TOKEN="[YOUR_TOKEN]"
# Example:
GITHUB_ACCESS_TOKEN="ghp_xxxxxxxxxxxxxxxxxxxxxxxxxxxxxxxxxxxx"
```
Then you are ready to run `pnpm dev` to develop.