https://github.com/ColCarroll/ridge_map
Ridge plots of ridges
https://github.com/ColCarroll/ridge_map
Last synced: over 1 year ago
JSON representation
Ridge plots of ridges
- Host: GitHub
- URL: https://github.com/ColCarroll/ridge_map
- Owner: ColCarroll
- License: mit
- Created: 2019-05-01T12:30:48.000Z (about 7 years ago)
- Default Branch: main
- Last Pushed: 2024-04-03T02:02:53.000Z (about 2 years ago)
- Last Synced: 2024-10-29T18:07:36.187Z (over 1 year ago)
- Language: Python
- Size: 5.16 MB
- Stars: 514
- Watchers: 12
- Forks: 47
- Open Issues: 13
-
Metadata Files:
- Readme: README.md
- License: LICENSE
Awesome Lists containing this project
README
ridge_map
=========

*Ridge plots of ridges*
-----------------------
A library for making ridge plots of... ridges. Choose a location, get an elevation map, and tinker with it to make something beautiful. Heavily inspired from [Zach Cole's beautiful art](https://twitter.com/ZachACole/status/1121554541101477889), [Jake Vanderplas' examples](https://github.com/jakevdp/altair-examples/blob/master/notebooks/PulsarPlot.ipynb), and Joy Division's [1979 album "Unknown Pleasures"](https://gist.github.com/ColCarroll/68e29c92b766418b0a4497b4eb2ecba4).
Uses [matplotlib](https://matplotlib.org/), [SRTM.py](https://github.com/tkrajina/srtm.py), [numpy](https://www.numpy.org/), and [scikit-image](https://scikit-image.org/) (for lake detection).
Installation
------------
Available on [PyPI](https://pypi.org/project/ridge-map/):
```bash
pip install ridge_map
```
Or live on the edge and install from github with
```bash
pip install git+https://github.com/colcarroll/ridge_map.git
```
You can also make a copy of [this colab](https://colab.research.google.com/drive/1ntwd73haePt3OS5ysz4yGSlhmUecY24O?usp=sharing).
Want to help?
-------------
- I feel like I am missing something easy or obvious with lake/road/river/ocean detection, but what I've got gets me most of the way there. If you hack on the `RidgeMap.preprocessor` method and find something nice, I would love to hear about it!
- Did you make a cool map? Open an issue with the code and I will add it to the examples.
Examples
--------
The API allows you to download the data once, then edit the plot yourself,
or allow the default processor to help you.
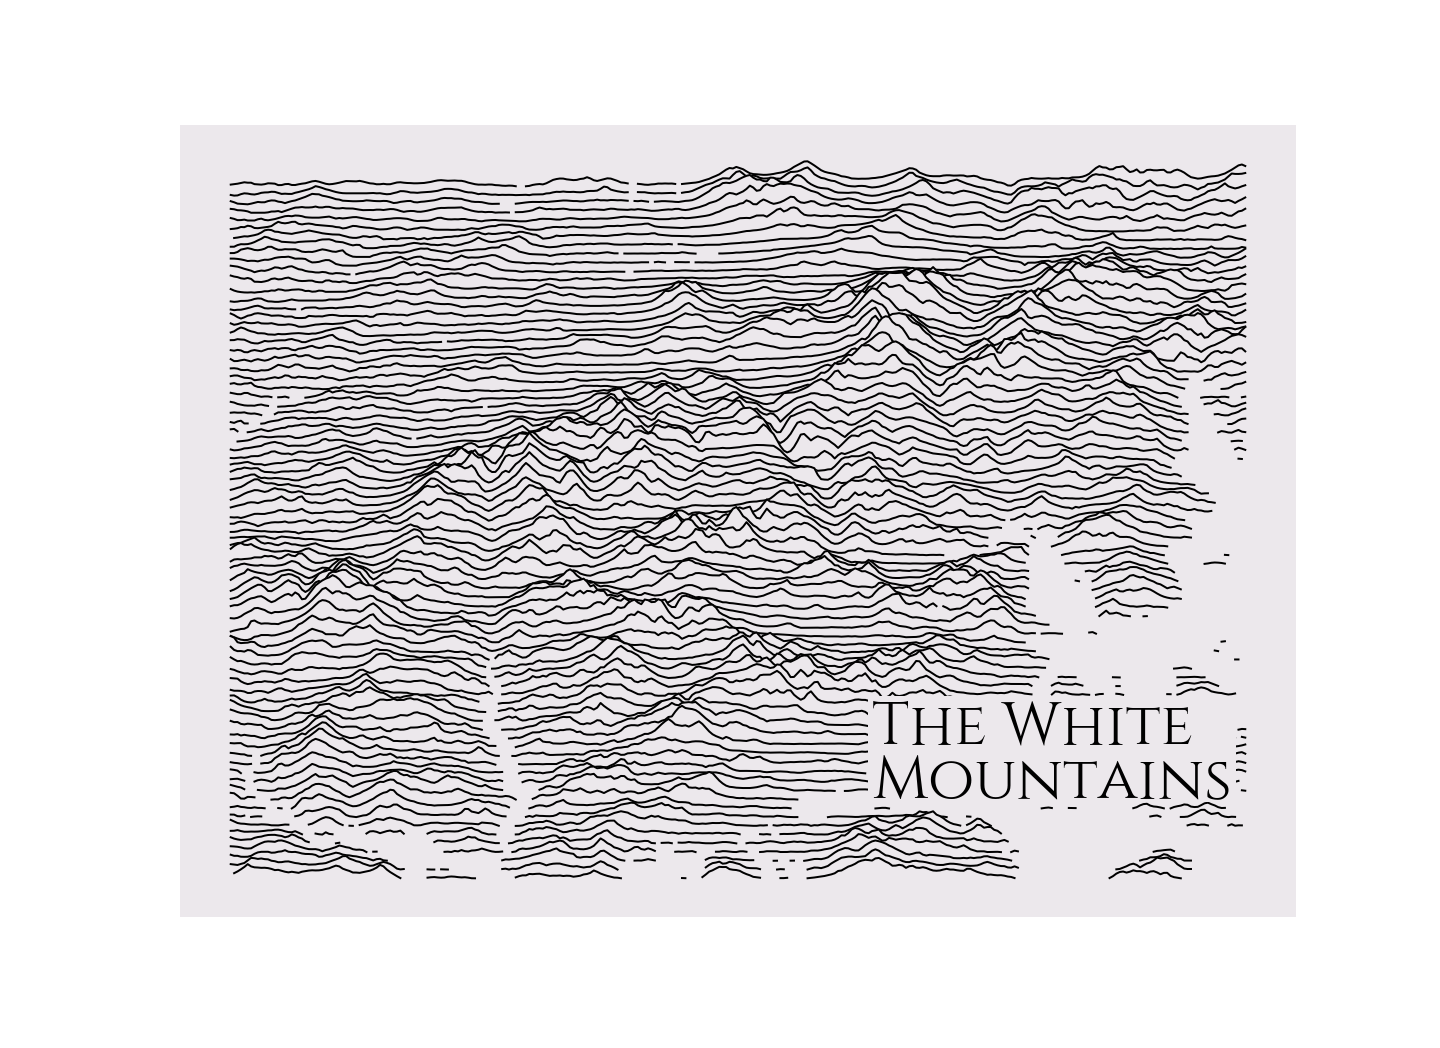
### New Hampshire by default
Plotting with all the defaults should give you a map of my favorite mountains.
```python
from ridge_map import RidgeMap
RidgeMap().plot_map()
```
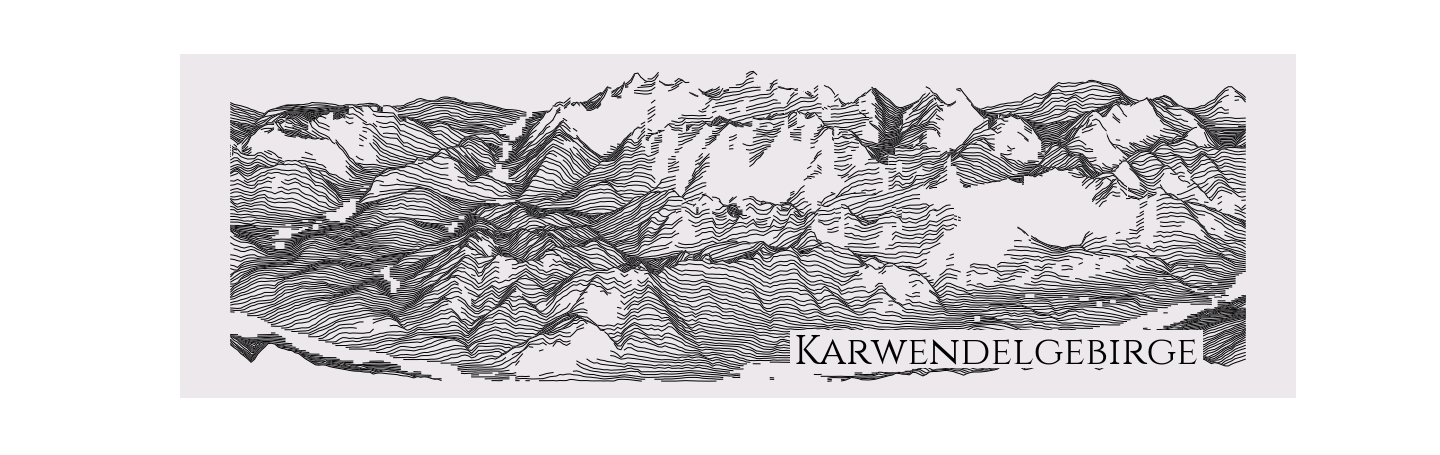
### Download once and tweak settings
First you download the elevation data to get an array with shape
`(num_lines, elevation_pts)`, then you can use the preprocessor
to automatically detect lakes, rivers, and oceans, and scale the elevations.
Finally, there are options to style the plot
```python
rm = RidgeMap((11.098251,47.264786,11.695633,47.453630))
values = rm.get_elevation_data(num_lines=150)
values=rm.preprocess(
values=values,
lake_flatness=2,
water_ntile=10,
vertical_ratio=240)
rm.plot_map(values=values,
label='Karwendelgebirge',
label_y=0.1,
label_x=0.55,
label_size=40,
linewidth=1)
```
### Plot with colors!
If you are plotting a town that is super into burnt orange for whatever
reason, you can respect that choice.
```python
rm = RidgeMap((-97.794285,30.232226,-97.710171,30.334509))
values = rm.get_elevation_data(num_lines=80)
rm.plot_map(values=rm.preprocess(values=values, water_ntile=12, vertical_ratio=40),
label='Austin\nTexas',
label_x=0.75,
linewidth=6,
line_color='orange')
```

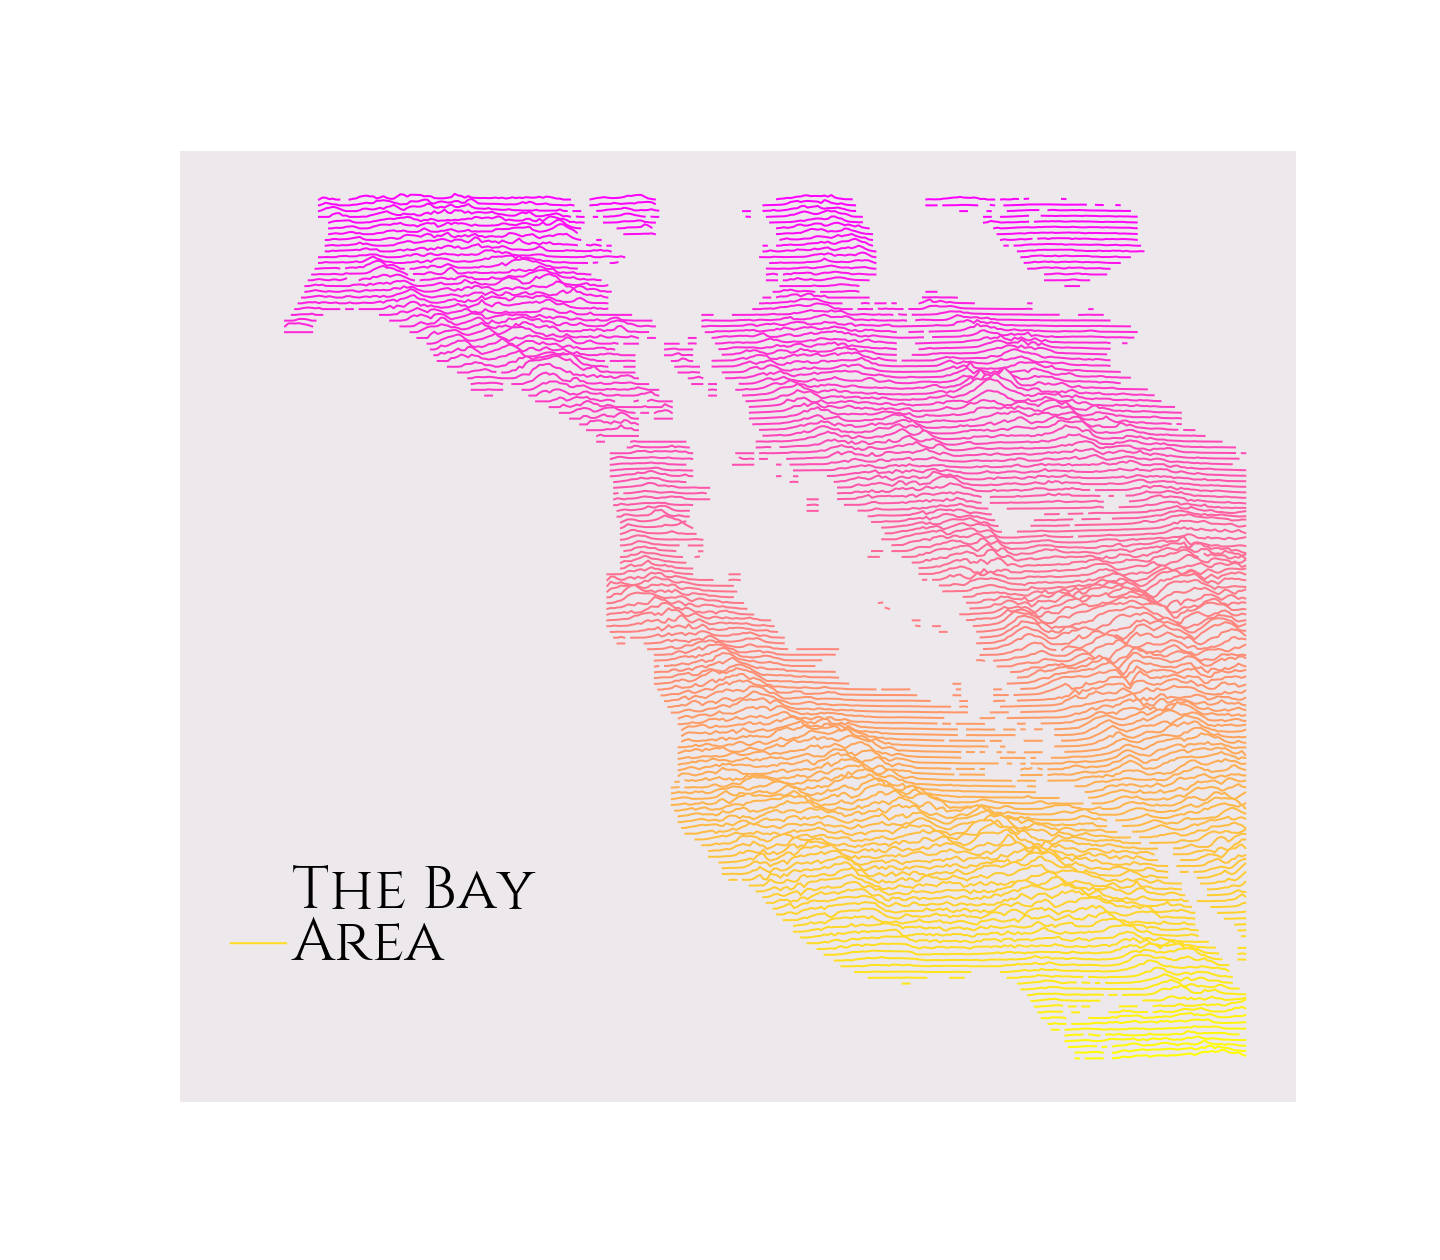
### Plot with even more colors!
The line color accepts a [matplotlib colormap](https://matplotlib.org/gallery/color/colormap_reference.html#sphx-glr-gallery-color-colormap-reference-py), so really feel free to go to town.
```python
rm = RidgeMap((-123.107300,36.820279,-121.519775,38.210130))
values = rm.get_elevation_data(num_lines=150)
rm.plot_map(values=rm.preprocess(values=values, lake_flatness=3, water_ntile=50, vertical_ratio=30),
label='The Bay\nArea',
label_x=0.1,
line_color = plt.get_cmap('spring'))
```
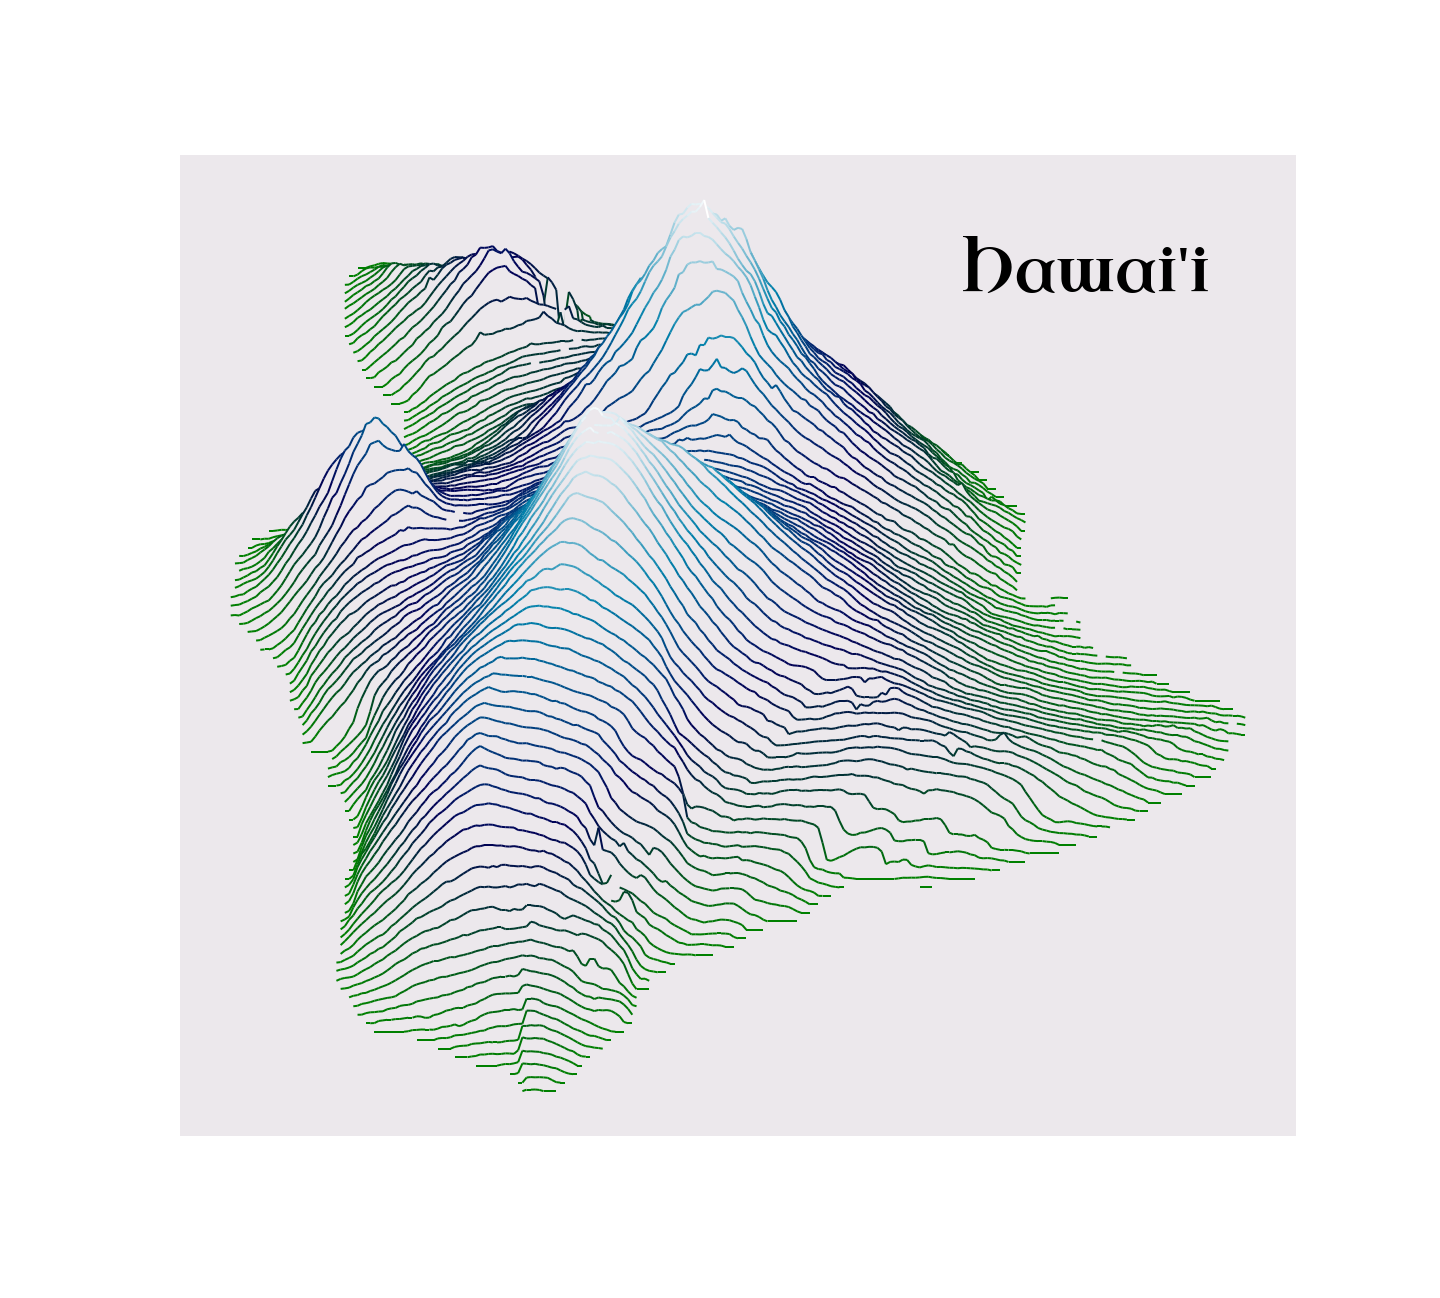
### Plot with custom fonts and elevation colors!
You can find a good font [from Google](https://fonts.google.com/), and then get the path to the ttf file [in the github repo](https://github.com/google/fonts/tree/master/ofl).
If you pass a matplotlib colormap, you can specify `kind="elevation"` to color tops of mountains different from bottoms. `ocean`, `gnuplot`, and `bone` look nice.
```python
from ridge_map import FontManager
font = FontManager('https://github.com/google/fonts/blob/main/ofl/uncialantiqua/UncialAntiqua-Regular.ttf?raw=true')
rm = RidgeMap((-156.250305,18.890695,-154.714966,20.275080), font=font.prop)
values = rm.get_elevation_data(num_lines=100)
rm.plot_map(values=rm.preprocess(values=values, lake_flatness=2, water_ntile=10, vertical_ratio=240),
label="Hawai'i",
label_y=0.85,
label_x=0.7,
label_size=60,
linewidth=2,
line_color=plt.get_cmap('ocean'),
kind='elevation')
```
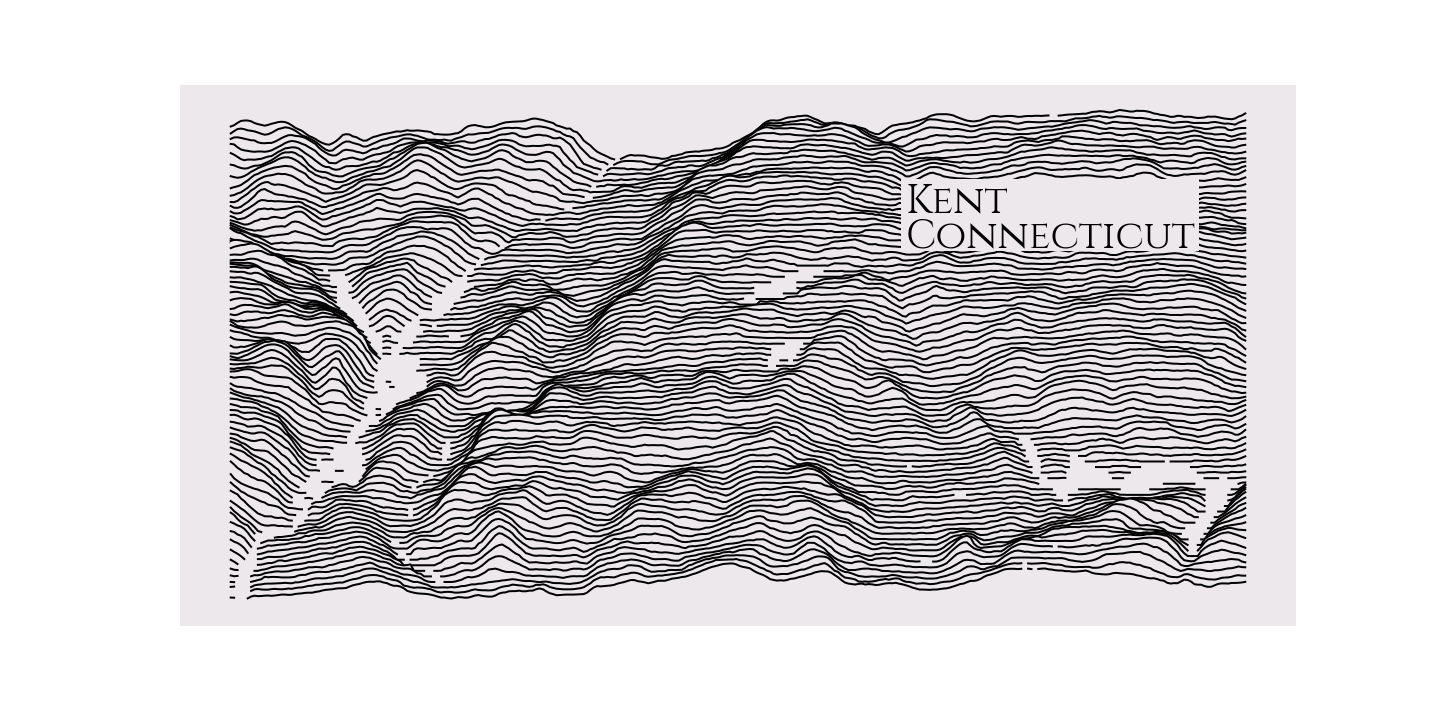
### How do I find a bounding box?
I have been using [this website](http://bboxfinder.com). I find an area I like, draw a rectangle, then copy and paste the coordinates into the `RidgeMap` constructor.
```python
rm = RidgeMap((-73.509693,41.678682,-73.342838,41.761581))
values = rm.get_elevation_data()
rm.plot_map(values=rm.preprocess(values=values, lake_flatness=2, water_ntile=2, vertical_ratio=60),
label='Kent\nConnecticut',
label_y=0.7,
label_x=0.65,
label_size=40)
```
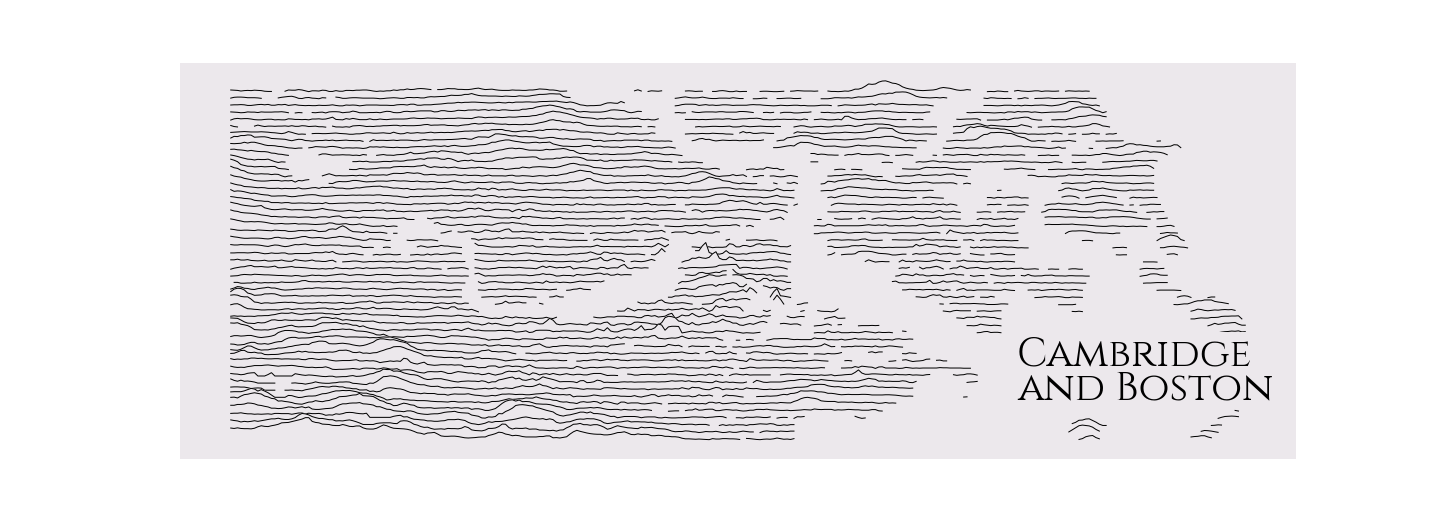
### What about really flat areas?
You might really have to tune the `water_ntile` and `lake_flatness` to get the water right. You can set them to 0 if you do not want any water marked.
```python
rm = RidgeMap((-71.167374,42.324286,-70.952454, 42.402672))
values = rm.get_elevation_data(num_lines=50)
rm.plot_map(values=rm.preprocess(values=values, lake_flatness=4, water_ntile=30, vertical_ratio=20),
label='Cambridge\nand Boston',
label_x=0.75,
label_size=40,
linewidth=1)
```
### Can I change the angle?
Yes, you can change the angle at which you look at the map. South to North is 0 degrees, East to West is 90 degrees and so forth with the rest of the compass. I really recommend playing around with this setting because of the really cool maps it can generate.
Play around with `interpolation`, `lock_rotation`, and `crop` to polish out the map.
```python
rm = RidgeMap((-124.848974,46.292035,-116.463262,49.345786))
values = rm.get_elevation_data(elevation_pts=300, num_lines=300, viewpoint_angle=11)
values=rm.preprocess(
values=values,
lake_flatness=2,
water_ntile=10,
vertical_ratio=240
)
rm.plot_map(values=values,
label='Washington',
label_y=0.8,
label_x=0.05,
label_size=40,
linewidth=2
)
```


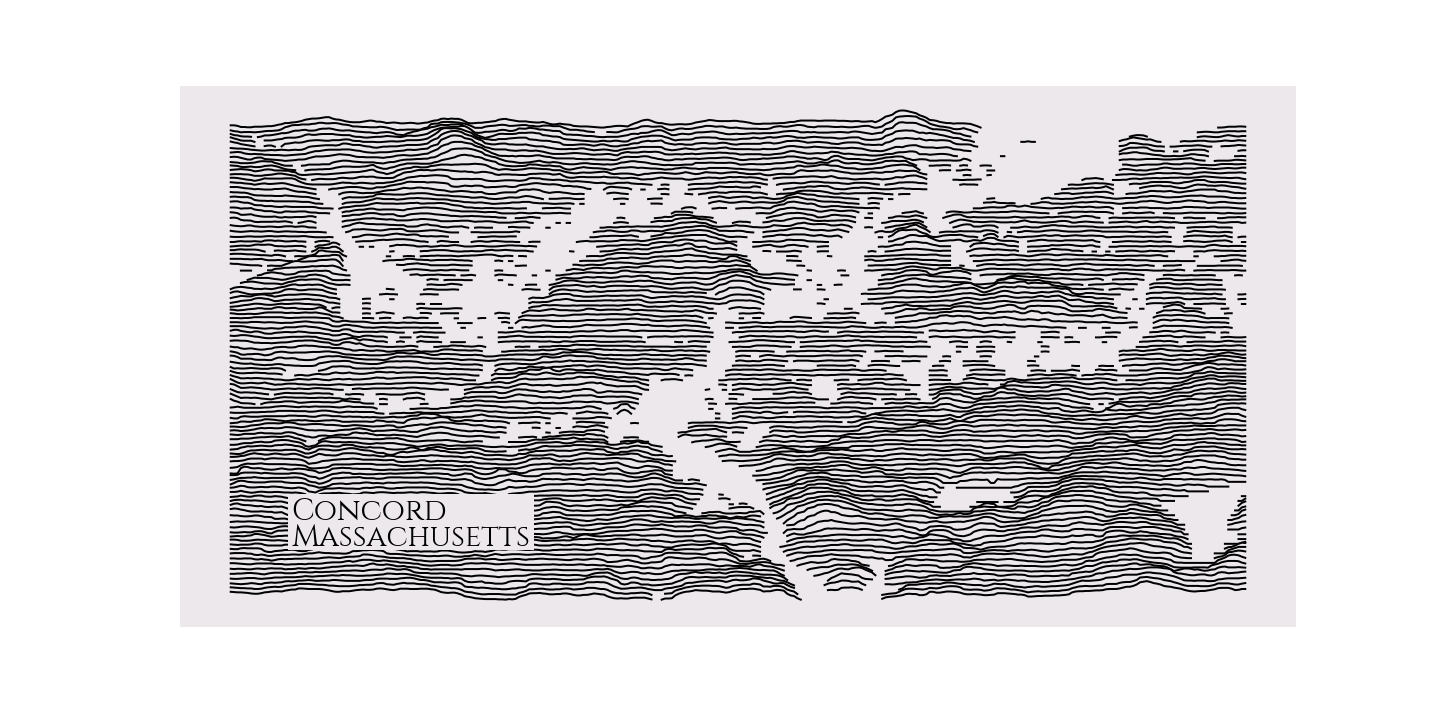
### What about Walden Pond?
It is that pleasant kettle pond in the bottom right of this map, looking entirely comfortable with its place in Western writing and thought.
```python
rm = RidgeMap((-71.418858,42.427511,-71.310024,42.481719))
values = rm.get_elevation_data(num_lines=100)
rm.plot_map(values=rm.preprocess(values=values, water_ntile=15, vertical_ratio=30),
label='Concord\nMassachusetts',
label_x=0.1,
label_size=30)
```
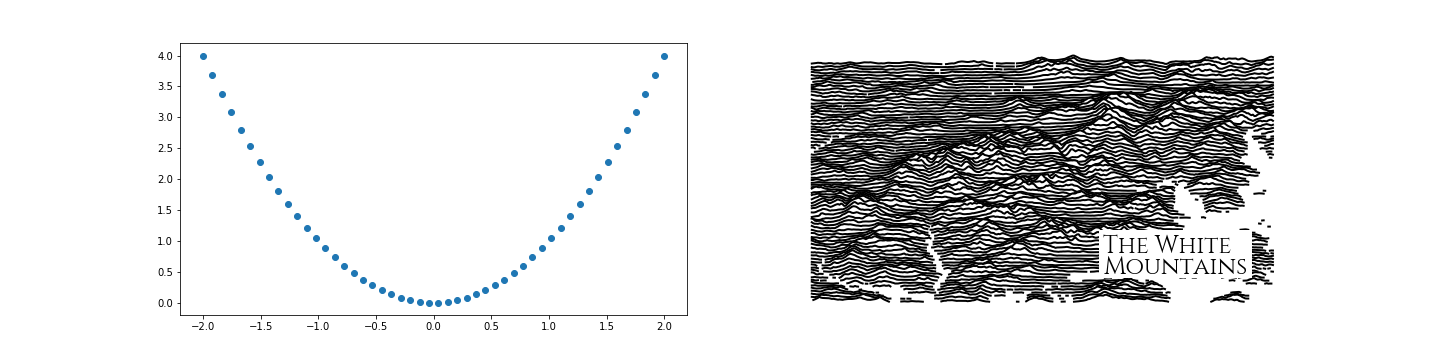
### Do you play nicely with other matplotlib figures?
Of course! If you really want to put a stylized elevation map in a scientific plot you are making, I am not going to stop you, and will actually make it easier for you. Just pass an argument for `ax` to `RidgeMap.plot_map`.
```python
import numpy as np
fig, axes = plt.subplots(ncols=2, figsize=(20, 5))
x = np.linspace(-2, 2)
y = x * x
axes[0].plot(x, y, 'o')
rm = RidgeMap()
rm.plot_map(label_size=24, background_color=(1, 1, 1), ax=axes[1])
```
User Examples
-------------
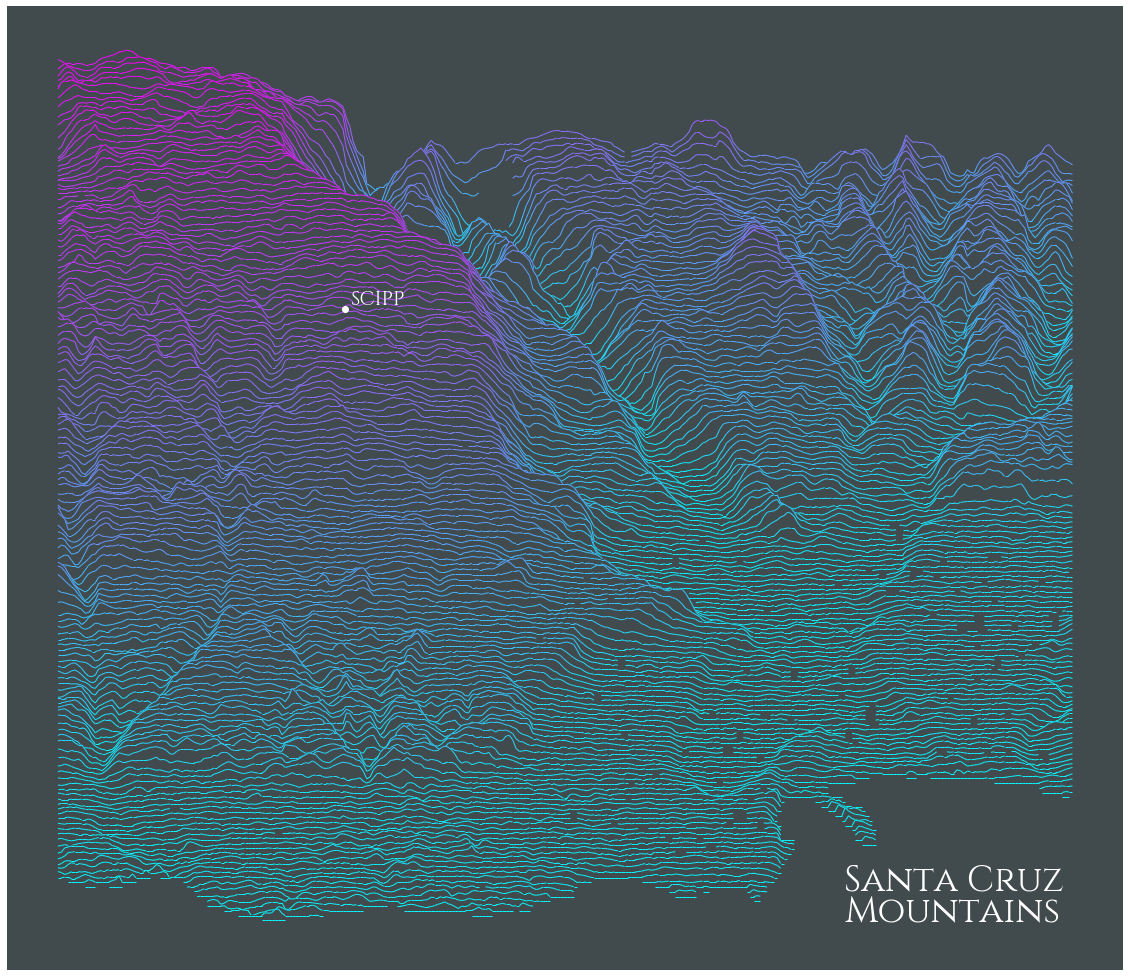
### Annotating, changing background color, custom text
This example shows how to annotate a lat/long on the map, and updates the color of the label text to allow for a dark background. Thanks to [kratsg](https://github.com/kratsg) for contributing.
```python
import matplotlib
import matplotlib.pyplot as plt
import numpy as np
bgcolor = np.array([65,74,76])/255.
scipp = (-122.060510, 36.998776)
rm = RidgeMap((-122.087116,36.945365,-121.999226,37.023250))
scipp_coords = ((scipp[0] - rm.longs[0])/(rm.longs[1] - rm.longs[0]),(scipp[1] - rm.lats[0])/(rm.lats[1] - rm.lats[0]))
values = rm.get_elevation_data(num_lines=150)
ridges = rm.plot_map(values=rm.preprocess(values=values,
lake_flatness=1,
water_ntile=0,
vertical_ratio=240),
label='Santa Cruz\nMountains',
label_x=0.75,
label_y=0.05,
label_size=36,
kind='elevation',
linewidth=1,
background_color=bgcolor,
line_color = plt.get_cmap('cool'))
# Bit of a hack to update the text label color
for child in ridges.get_children():
if isinstance(child, matplotlib.text.Text) and 'Santa Cruz' in child._text:
label_artist = child
break
label_artist.set_color('white')
ridges.text(scipp_coords[0]+0.005, scipp_coords[1]+0.005, 'SCIPP',
fontproperties=rm.font,
size=20,
color="white",
transform=ridges.transAxes,
verticalalignment="bottom",
zorder=len(values)+10)
ridges.plot(*scipp_coords, 'o',
color='white',
transform=ridges.transAxes,
ms=6,
zorder=len(values)+10)
```
#### Updated Annotation and Custom Text Color
The above code still works, but now there is a simplified method (Shown Below) that will produce the same image.
```python
import matplotlib.pyplot as plt
import numpy as np
from ridge_map import RidgeMap
bgcolor = np.array([65,74,76])/255.
rm = RidgeMap((-122.087116,36.945365,-121.999226,37.023250))
values = rm.get_elevation_data(num_lines=150)
values = rm.preprocess(
values=values,
lake_flatness=1,
water_ntile=0,
vertical_ratio=240
)
rm.plot_map(
values=values,
label='Santa Cruz\nMountains',
label_x=0.75,
label_y=0.05,
label_size=36,
label_color='white',
kind='elevation',
linewidth=1,
background_color=bgcolor,
line_color = plt.get_cmap('cool')
)
rm.plot_annotation(
label='SCIPP',
coordinates=(-122.060510, 36.998776),
x_offset=0.005,
y_offset=0.005,
label_size=20,
annotation_size=6,
color='white',
background=False
)
```
Elevation Data
--------------
Elevation data used by `ridge_map` comes from NASA's [Shuttle Radar Topography Mission](https://www2.jpl.nasa.gov/srtm/) (SRTM), high resolution topographic data collected in 2000, and released in 2015. SRTM data are sampled at a resolution of 1 arc-second (about 30 meters). SRTM data is provided to `ridge_map` via the python package `SRTM.py` ([link](https://github.com/tkrajina/srtm.py)). SRTM data is not available for latitudes greater than N 60° or less than S 60°:
