https://github.com/DKirwan/calendar-heatmap
A d3 heatmap for representing time series data similar to github's contribution chart
https://github.com/DKirwan/calendar-heatmap
d3 data-visualization heatmap javascript
Last synced: over 1 year ago
JSON representation
A d3 heatmap for representing time series data similar to github's contribution chart
- Host: GitHub
- URL: https://github.com/DKirwan/calendar-heatmap
- Owner: DKirwan
- License: mit
- Archived: true
- Created: 2016-02-16T20:54:30.000Z (over 10 years ago)
- Default Branch: master
- Last Pushed: 2020-08-09T18:04:29.000Z (almost 6 years ago)
- Last Synced: 2024-09-26T23:04:23.436Z (almost 2 years ago)
- Topics: d3, data-visualization, heatmap, javascript
- Language: JavaScript
- Homepage:
- Size: 232 KB
- Stars: 2,014
- Watchers: 37
- Forks: 145
- Open Issues: 16
-
Metadata Files:
- Readme: README.md
- License: LICENSE
Awesome Lists containing this project
- awesome-starred - DKirwan/calendar-heatmap - A d3 heatmap for representing time series data similar to github's contribution chart (data-visualization)
README
## This project is not actively maintained
# D3 Calendar Heatmap
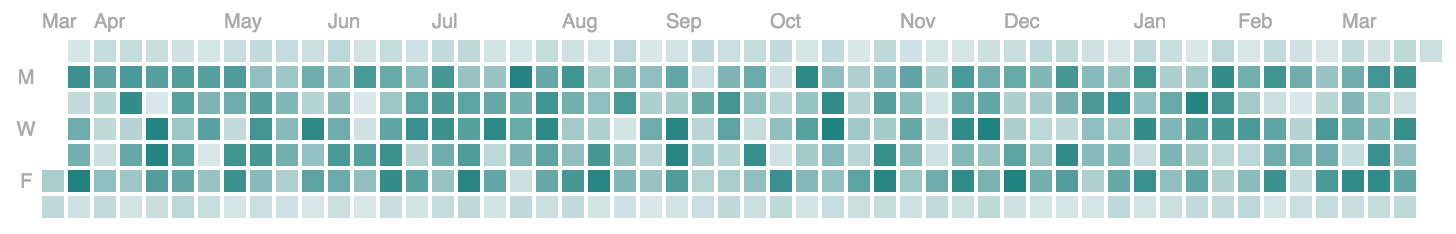
A [d3.js](https://d3js.org/) heatmap representing time series data. Inspired by Github's contribution chart
## Configuration
|Property | Usage | Default | Required |
|:------------- |:-------------|:-----:|:-----:|
| data | Chart data | none | yes |
| selector | DOM selector to attach the chart to | body | no |
| max | Maximum count | max found in data | no |
| startDate | Date to start heatmap at | 1 year ago | no |
| colorRange | Minimum and maximum chart gradient colors | ['#D8E6E7', '#218380'] | no |
| tooltipEnabled | Option to render a tooltip | true | no |
| tooltipUnit | Unit to render on the tooltip, can be object for pluralization control | 'contributions' | no |
| legendEnabled | Option to render a legend | true | no |
| onClick | callback function on day click events (see example below) | null | no |
| locale | Object to translate every word used, except for tooltipUnit | see below | no |
### Default locale object
```javascript
{
months: ['Jan', 'Feb', 'Mar', 'Apr', 'May', 'Jun', 'Jul', 'Aug', 'Sep', 'Oct', 'Nov', 'Dec'],
days: ['S', 'M', 'T', 'W', 'T', 'F', 'S'],
No: 'No',
on: 'on',
Less: 'Less',
More: 'More'
}
```
## Dependencies
* [d3.js](https://d3js.org/)
* [moment.js](http://momentjs.com/)
## Usage
1: Add d3.js and moment.js
2: Include calendar-heatmap.js and calendar-heatmap.css
``
``
3: Format the data so each array item has a `date` and `count` property.
As long as `new Date()` can parse the date string it's ok. Note - there all data should be rolled up into daily bucket granularity.
4: Configure the chart and render it
```javascript
// chart data example
var chartData = [{
date: valid Javascript date object,
count: Number
}];
var chart1 = calendarHeatmap()
.data(chartData)
.selector('#chart-one')
.colorRange(['#D8E6E7', '#218380'])
.tooltipEnabled(true)
.onClick(function (data) {
console.log('onClick callback. Data:', data);
});
chart1(); // render the chart
```
### control unit pluralization
```javascript
var chart1 = calendarHeatmap()
.data(chartData)
.tooltipUnit(
[
{min: 0, unit: 'contribution'},
{min: 1, max: 1, unit: 'contribution'},
{min: 2, max: 'Infinity', unit: 'contributions'}
]
);
chart1(); // render the chart
```
## Pull Requests and issues
...are very welcome!