https://github.com/Gowee/traceroute-map-panel
📍🗺️ Visualize traceroute paths on a map in a Grafana panel
https://github.com/Gowee/traceroute-map-panel
geoip grafana-panel traceroute
Last synced: 6 months ago
JSON representation
📍🗺️ Visualize traceroute paths on a map in a Grafana panel
- Host: GitHub
- URL: https://github.com/Gowee/traceroute-map-panel
- Owner: Gowee
- License: apache-2.0
- Created: 2020-04-30T03:31:33.000Z (over 5 years ago)
- Default Branch: master
- Last Pushed: 2022-12-11T03:59:16.000Z (almost 3 years ago)
- Last Synced: 2025-03-30T17:51:17.657Z (6 months ago)
- Topics: geoip, grafana-panel, traceroute
- Language: TypeScript
- Homepage:
- Size: 4.11 MB
- Stars: 39
- Watchers: 3
- Forks: 2
- Open Issues: 9
-
Metadata Files:
- Readme: README.md
- Changelog: CHANGELOG.md
- License: LICENSE
Awesome Lists containing this project
README

[](https://github.com/Gowee/traceroute-map-panel/releases/latest)

# Traceroute Map Panel
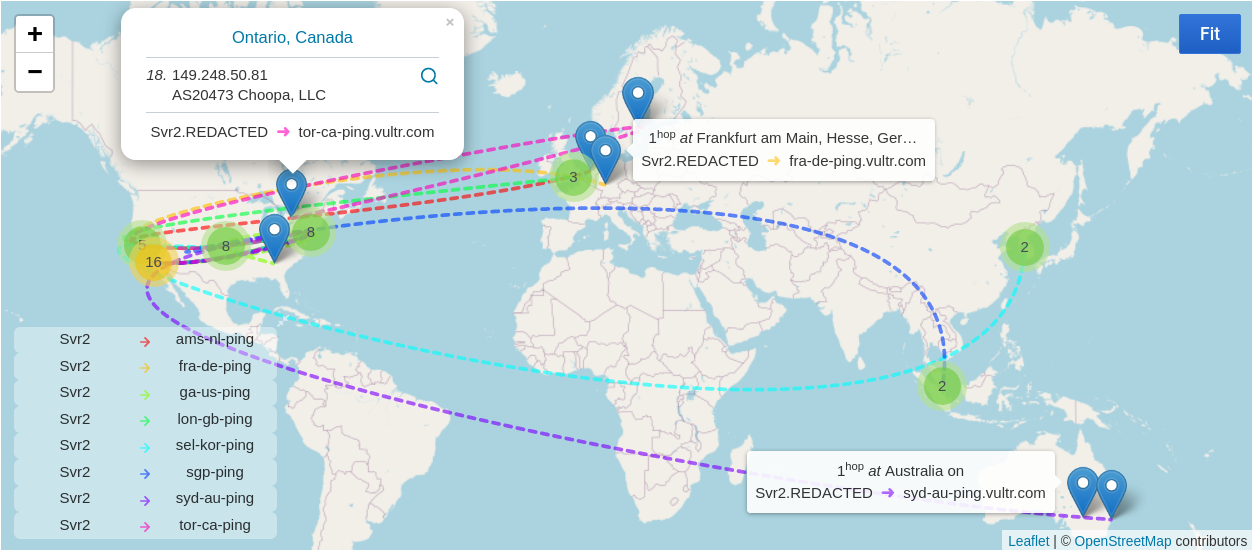
Traceroute Map Panel is a Grafana panel that visualize the [traceroute](https://en.wikipedia.org/wiki/Traceroute) hops in a map, just like [Besttrace](https://www.ipip.net/product/client.html).
**Online Demo**: https://trmp-demo.bamboo.workers.dev/
## Data
The panel expects traceroute data in the following schema, where fields order does not matter:
| Field | Type | Description |
|-|:-:|:-:|
| host | string | source host where the data is collected |
| dest | string | host where the trace is destinated |
| hop | number | nth hop |
| ip | string | IP address of the hop |
| rtt | number | round-trip time |
| loss | number | packet loss |
| time | number | timestamp, not used yet |
Typically, the traceroute data is collected from [MTR](https://github.com/traviscross/mtr/) via [Telegraf](https://github.com/influxdata/telegraf) and stored in [InfluxDB](https://github.com/influxdata/influxdb). It is also possible to use other datasource as long as the schema matches.
The wiki of Telegraf has [a sample config](https://github.com/influxdata/telegraf/wiki/Traceroute) utilizing the built-in [`[[inputs.exec]]`](https://github.com/influxdata/telegraf/tree/master/plugins/inputs/exec) for this.
## Setup
1. Install & Configure Telegraf and InfluxDB ([with InfluxQL](https://docs.influxdata.com/influxdb/v2.0/tools/grafana/)) properly. (Or other datasources that matches the expected schema.)
2. Refer to [the wiki of Telegraf](https://github.com/influxdata/telegraf/wiki/Traceroute) to configure MTR data collection as an input.
3. Optionally, explore database via the `influx` CLi tool, so that to make sure data is collected as expected. See [the query section](#preview-via-the-cli-tool-of-influxdb).
4. Install the Traceroute Map Panel plugin to Grafana. Two methods are available.
- Install manually via tarball:
1. Download [the latest tarball](https://github.com/Gowee/traceroute-map-panel/releases/latest), which is meant for Grafana 7.0+/8.0+. For Grafana 6.7.x, there is [v0.1.0](https://github.com/Gowee/traceroute-map-panel/releases/tag/v0.1.0).
2. Decompress & put tarball content into the Grafana plugin directory (usually `/var/lib/grafana/plugins`).
3. Restart Grafana.
- [Install via the `grafana-cli` tool](https://grafana.com/grafana/plugins/gowee-traceroutemap-panel/?tab=installation).
5. Create a new panel in Grafana:
1. Choose visualization "Traceroute Map Panel"
2. In the query editor of InfluxDB (in InfluxQL), toggle the text edit mode by clicking the pen icon and enter the query as suggested in [the query section](#query-in-grafana).
3. At the bottom of the editor, choose *FORMAT AS Table* instead of *Time Series*.
6. Setup a GeoIP API key and tweak other options, optionally. Finally, *Save* the panel.
### Query
#### Query in Grafana
For Grafana 7.1.2 and later.
```sql
select mean(avg) as rtt, mean(loss) as loss from mtr WHERE ${__to}ms - 5m <= time AND time <= ${__to}ms group by hop, ip, host, dest
```
__&__ *Format as __Table__*.
**Note**: The query is in InfluxQL instead of Flux.
In InfluxDB v1.x, only InfluxQL is available. So there is nothing to note especially.
In InfluxDB v2.0+, the default query lanugage is Flux. To successfully apply the query above, [create DBRP mappings to buckets](https://docs.influxdata.com/influxdb/v2.0/query-data/influxql/) and be sure to configure the InfluxDB datasource in Grafana with InfluxQL.
Alternative queries
For Grafana before 7.1.2, the following one is available.
```sql
select mean(avg) as rtt, mean(loss) as loss from mtr WHERE now() - 5m < time group by hop, ip, host, dest
```
Or (less recommended, see [Notes](#time-filter)):
```sql
select mean(avg) as rtt, mean(loss) as loss from mtr WHERE $timeFilter group by hop, ip, host, dest
```
__&__ *Format as __Table__*.
#### Preview via the CLi tool of InfluxDB
**Note**: The section is assuming InfluxDB v1.x / InfluxQL is used. Skip it when using InfluxDB v2.0+.
When previewing / exploring mtr data in InfluxDB via its CLi client. This following query that groups data by `host->dest` pair gives clearer result for reading.
```sql
select hop, ip, rtt, loss from (select mean(avg) as rtt, mean(loss) as loss from mtr WHERE now() - 6h < time AND time < now() group by hop, ip, host, dest) group by host, dest
```
## Geo IP
The panel relies on external API services for Geo IP resolving in the browser (not the backend). It ships with several built-in Geo IP APIs for convenience, which are not affiliated in any way with the panel.
An alternative way is to specify custom API or custom function (proper [CORS header](https://developer.mozilla.org/en-US/docs/Web/HTTP/CORS) is a must). A sample [Cloudflare Worker](https://workers.cloudflare.com/) script that proxies requests to some third-party service is located in [ipip-cfworker.js](https://github.com/Gowee/traceroute-map-panel/blob/master/ipip-cfworker.js).(No longer working due to the deprecation of that 3-rd party API. To be updated.)
**Be careful when sharing the panel or its snapshot publicly**, as it implies publicizing API keys ever saved in the options editor even for those which are not selected to be active. For now, the only safe way to share a snapshot is to create a new panel from scratch (instead of duplicating) and choose an API without the requirement of a key.
## Notes & Known Issues
### Time filter
The panel is not really time-series aware in the sense that it expects only a static route path for one src-dest pair.
If routing is dynamic (e.g. multiple route paths for one src-dest pair), paths displayed on the map may be fairly chaotic.
So it is generally a good idea to replace the default `$timeFilter` with a small range filter, such as `${__to}ms - 5m <= time AND time <= ${__to}ms` (last 5 mins in the time range).
### Telegraf config
A typical execution of mtr might take roughly a quarter of seconds to finish its hop probing. To avoid unnecessary work, especially when multiple mtr commands are configured, a bigger collection interval should be specified under `[[inputs.exec]]` to overwrite the global short default. Depending on the actual workload, `interval = 5m` or `1m` / `3m` / `10m` / ... would be reasonable. It is recommended to match this with [the one specifed in query](#time-filter). Besides, sometimes `timeout` needs to be increased (e.g. to `60s`) when there are multiple mtr commands to counter jam even though they are parallelized.
The sample config given in the wiki of Telegraf presumes mtr v0.94. If a different mtr is installed, the config may need adapting to match its actual output format.
### Invalid Schema
For "Invalid Schema" error, the problem might be just mismatched data schema. Or, the query data might not be [*Formatted as Table*](#query-in-grafana)) for the InfluxDB datasource.
### Spline and Animation
Since v0.3.0, the panel introduces two new options that allow converting the route path to spline (smooth curve) with optional animation. Both spline and animation are off by default due to the performance degration it brings. Obvious lags at a high zoom level is a known issue when animated spline is activated. Unfortunately, there is no plan to improve it for now.
----
This project is still too young to be stable enough. 🚀 Feel free to open a new issue if when encountering problems or having suggestions (even pointing out a typo would help a lot).