https://github.com/Grademark/grademark
An API for backtesting trading strategies in JavaScript and TypeScript.
https://github.com/Grademark/grademark
algorithmic-trading backtesting backtesting-trading-strategies data-forge drawdown drawdown-chart equity-curve javascript plot-charts quantitative-trading trade trading trading-strategies trading-strategy trading-system typescript
Last synced: over 1 year ago
JSON representation
An API for backtesting trading strategies in JavaScript and TypeScript.
- Host: GitHub
- URL: https://github.com/Grademark/grademark
- Owner: Grademark
- License: mit
- Created: 2018-10-20T08:57:40.000Z (over 7 years ago)
- Default Branch: master
- Last Pushed: 2023-03-02T10:48:46.000Z (over 3 years ago)
- Last Synced: 2024-09-19T09:48:34.531Z (almost 2 years ago)
- Topics: algorithmic-trading, backtesting, backtesting-trading-strategies, data-forge, drawdown, drawdown-chart, equity-curve, javascript, plot-charts, quantitative-trading, trade, trading, trading-strategies, trading-strategy, trading-system, typescript
- Language: TypeScript
- Homepage: http://www.the-data-wrangler.com/
- Size: 456 KB
- Stars: 273
- Watchers: 14
- Forks: 33
- Open Issues: 13
-
Metadata Files:
- Readme: README.md
- Funding: .github/FUNDING.yml
- License: LICENSE
Awesome Lists containing this project
README
# Grademark
Toolkit for algo trading and backtesting in JavaScript and TypeScript.
This API builds on [Data-Forge](http://data-forge-js.com/) and is best used from [Data-Forge Notebook](http://www.data-forge-notebook.com/) (making it easy to plot charts and visualize).
Check out the [release notes](release-notes.md) to see updates and breaking changes.
[Click here to support my work](https://www.codecapers.com.au/about#support-my-work)
Please see what this looks like in [the Grademark first example](https://github.com/grademark/grademark-first-example) and the unit tests in this repo.
Love this? Please star this repo!
## First example
From the [Grademark first example](https://github.com/grademark/grademark-first-example) here's some example output. [Click to see the first example as a notebook.](https://grademark.github.io/grademark-first-example/)
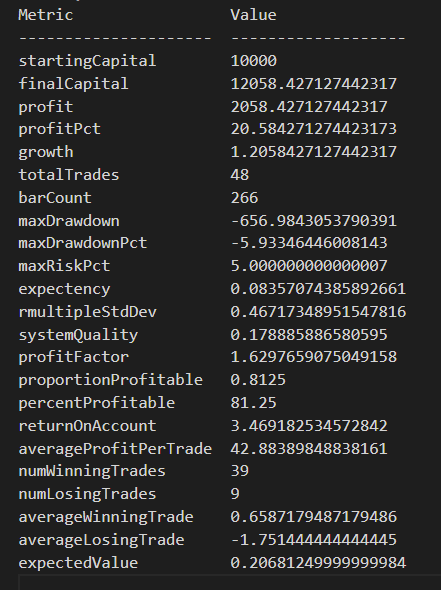
Analysis of a sequence of trades looks like this:
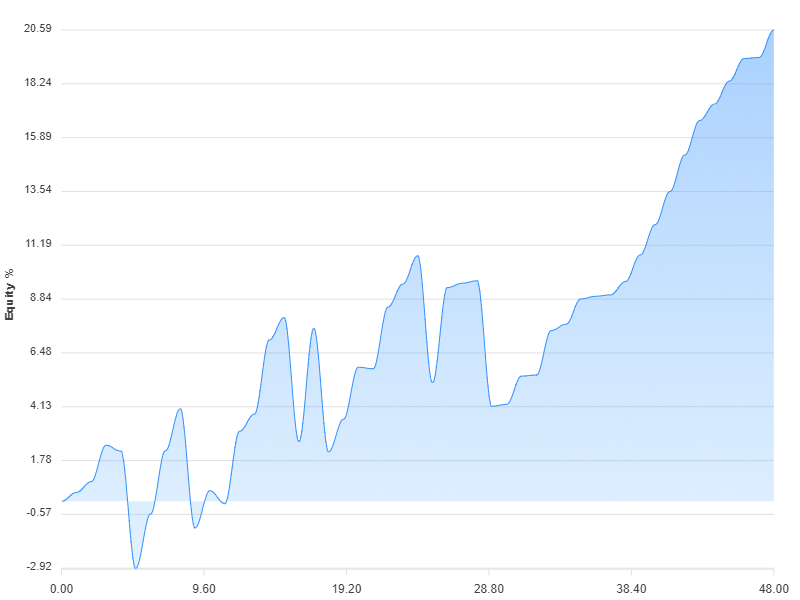
Here's a chart that visualizes the equity curve for the example strategy:
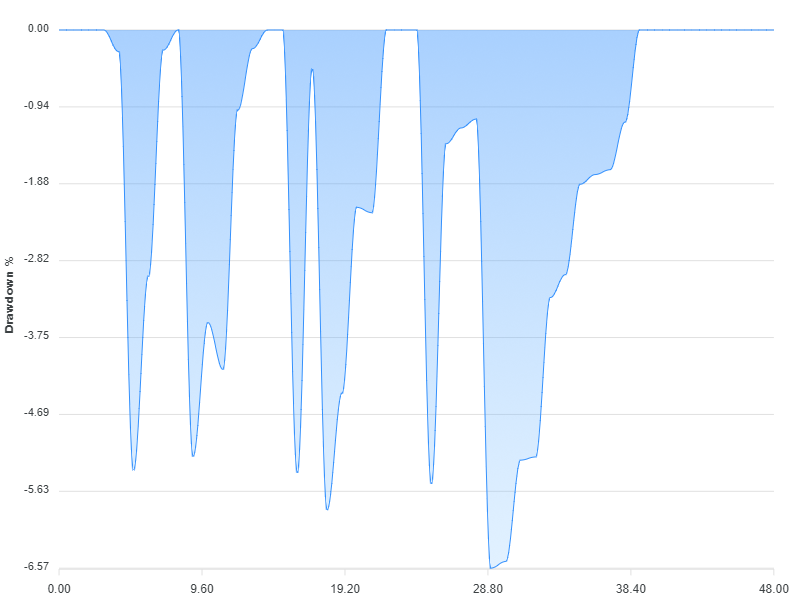
Here's another chart, this one is a visualization of the drawdown for the example strategy:
## Pre-requisites
- Make sure your data is sorted in forward chronological order.
## Data format
Your data needs to be loaded into memory in the following format:
```typescript
interface IBar {
time: Date;
open: number;
high: number;
low: number;
close: number;
}
const data: IBar[] = ... load your data ...
```
## Features
- Define a trading strategy with entry and exit rules.
- Backtest a trading strategy on a single financial instrument.
- Apply custom indicators to your input data series.
- Specify lookback period.
- Built-in intrabar stop loss.
- Compute and plot equity curve and drawdown charts.
- Throughly covered by automated tests.
- Calculation of risk and rmultiples.
- Intrabar profit target.
- Intrabar trailing stop loss.
- Conditional buy on price level (intrabar).
- Monte carlo simulation.
- Multiple parameter optimization based on permutations of parameters (using grid search and hill-climb algorithms).
- Walk forward optimization and backtesting.
- Plot a chart of trailing stop loss.
- Short selling.
[Data-Forge Notebook](https://www.data-forge-notebook.com/) comes with example JavaScript notebooks that demonstrate many of these features.
If you need help with new features please reach out!
## Maybe coming later
- Support for precise decimal numbers.
- Fees.
- Slippage.
- Position sizing.
- Testing multiple instruments / portfolio simulation / ranking instruments.
- Market filters.
## Complete examples
For a ready to go example please see the repo [grademark-first-example](https://github.com/grademark/grademark-first-example).
## Usage
Instructions here are for JavaScript, but this library is written in TypeScript and so it can also be used from TypeScript.
### Installation
npm install --save grademark
### Import modules
```javascript
const dataForge = require('data-forge');
require('data-forge-fs'); // For file loading capability.
require('data-forge-indicators'); // For the moving average indicator.
require('data-forge-plot'); // For rendering charts.
const { backtest, analyze, computeEquityCurve, computeDrawdown } = require('grademark');
```
### Load your data
Use [Data-Forge](http://data-forge-js.com/) to load and prep your data, make sure your data is sorted in forward chronological order.
This example loads a CSV file, but feel free to load your data from REST API, database or wherever you want!
```javascript
let inputSeries = dataForge.readFileSync("STW.csv")
.parseCSV()
.parseDates("date", "D/MM/YYYY")
.parseFloats(["open", "high", "low", "close", "volume"])
.setIndex("date") // Index so we can later merge on date.
.renameSeries({ date: "time" });
```
The example data file is available in [the example repo](https://github.com/grademark/grademark-first-example).
### Add indicators
Add whatever indicators and signals you want to your data.
```javascript
const movingAverage = inputSeries
.deflate(bar => bar.close) // Extract closing price series.
.sma(30); // 30 day moving average.
inputSeries = inputSeries
.withSeries("sma", movingAverage) // Integrate moving average into data, indexed on date.
.skip(30) // Skip blank sma entries.
```
### Create a strategy
This is a very simple and very naive mean reversion strategy:
```javascript
const strategy = {
entryRule: (enterPosition, args) => {
if (args.bar.close < args.bar.sma) { // Buy when price is below average.
enterPosition({ direction: "long" }); // Long is default, pass in "short" to short sell.
}
},
exitRule: (exitPosition, args) => {
if (args.bar.close > args.bar.sma) {
exitPosition(); // Sell when price is above average.
}
},
stopLoss: args => { // Optional intrabar stop loss.
return args.entryPrice * (5/100); // Stop out on 5% loss from entry price.
},
};
```
### Running a backtest
Backtest your strategy, then compute and print metrics:
```javascript
const trades = backtest(strategy, inputSeries)
console.log("Made " + trades.length + " trades!");
const startingCapital = 10000;
const analysis = analyze(startingCapital, trades);
console.log(analysis);
```
### Visualizing the results
Use [Data-Forge Plot](https://github.com/data-forge/data-forge-plot) to visualize the equity curve and drawdown chart from your trading strategy:
```javascript
computeEquityCurve(trades)
.plot()
.renderImage("output/my-equity-curve.png");
computeDrawdown(trades)
.plot()
.renderImage("output/my-drawdown.png");
```
## Advanced backtesting
We are only just getting started in this example to learn more please follow my [blog](http://www.the-data-wrangler.com/) and [YouTube channel](https://www.youtube.com/channel/UCOxw0jy384_wFRwspgq7qMQ).
## Resources
- [Data-Forge](http://data-forge-js.com/)
- [Data-Forge Notebook](http://www.data-forge-notebook.com/)
## Support the developer