https://github.com/HON95/prometheus-nut-exporter
A Prometheus exporter for Network UPS Tools (NUT)
https://github.com/HON95/prometheus-nut-exporter
network-ups-tools prometheus-exporter
Last synced: over 1 year ago
JSON representation
A Prometheus exporter for Network UPS Tools (NUT)
- Host: GitHub
- URL: https://github.com/HON95/prometheus-nut-exporter
- Owner: HON95
- License: gpl-3.0
- Created: 2020-05-20T10:55:40.000Z (about 6 years ago)
- Default Branch: master
- Last Pushed: 2022-08-03T07:44:09.000Z (almost 4 years ago)
- Last Synced: 2024-02-13T21:45:00.026Z (over 2 years ago)
- Topics: network-ups-tools, prometheus-exporter
- Language: Rust
- Homepage:
- Size: 112 KB
- Stars: 70
- Watchers: 4
- Forks: 15
- Open Issues: 6
-
Metadata Files:
- Readme: README.md
- Changelog: CHANGELOG.md
- License: LICENSE
Awesome Lists containing this project
README
# Prometheus NUT Exporter
[](https://github.com/HON95/prometheus-nut-exporter/releases)
[](https://github.com/HON95/prometheus-nut-exporter/actions?query=workflow%3ACI)
[](https://app.fossa.com/projects/git%2Bgithub.com%2FHON95%2Fprometheus-nut-exporter?ref=badge_shield)
[](https://hub.docker.com/r/hon95/prometheus-nut-exporter)
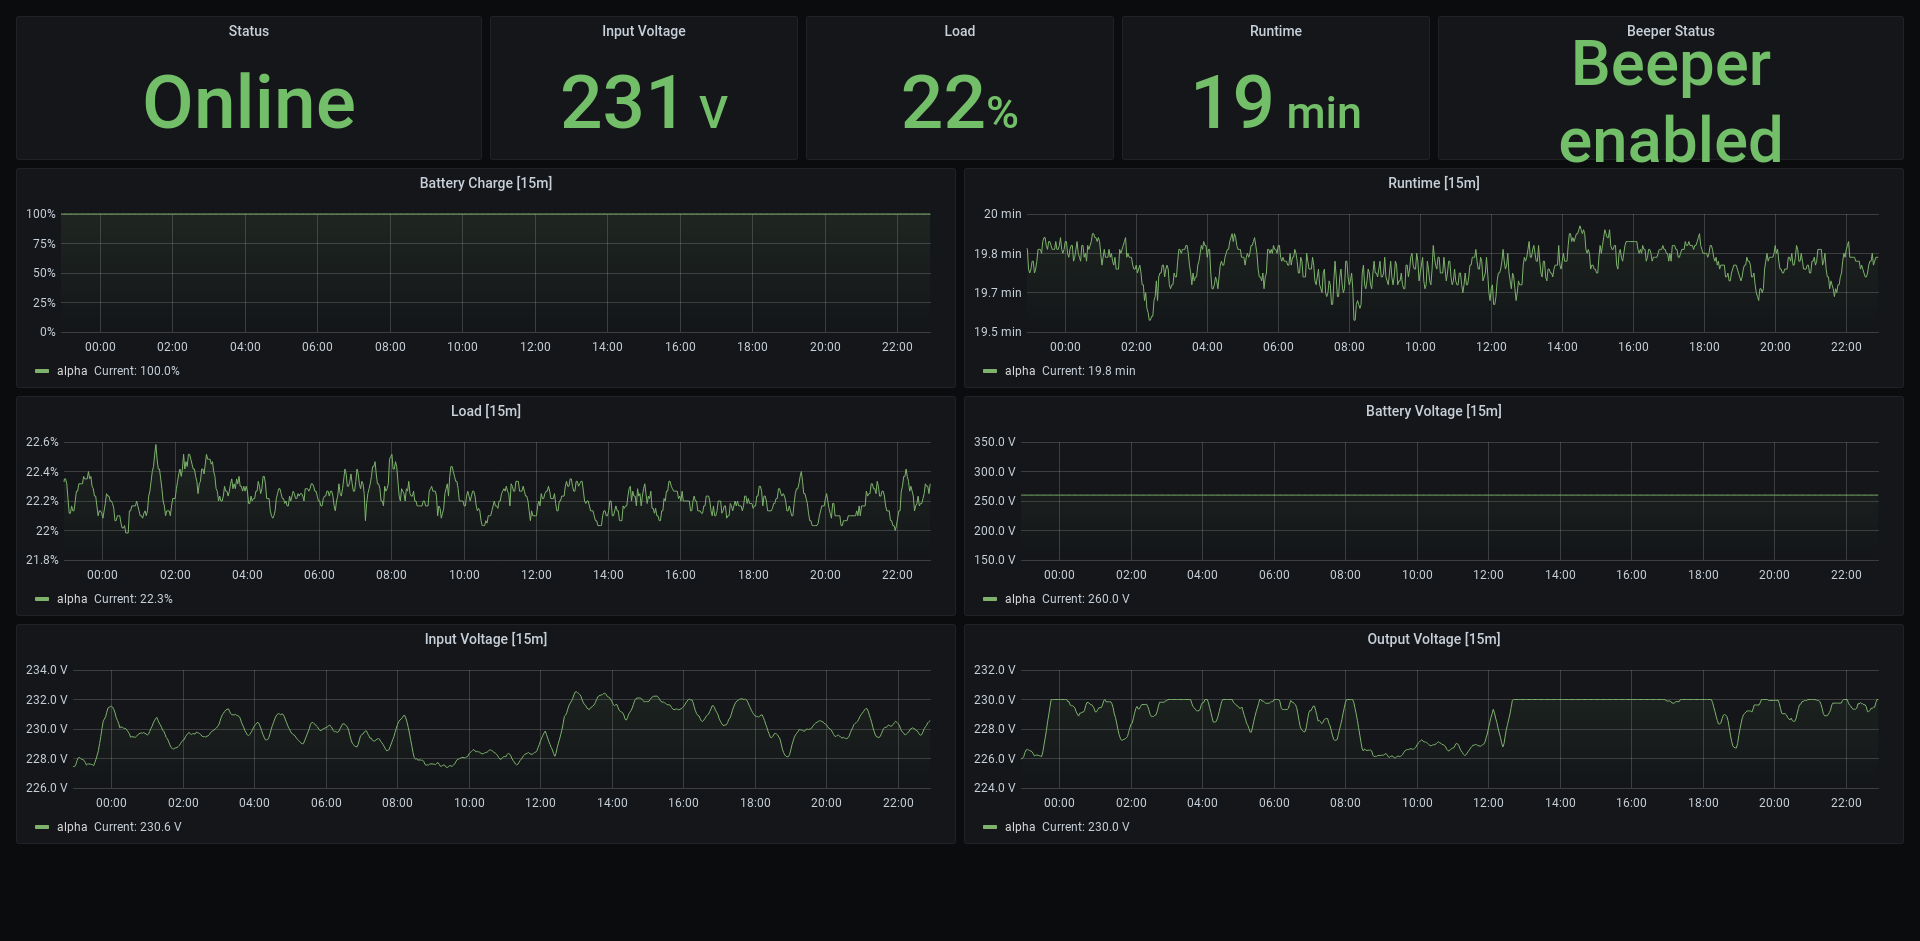
A Prometheus/OpenMetrics exporter for uninterruptable power supplies (UPSes) using Network UPS Tools (NUT).
## Usage
### NUT
Set up NUT in server mode and make sure the TCP port (3493 by default) is accessible (without authentication).
If you want to test that it's working, run `telnet 3493` and then `VER`, `LIST UPS` and `LIST VAR `.
### Docker
Example `docker-compose.yml`:
```yaml
version: "3.7"
services:
nut-exporter:
# Stable v1
image: hon95/prometheus-nut-exporter:1
environment:
- TZ=Europe/Oslo
- HTTP_PATH=/metrics
# Defaults
#- RUST_LOG=info
#- HTTP_PORT=9995
#- HTTP_PATH=/nut
#- LOG_REQUESTS_CONSOLE=false
#- PRINT_METRICS_AND_EXIT=false
ports:
- "9995:9995/tcp"
```
### Prometheus
Example `prometheus.yml`:
```yaml
global:
scrape_interval: 15s
scrape_timeout: 10s
scrape_configs:
- job_name: "nut"
static_configs:
# Insert NUT server address here
- targets: ["nut-server:3493"]
relabel_configs:
- source_labels: [__address__]
target_label: __param_target
- source_labels: [__param_target]
target_label: instance
- target_label: __address__
# Insert NUT exporter address here
replacement: nut-exporter:9995
```
In the above example, `nut-exporter:9995` is the address and port of the NUT _exporter_ while `nut-server:3493` is the address and port of the NUT _server_ to query through the exporter.
### Kubernetes Resource Usage
Example container resources requests and limits.
This was done by scraping one NUT server with two UPSes.
Resource usage was observed across 7 days period.
This can be lowered even more but should be sufficient as a starting point.
```yaml
resources:
limits:
cpu: "10m"
memory: "16Mi"
requests:
cpu: "1m"
memory: "8Mi"
```
### Grafana
[Example dashboard](https://grafana.com/grafana/dashboards/14371)
## Configuration
### Docker Image Versions
Use e.g. `1` for stable v1.y.z releases and `latest` for bleeding/dev/unstable releases.
### Environment Variables
- `RUST_LOG` (defaults to `info`): The log level used by the console/STDOUT. Set to `debug` so show HTTP requests and `trace` to show extensive debugging info.
- `HTTP_ADDRESS` (defaults to `::`): The HTTP server will listen on this IP. Set to `127.0.0.1` or `::1` to only allow local access.
- `HTTP_PORT` (defaults to `9995`): The HTTP server port.
- `HTTP_PATH` (defaults to `nut`): The HTTP server metrics path. You may want to set it to `/metrics` on new setups to avoid extra Prometheus configuration (not changed here due to compatibility).
- `PRINT_METRICS_AND_EXIT` (defaults to `false`): Print a Markdown-formatted table consisting of all metrics and then immediately exit. Used mainly for generating documentation.
## Metrics
See [metrics](metrics.md).
## License
GNU General Public License version 3 (GPLv3).