https://github.com/JosephBARBIERDARNAL/pypalettes
A large (+2500) collection of color maps for Python
https://github.com/JosephBARBIERDARNAL/pypalettes
cmap color matplotlib visualization
Last synced: 8 months ago
JSON representation
A large (+2500) collection of color maps for Python
- Host: GitHub
- URL: https://github.com/JosephBARBIERDARNAL/pypalettes
- Owner: JosephBARBIERDARNAL
- License: other
- Created: 2024-05-30T18:46:27.000Z (over 1 year ago)
- Default Branch: main
- Last Pushed: 2025-02-21T16:41:45.000Z (8 months ago)
- Last Synced: 2025-02-21T17:41:40.456Z (8 months ago)
- Topics: cmap, color, matplotlib, visualization
- Language: Python
- Homepage: https://python-graph-gallery.com/color-palette-finder/
- Size: 41.7 MB
- Stars: 291
- Watchers: 3
- Forks: 9
- Open Issues: 1
-
Metadata Files:
- Readme: README.md
- License: LICENSE.note
Awesome Lists containing this project
- awesome-data-analysis - PyPalettes - A large (+2500) collection of color maps for Python. (📊 Data Visualization / Tools)
- awesome-data-analysis - PyPalettes - A large (+2500) collection of color maps for Python. (📊 Data Visualization / Tools)
README
> PyPalettes is supported by [Matplotlib Journey](https://www.matplotlib-journey.com/), an interactive online course designed to make you a master of Matplotlib. If you want to **support PyPalettes** and **become a Matplotlib expert**, consider purchasing the course!
# PyPalettes

A large (**+2500**) collection of color maps for Python.
- All available palettes can be found in the [Color Palette Finder](https://python-graph-gallery.com/color-palette-finder/).
- To learn more about how to use `pypalettes`, please refer to the [official documentation](https://python-graph-gallery.com/introduction-to-pypalettes/).

> This package is based on the R package [paletteer](https://github.com/EmilHvitfeldt/paletteer), and all associated sub-packages (with original palettes) mentioned in the [LICENSE](LICENSE.note) file.
## Installation
With pip:
```bash
pip install pypalettes
```
With conda:
```bash
conda install conda-forge::pypalettes
```
## Quick start
Once `pypalettes` is imported, all the palettes are now accessible as any other colormap in matplotlib or seaborn via the `palette` or `cmap` arguments.
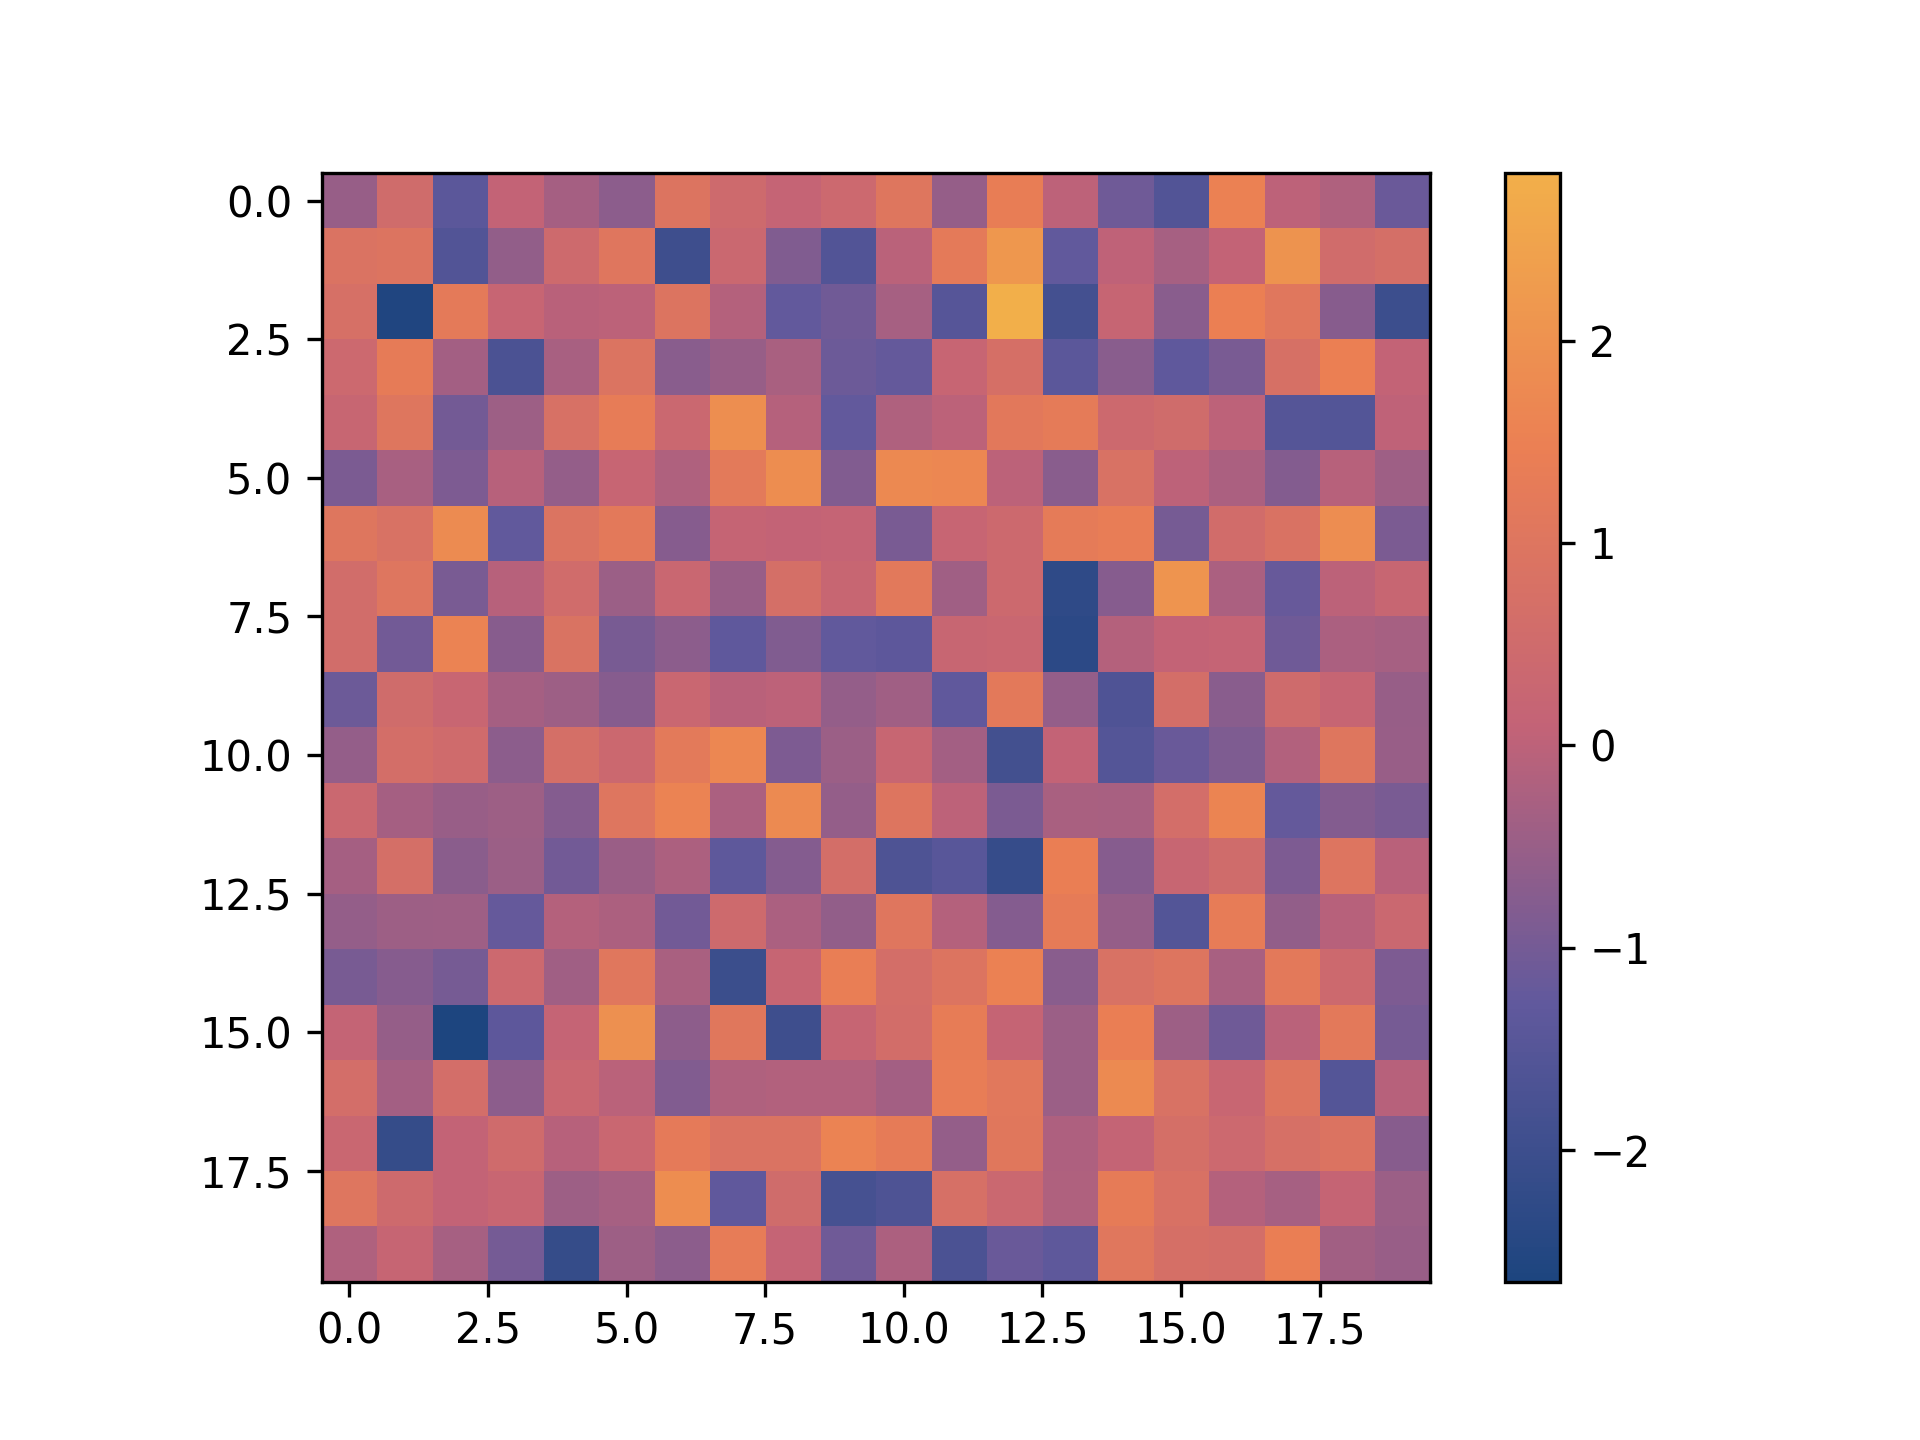
#### Continuous palette
```python
import matplotlib.pyplot as plt
import numpy as np
from pypalettes import load_cmap
cmap = load_cmap("Sunset2", cmap_type="continuous")
data = np.random.randn(20, 20)
plt.imshow(data, cmap=cmap)
plt.colorbar()
plt.show()
```
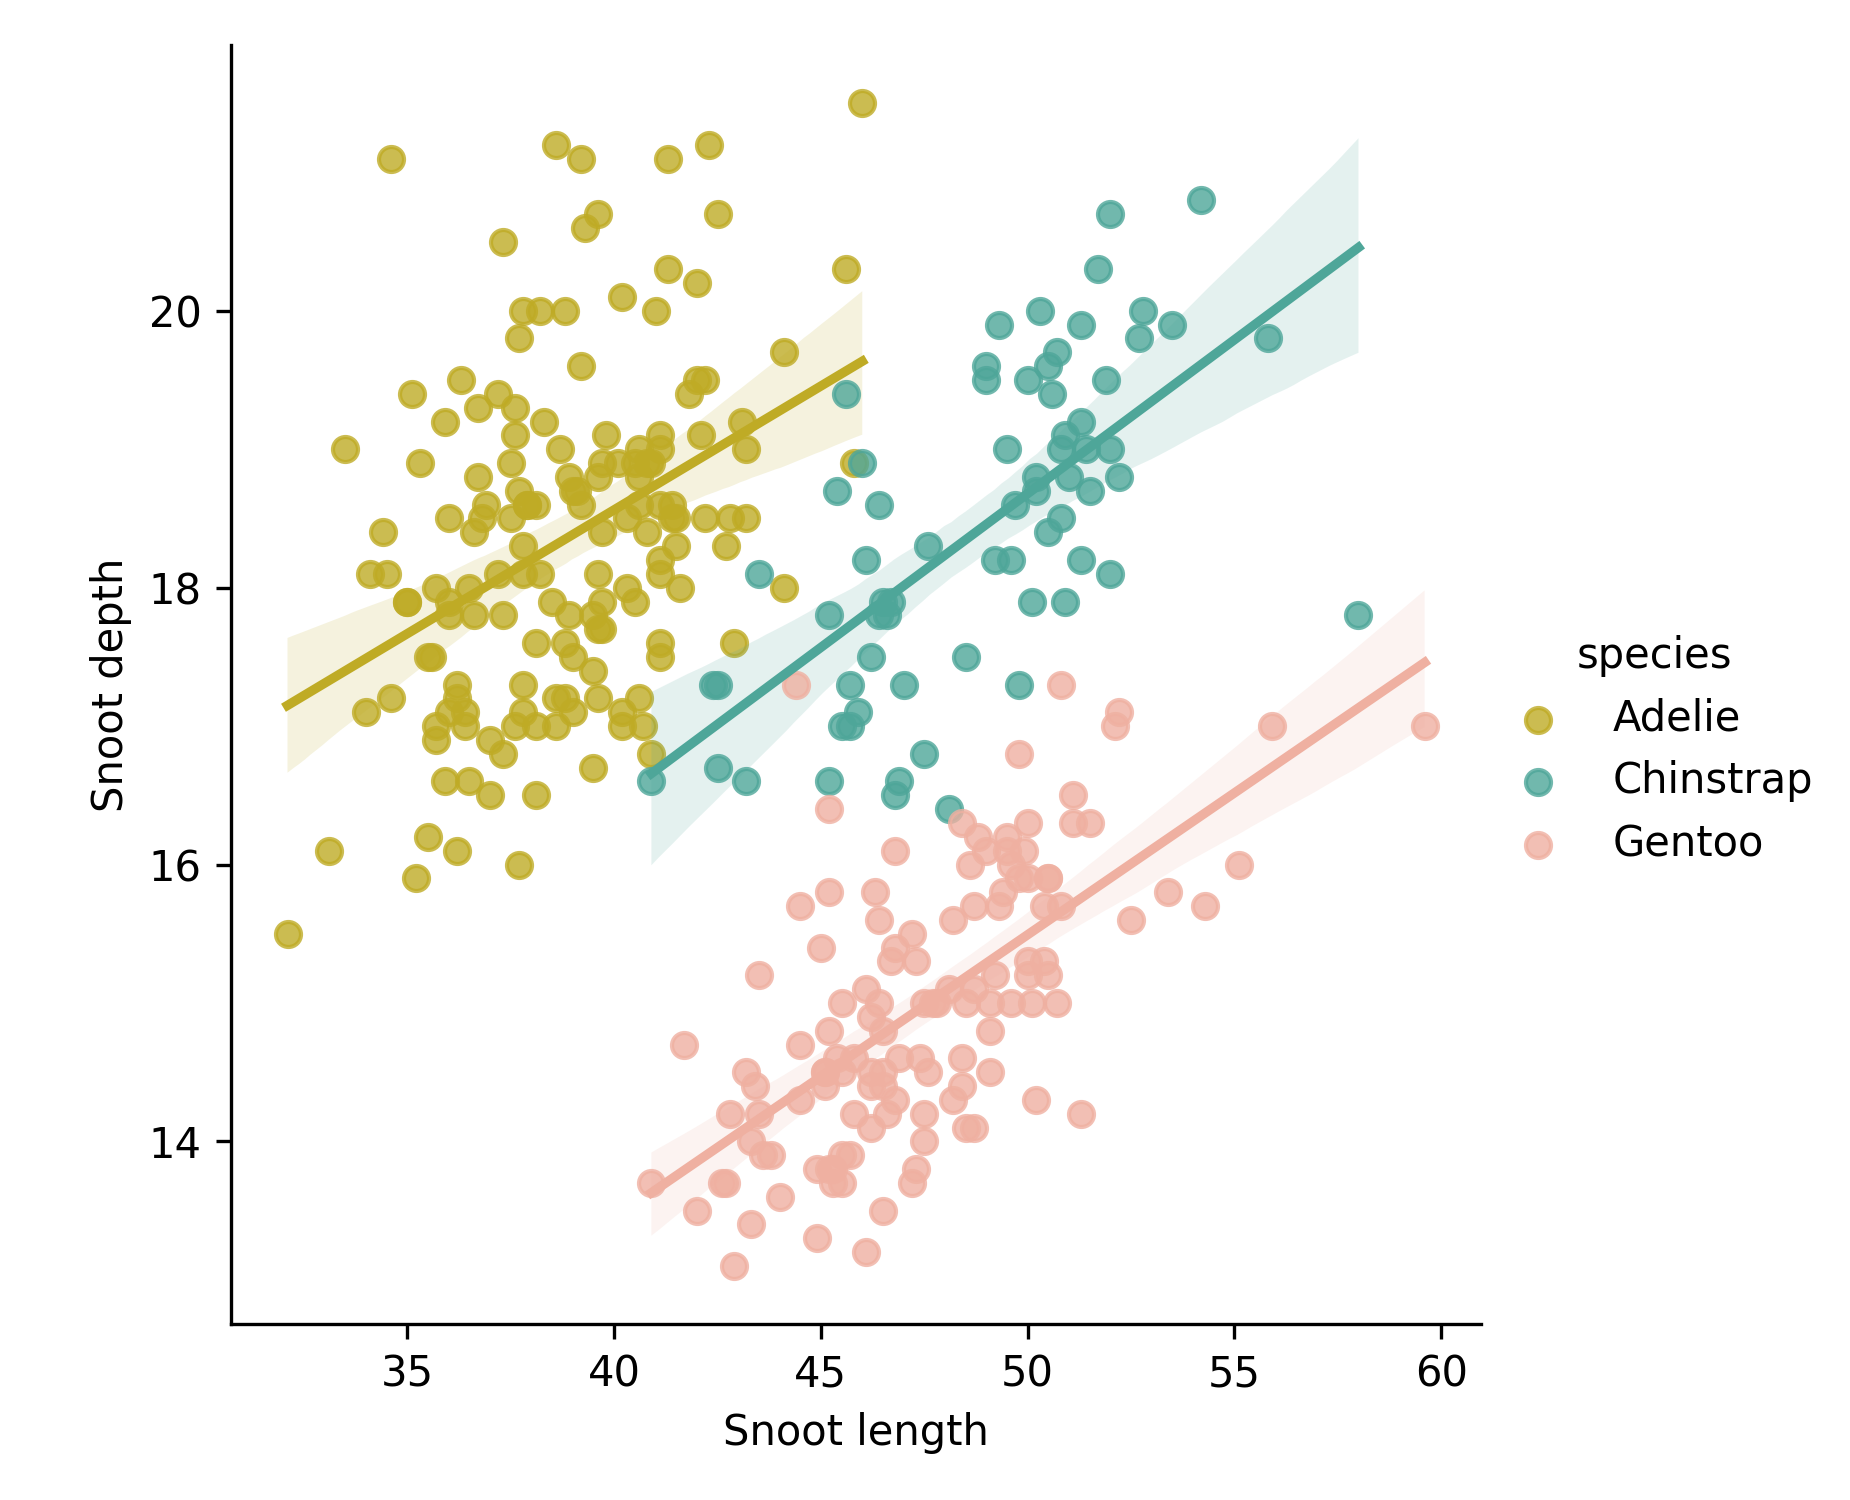
#### Categorical palette
```python
import matplotlib.pyplot as plt
import seaborn as sns
from pypalettes import load_cmap
cmap = load_cmap("Fun")
palette = cmap.colors # return colors as a list of hexadecimal values
df = sns.load_dataset("penguins")
g = sns.lmplot(
data=df,
x="bill_length_mm",
y="bill_depth_mm",
hue="species",
palette=palette,
)
g.set_axis_labels("Snoot length", "Snoot depth")
plt.show()
```
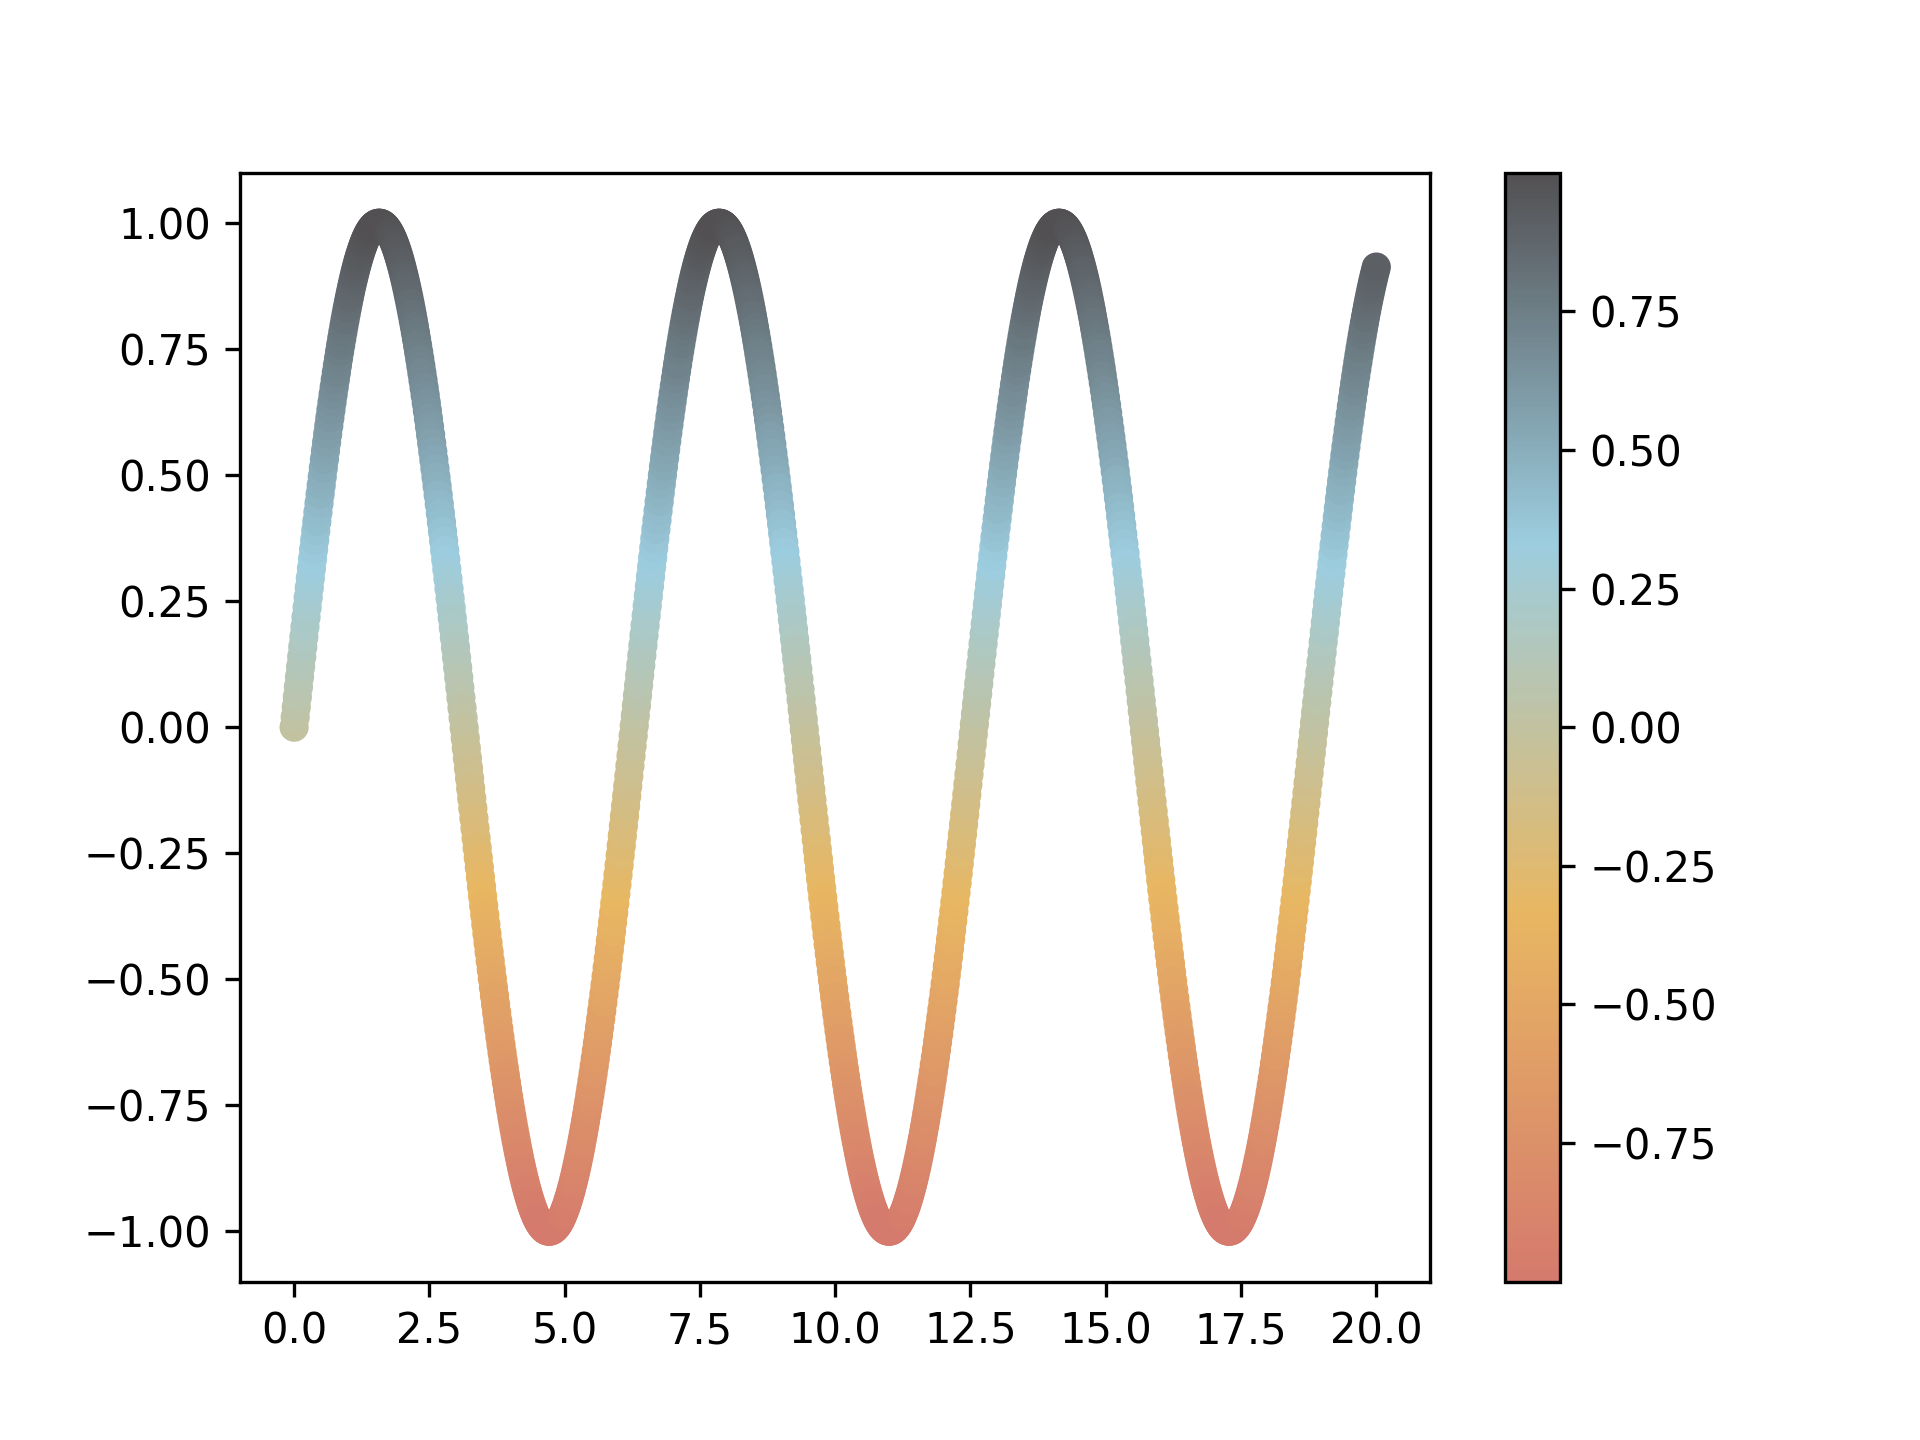
#### Your own palette
```python
import matplotlib.pyplot as plt
from pypalettes import add_cmap
import numpy as np
cmap = add_cmap(
colors=["#D57A6DFF", "#E8B762FF", "#9CCDDFFF", "#525052FF"],
name="myCmap",
cmap_type="continuous",
)
x = np.linspace(0, 20, 1000)
y = np.sin(x)
plt.scatter(x, y, c=y, cmap=cmap)
plt.colorbar()
plt.show()
```
[Going further](https://python-graph-gallery.com/introduction-to-pypalettes/)
## Features
- Add +2500 native palettes to matplotlib and seaborn
- Load, customise and combine +2500 palettes
- Create your own palettes
To find out more about using PyPalettes, use this [PyPalettes guide](https://python-graph-gallery.com/introduction-to-pypalettes/).
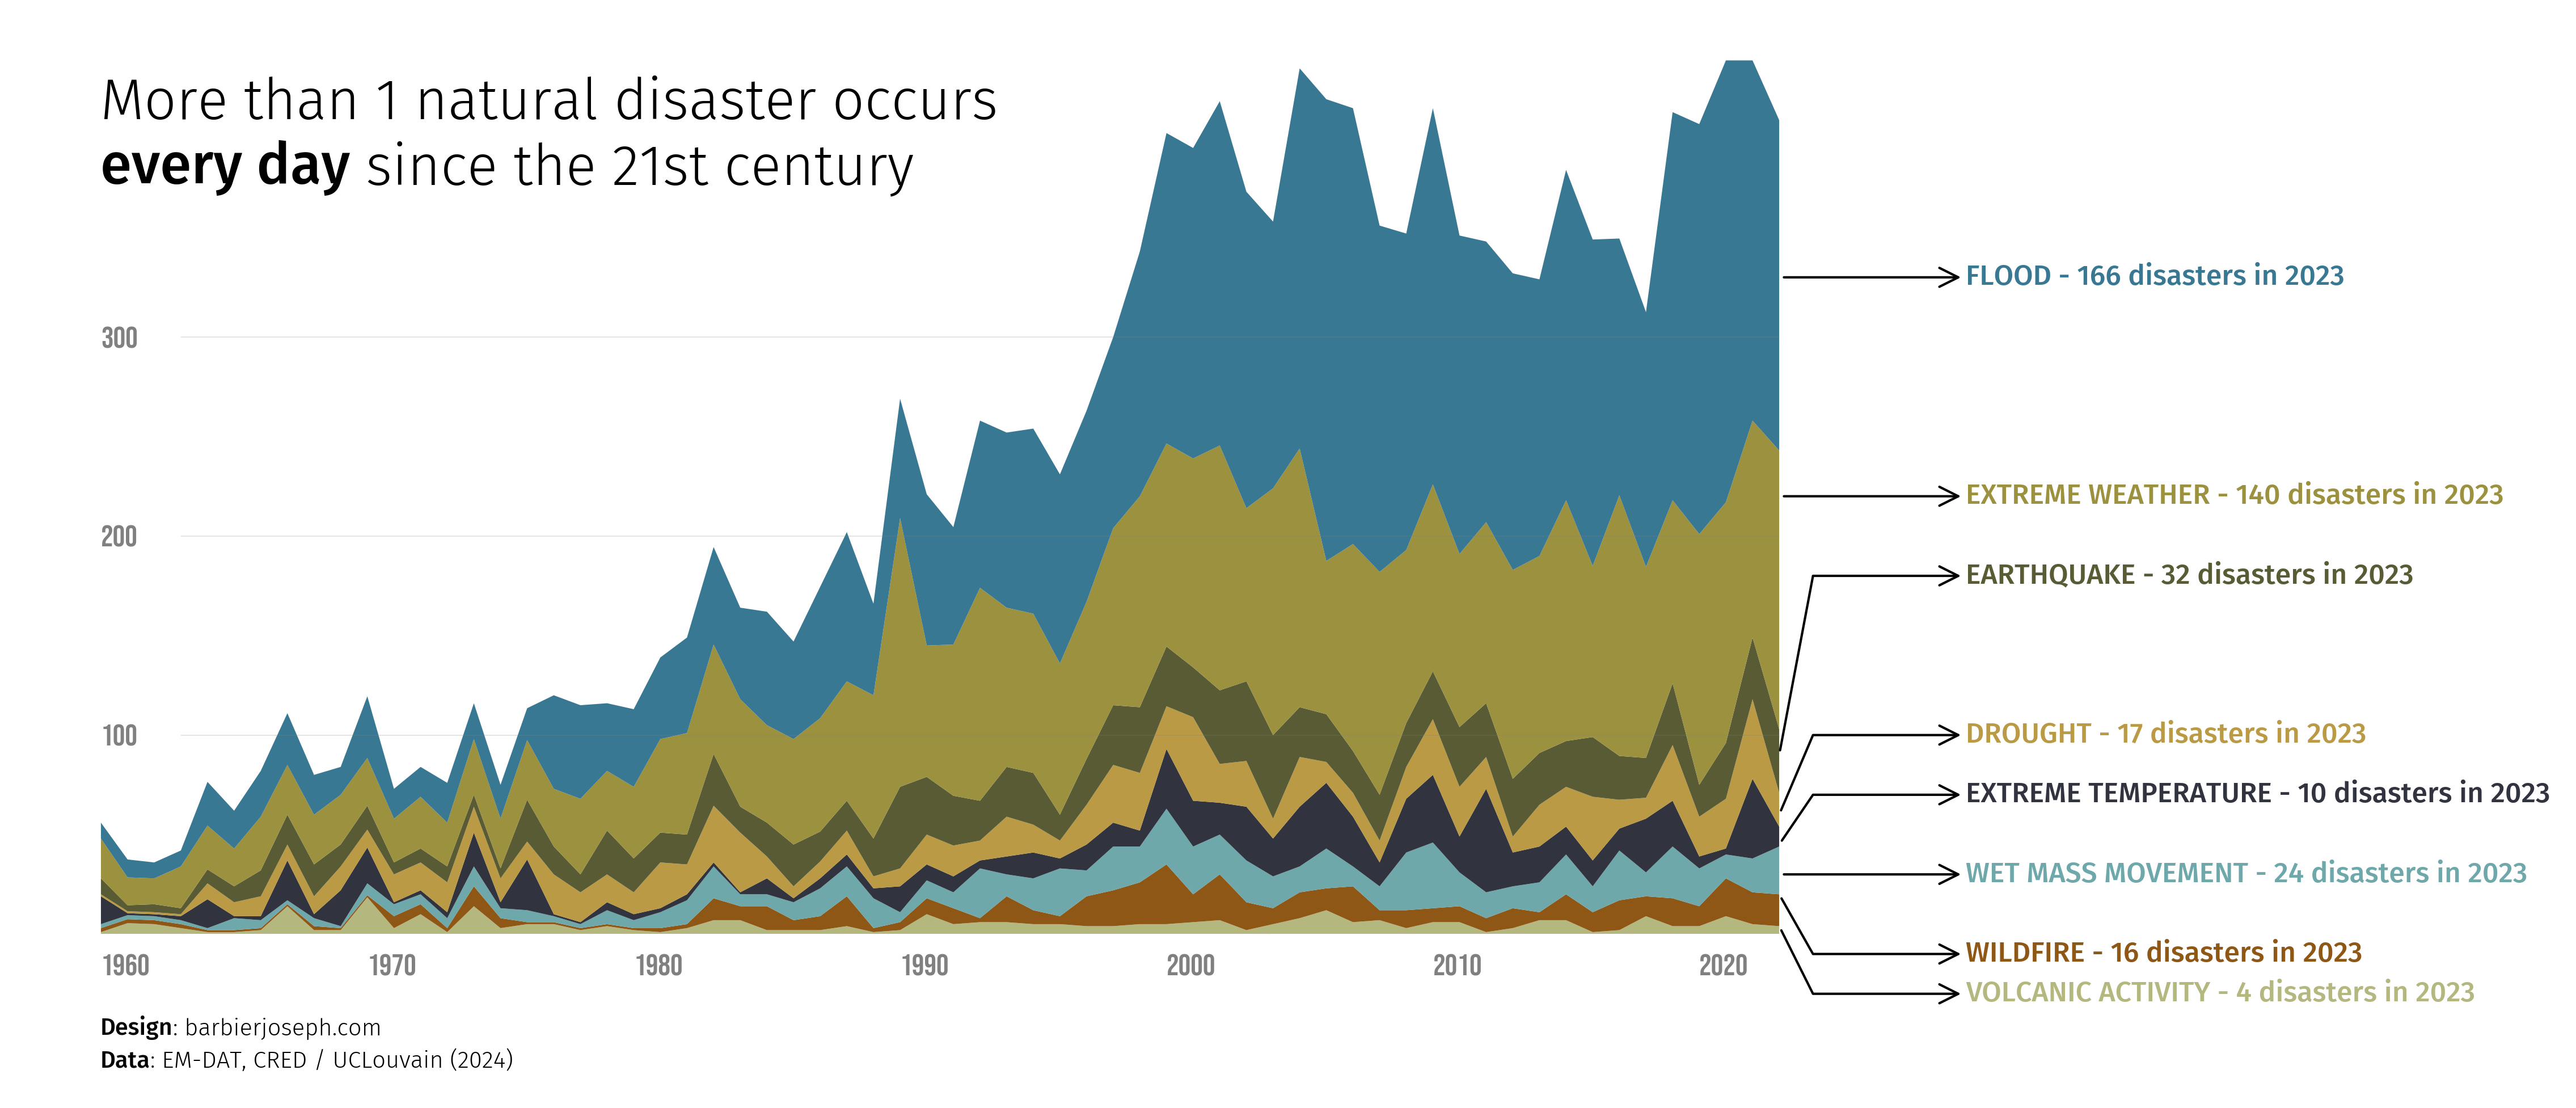
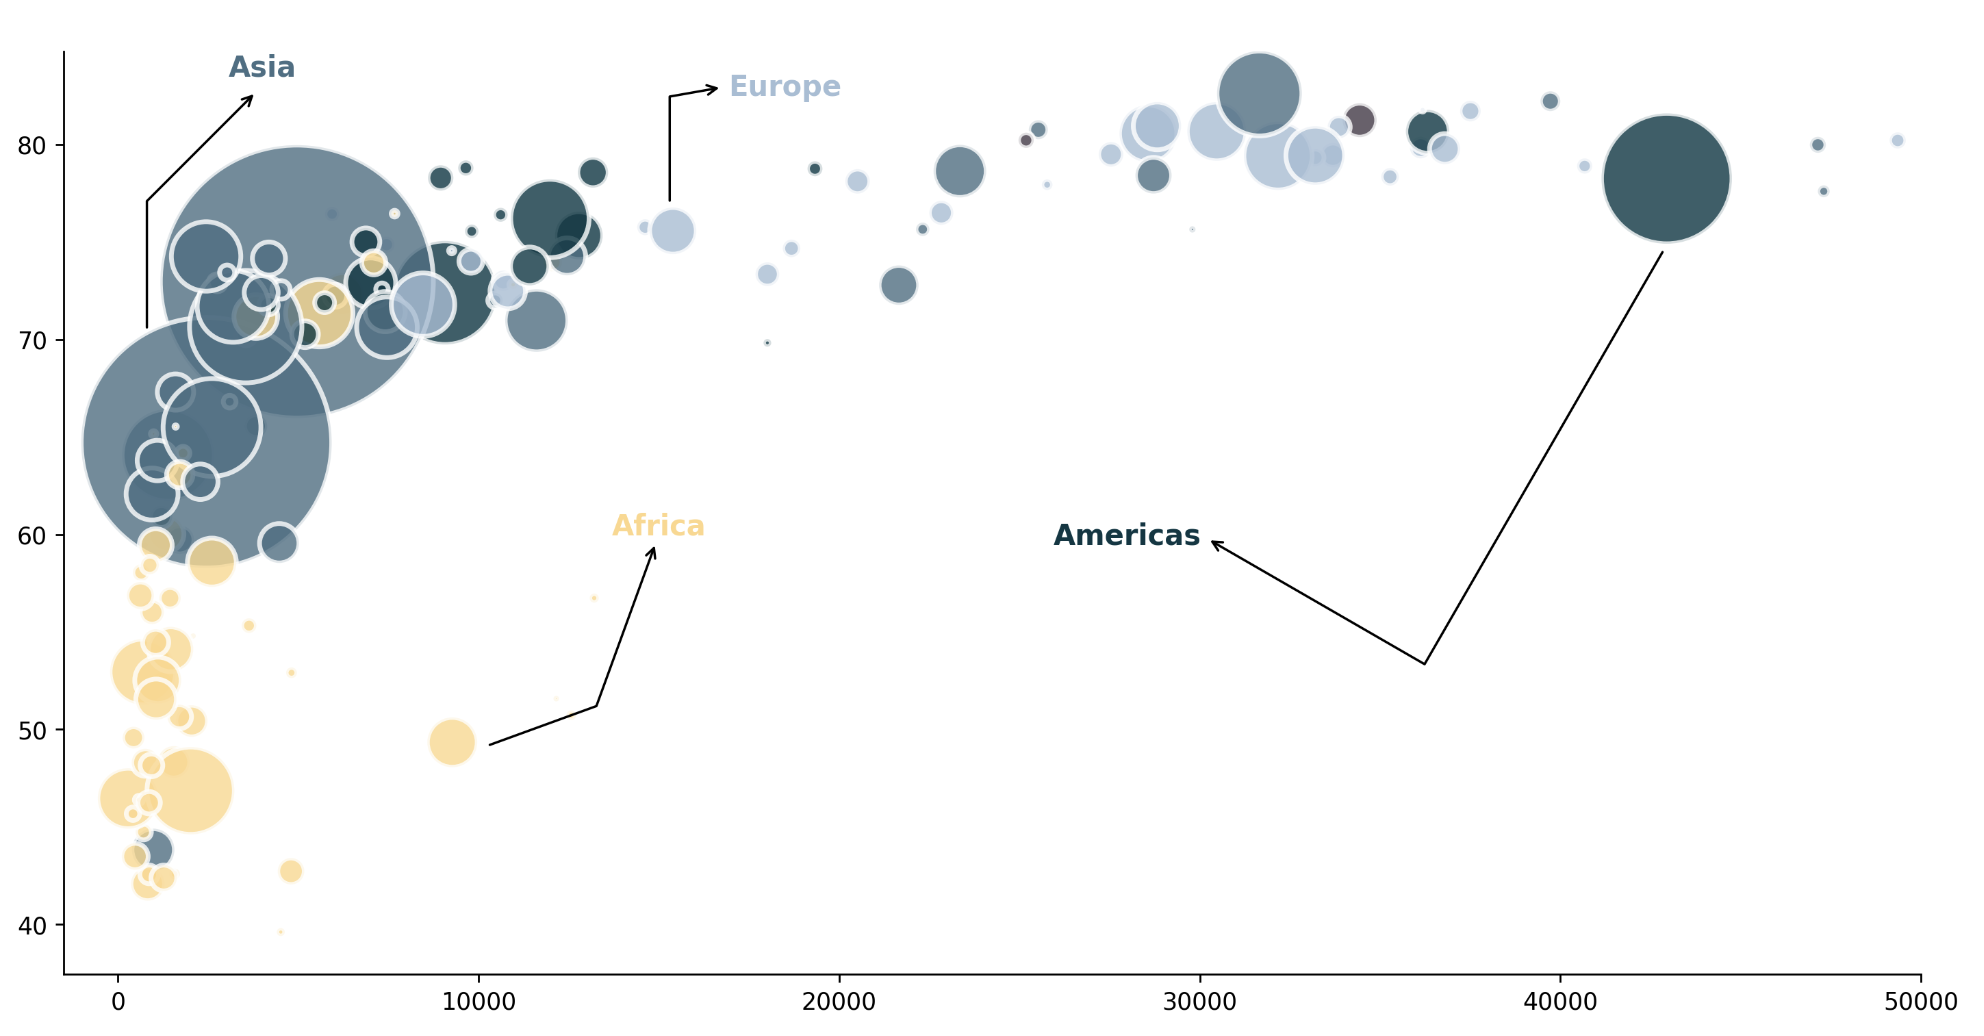
## Chart made with `pypalettes`
_Click on the image to get the associated code!_

## Acknowledgements
`PyPalettes` is **highly** inspired (and relies on for the first one) from
- the R package [paletteer](https://github.com/EmilHvitfeldt/paletteer)
- the python library [palettable](https://github.com/jiffyclub/palettable)
A big thanks to [Yan Holtz](https://www.yan-holtz.com/) for:
- Creating the [web app for browsing palettes](https://python-graph-gallery.com/color-palette-finder/)
- Hosting the [documentation](https://python-graph-gallery.com/introduction-to-pypalettes/) and [examples](#chart-made-with-pypalettes) on the **Python Graph Gallery**
- Providing valuable feedback on the code and design of the API
## Contributing
Since the core code of the library is currently quite short and simple, it does not require any major changes. However, if you have a good idea or suggestion, please [open an issue](https://github.com/JosephBARBIERDARNAL/pypalettes/issues).
That said, adding more palettes is an easy way to make `pypalettes` better! Here’s the best way to get started:
First, open your code editor and navigate to `parsers/list_manual_palettes.py`. You’ll find a dictionary of manually defined palettes. Add yours at the end with the following elements:
- `"name"`: the name of your palette
- `"palette"`: the colors of your palette in the following format: `["['#123456', '#654321', '#162534']"]`
- `"source"`: Where does your palette come from? If you created it, your name or a link to your portfolio is valid!
- `"kind"`: the type of palette. View examples [here](https://python-graph-gallery.com/color-palette-finder/)
- `"paletteer-kind"`: just put `"unknown"`
Then, run:
```bash
python parsers/main.py
```
For a large number of palettes, please [open an issue](https://github.com/JosephBARBIERDARNAL/pypalettes/issues) first.