https://github.com/LeoVerto/docker-network-graph
Quickly visualize docker networks with graphviz.
https://github.com/LeoVerto/docker-network-graph
devops-tools docker graph graphviz network-visualization python visualization
Last synced: about 1 year ago
JSON representation
Quickly visualize docker networks with graphviz.
- Host: GitHub
- URL: https://github.com/LeoVerto/docker-network-graph
- Owner: LeoVerto
- License: mit
- Fork: true (eagafonov/docker-network-graph-poc)
- Created: 2018-08-31T01:33:58.000Z (almost 8 years ago)
- Default Branch: master
- Last Pushed: 2024-03-20T07:08:56.000Z (over 2 years ago)
- Last Synced: 2024-11-12T12:48:44.562Z (over 1 year ago)
- Topics: devops-tools, docker, graph, graphviz, network-visualization, python, visualization
- Language: Python
- Homepage: https://hub.docker.com/r/leoverto/docker-network-graph/
- Size: 144 KB
- Stars: 84
- Watchers: 5
- Forks: 22
- Open Issues: 15
-
Metadata Files:
- Readme: README.md
- License: LICENSE
Awesome Lists containing this project
- awesome-starred - LeoVerto/docker-network-graph - Quickly visualize docker networks with graphviz. (docker)
README
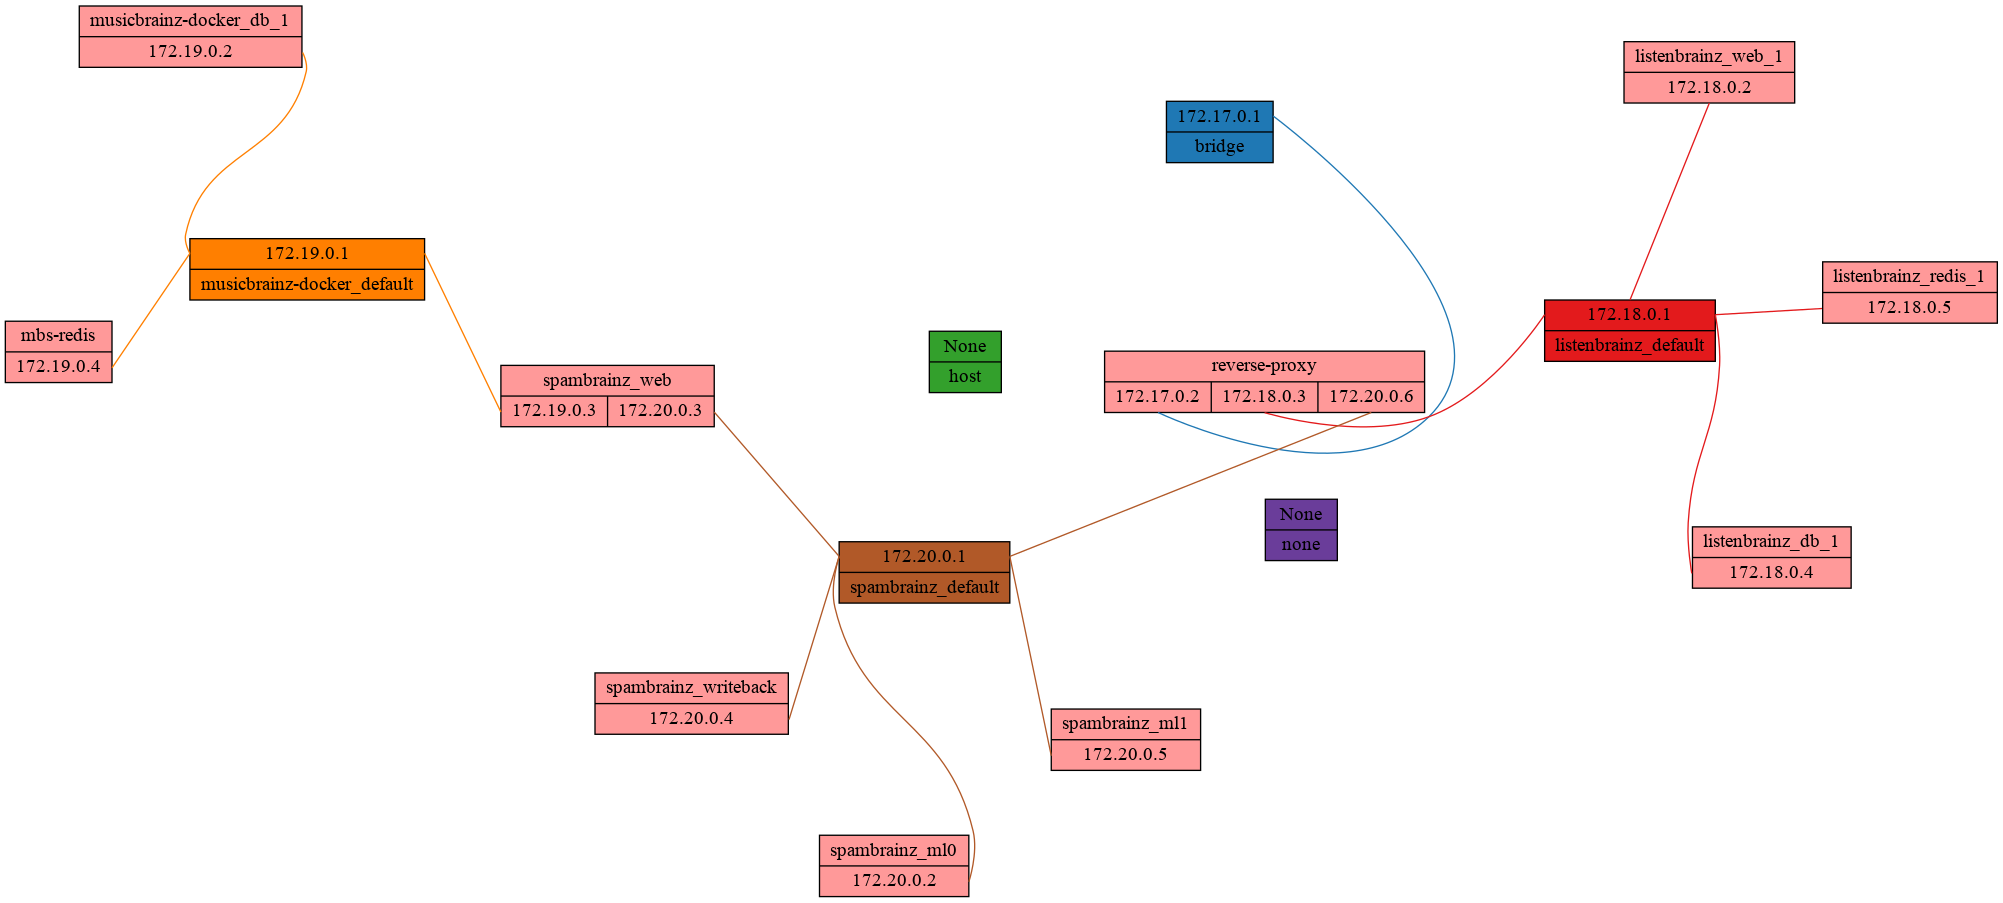
# Docker Network Graph
Visualize the relationship between Docker networks and containers
as a neat graphviz graph.
## Example
## Usage
usage: docker-net-graph.py [-h] [-v] [-o OUT]
Visualize docker networks.
optional arguments:
-h, --help show this help message and exit
-v, --verbose Verbose output
-o OUT, --out OUT Write output to file
In most cases what you want to run are the following couple commands:
git clone https://github.com/LeoVerto/docker-network-graph.git
cd docker-network-graph
pipenv install
pipenv run python docker-net-graph.py -o output.svg
This will generate an .svg file containing the graph.
## Running inside docker
If you want to generate a graph for a remote system you can also easily
run this script inside a pre-built docker container:
docker run --rm -v /var/run/docker.sock:/var/run/docker.sock leoverto/docker-network-graph
This will just generate and output the graph in the [DOT Language][dot].
You can then paste that code into [GraphvizOnline][gvonline]
to render it. The recommended rendering engine is `fdp`.
Alternatively, if you prefer to render locally, you can run
`fdp -Tpng -o out.png` on a system with graphviz installed,
paste the previous output there, press enter and finally CTRL+C to
generate the file.
For more advanced use cases you can append arguments to the `docker run`
command as if you were running it in a local shell.
[dot]: https://www.graphviz.org/doc/info/lang.html
[gvonline]: https://dreampuf.github.io/GraphvizOnline/
## Development
If you'd like to contribute to this project, there is a sample docker-compose file
using dummy containers in `test`.
You can deploy it using `docker-compose -f test/docker-compose.yml up -d`.