https://github.com/LudvigOlsen/rearrr
Rearrrange data by a set of methods
https://github.com/LudvigOlsen/rearrr
arrange cluster expand forming generate ggplot2 order plotting-in-r roll rotate shaping swirl transformations
Last synced: 12 months ago
JSON representation
Rearrrange data by a set of methods
- Host: GitHub
- URL: https://github.com/LudvigOlsen/rearrr
- Owner: LudvigOlsen
- License: other
- Created: 2020-04-26T23:50:56.000Z (about 6 years ago)
- Default Branch: master
- Last Pushed: 2025-03-06T18:28:48.000Z (over 1 year ago)
- Last Synced: 2025-06-28T13:46:42.861Z (about 1 year ago)
- Topics: arrange, cluster, expand, forming, generate, ggplot2, order, plotting-in-r, roll, rotate, shaping, swirl, transformations
- Language: R
- Homepage:
- Size: 13.1 MB
- Stars: 23
- Watchers: 1
- Forks: 3
- Open Issues: 0
-
Metadata Files:
- Readme: README.Rmd
- Changelog: NEWS.md
- Contributing: .github/CONTRIBUTING.md
- License: LICENSE
- Code of conduct: .github/CODE_OF_CONDUCT.md
- Support: .github/SUPPORT.md
Awesome Lists containing this project
- jimsghstars - LudvigOlsen/rearrr - Rearrrange data by a set of methods (R)
README
---
output: github_document
---
```{r, echo = FALSE, message=FALSE, warning=FALSE}
if (requireNamespace("knitr", quietly = TRUE)){
knitr::opts_chunk$set(
collapse = TRUE,
comment = "#>",
fig.path = "man/figures/README-",
dpi = 92,
fig.retina = 2
)
}
# Get minimum R requirement
dep <- as.vector(read.dcf('DESCRIPTION')[, 'Depends'])
rvers <- substring(dep, 7, nchar(dep)-1)
# m <- regexpr('R *\\\\(>= \\\\d+.\\\\d+.\\\\d+\\\\)', dep)
# rm <- regmatches(dep, m)
# rvers <- gsub('.*(\\\\d+.\\\\d+.\\\\d+).*', '\\\\1', dep)
# Function for TOC
# https://gist.github.com/gadenbuie/c83e078bf8c81b035e32c3fc0cf04ee8
```
# rearrr
**Rearrrange Data**
**Authors:** [Ludvig R. Olsen](https://www.ludvigolsen.dk/) ( r-pkgs@ludvigolsen.dk )

**License:** [MIT](https://opensource.org/license/mit)
**Started:** April 2020
[](https://cran.r-project.org/package=rearrr)
[](https://cran.r-project.org/package=rearrr)
[](https://cran.r-project.org/)
[](https://app.codecov.io/gh/ludvigolsen/rearrr?branch=master)
[](https://ci.appveyor.com/project/LudvigOlsen/rearrr)
[](https://zenodo.org/badge/latestdoi/259158437)
## Overview
R package for rearranging data by a set of methods.
We distinguish between **rearrangers** and **mutators**, where the first *reorders* the data points and the second *changes the values* of the data points.
When performing an operation relative to a point in an n-dimensional vector space, we refer to the point as the **origin**. If we, for instance, wish to rotate our data points around the point at `x = 3` and `y = 7`, those are the coordinates of our origin.
### Install
CRAN (when available):
> `install.packages("rearrr")`
Development version:
> `install.packages("devtools")`
>
> `devtools::install_github("LudvigOlsen/rearrr")`
### Rearrangers
| Function | Description |
|:----------------------|:----------------------------------------------------------------------|
|`center_max()` |Center the highest value with values decreasing around it. |
|`center_min()` |Center the lowest value with values increasing around it. |
|`position_max()` |Position the highest value with values decreasing around it. |
|`position_min()` |Position the lowest value with values increasing around it. |
|`pair_extremes()` |Arrange as lowest, highest, 2nd lowest, 2nd highest, etc. |
|`triplet_extremes()` |Arrange as lowest, most middle, highest, 2nd lowest, 2nd most middle, 2nd highest, etc. |
|`closest_to()` |Order values by shortest distance to an origin. |
|`furthest_from()` |Order values by longest distance to an origin. |
|`rev_windows()` |Reverse order window-wise. |
|`roll_elements()` |Rolls/shifts positions of elements. |
|`shuffle_hierarchy()` |Shuffle multi-column hierarchy of groups. |
### Mutators
| Function | Description | Dimensions |
|:----------------------|:----------------------------------------------------------------------|:-----------|
|`rotate_2d()`, `rotate_3d()` |Rotate values around an origin in 2 or 3 dimensions. |2 or 3 |
|`swirl_2d()`, `swirl_3d()` |Swirl values around an origin in 2 or 3 dimensions. |2 or 3 |
|`shear_2d()`, `shear_3d()` |Shear values around an origin in 2 or 3 dimensions. |2 or 3 |
|`expand_distances()` |Expand distances to an origin. |n |
|`expand_distances_each()`|Expand distances to an origin separately for each dimension. |n |
|`cluster_groups()` |Move data points into clusters around group centroids. |n |
|`dim_values()` |Dim values of a dimension by the distance to an n-dimensional origin. |n (alters 1)|
|`flip_values()` |Flip the values around an origin. |n |
|`roll_values()` |Shifts values and wraps to a range. |n |
|`wrap_to_range()` |Wraps values to a range. |n |
|`transfer_centroids()` |Transfer centroids from one `data.frame` to another. |n |
|`apply_transformation_matrix()` |Apply transformation `matrix` to `data.frame` columns. |n |
### Formers
| Function | Description |
|:------------------|:----------------------------------------------------------------------|
|`circularize()` |Create x-coordinates for y-coordinates so they form a circle. |
|`hexagonalize()` |Create x-coordinates for y-coordinates so they form a hexagon. |
|`square()` |Create x-coordinates for y-coordinates so they form a square. |
|`triangularize()` |Create x-coordinates for y-coordinates so they form a triangle. |
### Pipelines
| Class | Description |
|:---------------------|:------------------------------------------------------------------------|
|`Pipeline` |Chain multiple transformations. |
|`GeneratedPipeline` |Chain multiple transformations and generate argument values per group. |
|`FixedGroupsPipeline` |Chain multiple transformations with different argument values per group. |
### Generators
| Function | Description |
|:----------------------|:----------------------------------------------------------------------|
|`generate_clusters()` |Generate n-dimensional clusters. |
Additionally, some functions have `*_vec()` versions, that take and return a `vector`.
**Note**: The available utility functions (like scalers, converters and measuring functions) are
listed at the bottom of the readme.
## Table of Contents
```{r toc, echo=FALSE}
rearrr:::render_toc("README.Rmd", toc_depth = 4)
```
## Attach packages
Let's see some **examples**. We start by attaching the necessary packages:
```{r warning=FALSE, message=FALSE}
library(rearrr)
library(dplyr)
xpectr::set_test_seed(1)
```
```{r include=FALSE}
library(knitr) # kable()
has_tidyr <- require(tidyr) # gather()
has_ggplot <- require(ggplot2) # Attach if installed
vec <- 1:10
random_sample <- runif(10)
orderings <- data.frame(
"Position" = as.integer(vec),
"center_max" = center_max(vec),
"center_min" = center_min(vec),
"position_max" = position_max(vec, position = 3),
"position_min" = position_min(vec, position = 3),
"pair_extremes" = pair_extremes_vec(vec),
"rev_windows" = rev_windows_vec(vec, window_size = 3),
"closest_to" = closest_to_vec(vec, origin_fn = create_origin_fn(median)),
"furthest_from" = furthest_from_vec(vec, origin = 5),
"random_sample" = random_sample,
"flipped_median" = flip_values_vec(random_sample, origin_fn=create_origin_fn(median)),
stringsAsFactors = FALSE
)
# Convert to long format for plotting
if (has_tidyr){
orderings <- orderings %>%
tidyr::gather(key = "Method", value = "Value", 2:(ncol(orderings)))
}
gg_line_alpha <- .4
gg_base_line_size <- .3
```
While we can use the functions with `data.frames`, we showcase many of them with a `vector` for simplicity.
At times, we use the `*_vec()` version of a function in order to get the output as a `vector` instead of a `data.frame`.
The functions work with grouped `data.frames` and in `magrittr` pipelines (`%>%`).
## Rearranger examples
Rearrangers change the order of the data points.
### Center min/max
```{r}
center_max(data = 1:10)
```
```{r}
center_min(data = 1:10)
```
```{r echo=FALSE, fig.align='center', fig.width=6, fig.height=3.5}
if (has_ggplot && has_tidyr){
# Plot centering methods
orderings %>%
dplyr::filter(Method %in% c("center_min", "center_max")) %>%
ggplot(aes(x = Position, y = Value, color = Method)) +
geom_line(alpha = gg_line_alpha) +
geom_point() +
theme_minimal(base_line_size = gg_base_line_size) +
scale_x_continuous(breaks = c(2, 4, 6, 8, 10)) +
scale_y_continuous(breaks = c(2, 4, 6, 8, 10)) +
scale_colour_brewer(palette = "Dark2")
}
```
### Position min/max
```{r}
position_max(data = 1:10, position = 3)
```
```{r}
position_min(data = 1:10, position = 3)
```
```{r echo=FALSE, fig.align='center', fig.width=6, fig.height=3.5}
if (has_ggplot && has_tidyr){
# Plot positioning methods
orderings %>%
dplyr::filter(Method %in% c("position_min", "position_max")) %>%
ggplot(aes(x = Position, y = Value, color = Method)) +
geom_line(alpha = gg_line_alpha) +
geom_point() +
theme_minimal(base_line_size = gg_base_line_size) +
scale_x_continuous(breaks = c(2, 4, 6, 8, 10)) +
scale_y_continuous(breaks = c(2, 4, 6, 8, 10)) +
scale_colour_brewer(palette = "Dark2")
}
```
### Pair extremes
```{r}
pair_extremes(data = 1:10)
```
```{r echo=FALSE, fig.align='center', fig.width=6, fig.height=3.5}
if (has_ggplot && has_tidyr){
# Plot extreme pairing
orderings %>%
dplyr::filter(Method == "pair_extremes") %>%
ggplot(aes(x = Position, y = Value, color = Method)) +
geom_line(alpha = gg_line_alpha) +
geom_point() +
theme_minimal(base_line_size = gg_base_line_size) +
scale_x_continuous(breaks = c(2, 4, 6, 8, 10)) +
scale_y_continuous(breaks = c(2, 4, 6, 8, 10)) +
scale_colour_brewer(palette = "Dark2")
}
```
### Closest to / furthest from
We use the `_vec()` versions to get the reordered vectors. For `data.frames`, use `closest_to()`/`furthest_from()` instead.
The origin can be passed as either a specific coordinate (here, a value in `data`) or a function.
```{r}
closest_to_vec(data = 1:10, origin_fn = create_origin_fn(median))
```
```{r}
furthest_from_vec(data = 1:10, origin = 5)
```
```{r echo=FALSE, fig.align='center', fig.width=6, fig.height=3.5}
if (has_ggplot && has_tidyr){
# Plot distanced order
orderings %>%
dplyr::filter(Method %in% c("closest_to", "furthest_from")) %>%
ggplot(aes(x = Position, y = Value, color = Method)) +
geom_line(alpha = gg_line_alpha) +
geom_point() +
theme_minimal(base_line_size = gg_base_line_size) +
scale_x_continuous(breaks = c(2, 4, 6, 8, 10)) +
scale_y_continuous(breaks = c(2, 4, 6, 8, 10)) +
scale_colour_brewer(palette = "Dark2")
}
```
### Reverse windows
We use the `_vec()` version to get the reordered vector. For `data.frames`, use `rev_windows()` instead.
```{r}
rev_windows_vec(data = 1:10, window_size = 3)
```
```{r echo=FALSE, fig.align='center', fig.width=6, fig.height=3.5}
if (has_ggplot && has_tidyr){
# Plot windowed reversing
orderings %>%
dplyr::filter(Method == "rev_windows") %>%
ggplot(aes(x = Position, y = Value, color = Method)) +
geom_line(alpha = gg_line_alpha) +
geom_point() +
theme_minimal(base_line_size = gg_base_line_size) +
scale_x_continuous(breaks = c(2, 4, 6, 8, 10)) +
scale_y_continuous(breaks = c(2, 4, 6, 8, 10)) +
scale_colour_brewer(palette = "Dark2")
}
```
### Shuffle Hierarchy
When having a `data.frame` with multiple grouping columns, we can shuffle them one column (hierarchical level) at a time:
```{r eval=FALSE}
# Shuffle a given data frame 'df'
shuffle_hierarchy(df, group_cols = c("a", "b", "c"))
```
The columns are shuffled one at a time, as so:
## Mutator examples
Mutators change the values of the data points.
### Rotate values
2-dimensional rotation:
```{r}
# Set seed for reproducibility
xpectr::set_test_seed(1)
# Draw random numbers
random_sample <- round(runif(10), digits = 4)
random_sample
rotate_2d(
data = random_sample,
degrees = 60,
origin_fn = centroid
)
```
```{r echo=FALSE, fig.align='center', fig.width=6, fig.height=3.5}
rotate_df <- rotate_2d(random_sample, degrees = c(0, 72, 144, 216, 288), origin_fn = centroid)
if (has_ggplot){
# Plot rotated values
rotate_df %>%
ggplot(aes(x = Index_rotated, y = Value_rotated, color = factor(.degrees))) +
geom_hline(yintercept = mean(random_sample), size = 0.2, alpha = gg_line_alpha, linetype="dashed") +
geom_vline(xintercept = mean(seq_len(length(random_sample))), size = 0.2, alpha = gg_line_alpha, linetype="dashed") +
geom_path(alpha = gg_line_alpha) +
geom_point() +
theme_minimal(base_line_size = gg_base_line_size) +
scale_colour_brewer(palette = "Dark2") +
labs(x = "Index", y="Value", color="Degrees")
}
```
3-dimensional rotation:
```{r}
# Set seed
set.seed(3)
# Create a data frame
df <- data.frame(
"x" = 1:12,
"y" = c(1, 2, 3, 4, 9, 10, 11,
12, 15, 16, 17, 18),
"z" = runif(12)
)
# Perform rotation
rotate_3d(
data = df,
x_col = "x",
y_col = "y",
z_col = "z",
x_deg = 45,
y_deg = 90,
z_deg = 135,
origin_fn = centroid
)
```
```{r echo=FALSE, fig.align='center', fig.width=6, fig.height=3.5}
rotate_df <- df %>%
rotate_3d(x_col = "x",
y_col = "y",
z_col = "z",
x_deg = c(0, 72, 144, 216, 288),
y_deg = c(0, 72, 144, 216, 288),
z_deg = c(0, 72, 144, 216, 288),
origin_fn = centroid)
if (has_ggplot){
# Plot rotated values
rotate_df %>%
ggplot(aes(x = x_rotated, y = y_rotated, color = .degrees_str, alpha = z_rotated)) +
geom_vline(xintercept = mean(df$x), size = 0.2, alpha = .4, linetype="dashed") +
geom_hline(yintercept = mean(df$y), size = 0.2, alpha = .4, linetype="dashed") +
geom_path(alpha = gg_line_alpha) +
geom_point() +
theme_minimal(base_line_size = gg_base_line_size) +
scale_colour_brewer(palette = "Dark2") +
labs(x = "x", y = "y", color = "degrees", alpha = "z (opacity)")
}
```
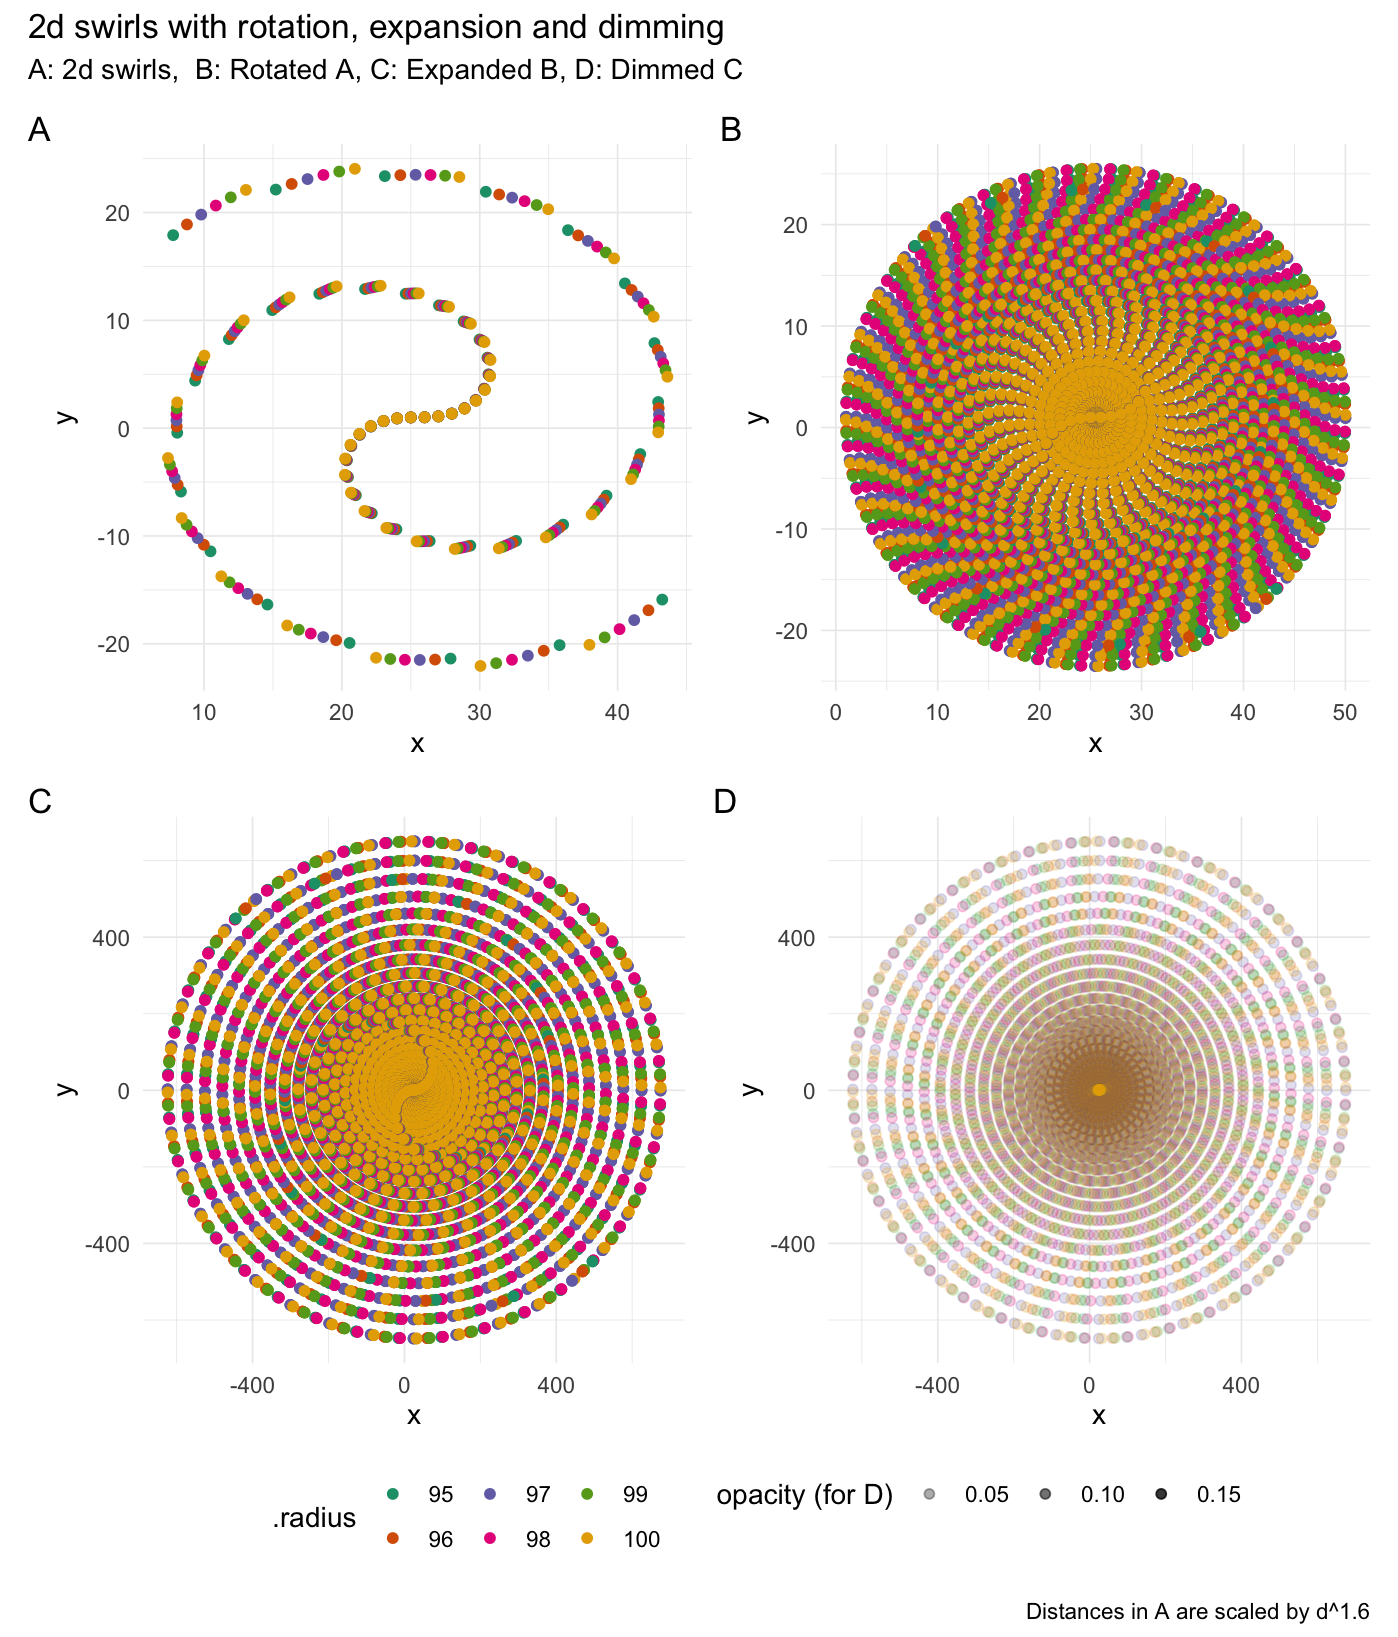
### Swirl values
2-dimensional swirling:
```{r}
# Rotate values
swirl_2d(data = rep(1, 50), radius = 95, origin = c(0, 0))
```
```{r echo=FALSE, fig.align='center', fig.width=7.6, fig.height=8.9, eval=FALSE}
# Swirl around the centroid
df_swirled <- swirl_2d(
data = rep(1, 50),
radius = c(95, 96, 97, 98, 99, 100),
origin_fn = centroid,
suffix = "",
scale_fn = function(x) {
x ^ 1.6
}
)
orig <- df_swirled$.origin[[1]]
if (has_ggplot){
# Plot swirls
ggswirl1 <- df_swirled %>%
ggplot(aes(x = Index, y = Value, color = factor(.radius))) +
geom_point() +
theme_minimal(base_line_size = gg_base_line_size) +
scale_colour_brewer(palette = "Dark2") +
labs(x = "x", y = "y", color = ".radius")
}
df_swirled <- df_swirled %>%
rotate_2d(degrees = (1:36) * 10,
x_col = "Index",
y_col = "Value",
suffix = "",
origin = orig)
if (has_ggplot){
# Plot rotated swirls
ggswirl2 <- df_swirled %>%
ggplot(aes(x = Index, y = Value, color = factor(.radius))) +
geom_point() +
theme_minimal(base_line_size = gg_base_line_size) +
scale_colour_brewer(palette = "Dark2") +
labs(x = "x", y = "y", color = ".radius")
}
# Expand values ^2
df_swirled <- df_swirled %>%
expand_distances(
cols = c("Index", "Value"),
multiplier = 2,
exponentiate = T,
origin = orig,
suffix = "")
if (has_ggplot){
# Plot expanded swirls
ggswirl3 <- df_swirled %>%
ggplot(aes(x = Index, y = Value, color = factor(.radius))) +
geom_point() +
theme_minimal(base_line_size = gg_base_line_size) +
scale_colour_brewer(palette = "Dark2") +
labs(x = "x", y = "y", color = ".radius")
}
# Dim values
df_swirled <- df_swirled %>%
mutate(o = 1) %>%
dim_values(cols = c("Index", "Value", "o"), origin = c(orig, 1), suffix = "")
if (has_ggplot){
# Plot rotated swirls
ggswirl4 <- df_swirled %>%
ggplot(aes(x = Index, y = Value, alpha = o, color = factor(.radius))) +
geom_point() +
theme_minimal(base_line_size = gg_base_line_size) +
scale_colour_brewer(palette = "Dark2") +
labs(x = "x", y = "y", color = ".radius", alpha = "opacity (for D)")
combined <- (ggswirl1 + ggswirl2) / (ggswirl3 + ggswirl4) & theme(legend.position = "bottom")
combined <- combined + plot_layout(guides = "collect")
combined +
plot_annotation(title = "2d swirls with rotation, expansion and dimming",
subtitle = "A: 2d swirls, B: Rotated A, C: Expanded B, D: Dimmed C",
caption = "Distances in A are scaled by d^1.6",
tag_levels = 'A')
}
```
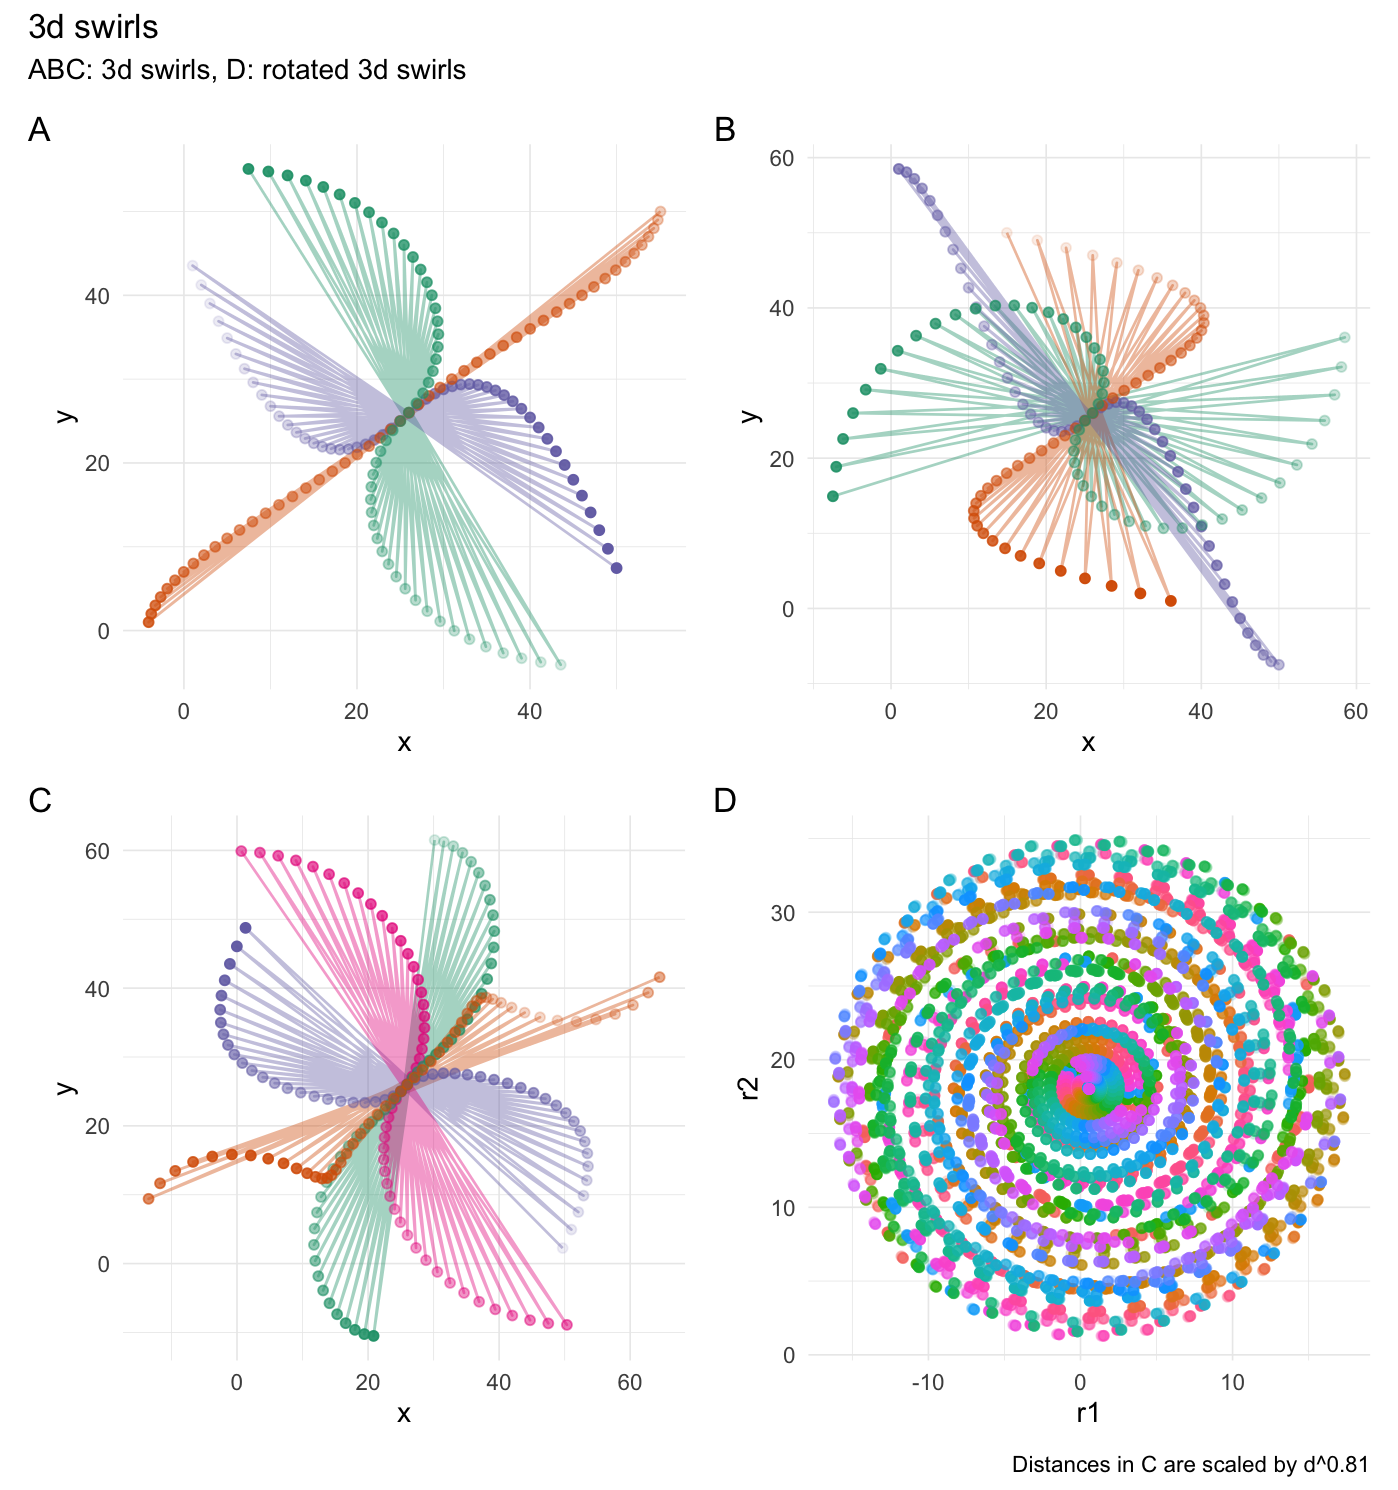
3-dimensional swirling:
```{r}
# Set seed
set.seed(4)
# Create a data frame
df <- data.frame(
"x" = 1:50,
"y" = 1:50,
"z" = 1:50,
"r1" = runif(50),
"r2" = runif(50) * 35,
"o" = 1,
"g" = rep(1:5, each = 10)
)
# They see me swiiirling
swirl_3d(
data = df,
x_radius = 45,
x_col = "x",
y_col = "y",
z_col = "z",
origin = c(0, 0, 0),
keep_original = FALSE
)
```
```{r echo=FALSE, fig.align='center', fig.width=7.6, fig.height=8.1, eval=FALSE}
# 1st plot
df_swirled <- swirl_3d(
data = df,
x_col = "x",
y_col = "y",
z_col = "z",
x_radius = c(100, 0, 0),
y_radius = c(0, 100, 0),
z_radius = c(0, 0, 100),
origin_fn = centroid
)
if (has_ggplot){
ggswirl_3d_1 <- df_swirled %>%
ggplot(aes(x = x_swirled, y = y_swirled, color = .radius_str, alpha = z_swirled)) +
geom_path(alpha = gg_line_alpha) +
geom_point() +
theme_minimal(base_line_size = gg_base_line_size) +
scale_colour_brewer(palette = "Dark2") +
labs(x = "x", y = "y", color = "radius", alpha = "z (opacity)")
}
# 2nd plot
df_swirled <- swirl_3d(
data = df,
x_col = "x",
y_col = "y",
z_col = "z",
x_radius = c(50, 0, 0),
y_radius = c(0, 50, 0),
z_radius = c(0, 0, 50),
origin_fn = centroid
)
if (has_ggplot){
ggswirl_3d_2 <- df_swirled %>%
ggplot(aes(x = x_swirled, y = y_swirled, color = .radius_str, alpha = z_swirled)) +
geom_path(alpha = gg_line_alpha) +
geom_point() +
theme_minimal(base_line_size = gg_base_line_size) +
scale_colour_brewer(palette = "Dark2") +
labs(x = "x", y = "y", color = "radius", alpha = "z (opacity)")
}
# 3rd plot
df_swirled <- swirl_3d(
data = df,
x_col = "x",
y_col = "y",
z_col = "z",
x_radius = c(25, 50, 25, 25),
y_radius = c(50, 75, 100, 25),
z_radius = c(75, 25, 25, 25),
origin_fn = centroid,
scale_fn = function(x) {
x^0.81
}
)
if (has_ggplot){
ggswirl_3d_3 <- df_swirled %>%
ggplot(aes(x = x_swirled, y = y_swirled, color = .radius_str, alpha = z_swirled)) +
geom_path(alpha = gg_line_alpha) +
geom_point() +
theme_minimal(base_line_size = gg_base_line_size) +
scale_colour_brewer(palette = "Dark2") +
labs(x = "x", y = "y", color = "radius", alpha = "z (opacity)")
}
# 4th plot
df_swirled <- swirl_3d(
data = df,
x_col = "r1",
y_col = "r2",
z_col = "o",
x_radius = c(0, 0, 0, 0),
y_radius = c(0, 30, 60, 90),
z_radius = c(10, 10, 10, 10),
origin_fn = centroid
)
# Not let's rotate it every 10 degrees
df_rotated <- df_swirled %>%
rotate_3d(
x_col = "r1_swirled",
y_col = "r2_swirled",
z_col = "o_swirled",
x_deg = rep(0, 36),
y_deg = rep(0, 36),
z_deg = (1:36) * 10,
suffix = "",
origin = df_swirled$.origin[[1]])
if (has_ggplot){
ggswirl_3d_4 <- df_rotated %>%
ggplot(aes(x = r1_swirled, y = r2_swirled, color = .degrees_str, alpha = o_swirled)) +
geom_point(show.legend = FALSE) +
theme_minimal(base_line_size = gg_base_line_size) +
# scale_colour_brewer(palette = "Dark2") +
labs(x = "r1", y = "r2", color = "radius", alpha = "o (opacity)")
combined <- (ggswirl_3d_1 + ggswirl_3d_2) / (ggswirl_3d_3 + ggswirl_3d_4) & theme(legend.position = "none")
# combined <- combined + plot_layout(guides = "collect")
combined +
plot_annotation(title = "3d swirls",
subtitle = "ABC: 3d swirls, D: rotated 3d swirls",
caption = "Distances in C are scaled by d^0.81",
tag_levels = 'A')
}
```
### Expand distances
```{r}
# 1d expansion
expand_distances(
data = random_sample,
multiplier = 3,
origin_fn = centroid,
exponentiate = TRUE
)
```
2d expansion:
```{r echo=FALSE, fig.align='center', fig.width=6, fig.height=3.5}
xpectr::set_test_seed(36)
random_x <- runif(10)
random_y <- runif(10)
expand_df <- purrr::map_dfr(
.x = c(1, 2, 3, 4, 5),
.f = function(exponent) {
expand_distances(
data.frame("x" = random_x,
"y" = random_y),
cols = c("x", "y"),
multiplier = exponent,
origin_fn = centroid,
exponentiate = TRUE
)
}
)
if (has_ggplot){
# Plot rotated values
expand_df %>%
ggplot(aes(x = x_expanded, y = y_expanded, color = factor(.exponent))) +
geom_hline(yintercept = mean(random_y), size = 0.2, alpha = gg_line_alpha, linetype="dashed") +
geom_vline(xintercept = mean(random_x), size = 0.2, alpha = gg_line_alpha, linetype="dashed") +
geom_path(alpha = gg_line_alpha) +
geom_point() +
theme_minimal(base_line_size = gg_base_line_size) +
scale_colour_brewer(palette = "Dark2") +
labs(x = "x", y="y", color="Exponent")
}
xpectr::set_test_seed(36) # for next section
```
Expand differently in each axis:
```{r}
# Expand x-axis and contract y-axis
expand_distances_each(
data.frame("x" = runif(10),
"y" = runif(10)),
cols = c("x", "y"),
multipliers = c(7, 0.5),
origin_fn = centroid
)
```
```{r echo=FALSE, fig.align='center', fig.width=6, fig.height=3.5}
rand_df <- data.frame("x" = random_x,
"y" = random_y)
expand_df <- purrr::map2_dfr(
.x = c(7, 1),
.y = c(0.5, 1),
.f = function(m1, m2) {
expand_distances_each(
rand_df,
cols = c("x", "y"),
multipliers = c(m1, m2),
origin_fn = centroid
)
}
)
if (has_ggplot){
# Plot rotated values
expand_df %>%
ggplot(aes(x = x_expanded, y = y_expanded, color = factor(.multipliers_str))) +
geom_hline(yintercept = mean(random_y), size = 0.2, alpha = gg_line_alpha, linetype = "dashed") +
geom_vline(xintercept = mean(random_x), size = 0.2, alpha = gg_line_alpha, linetype = "dashed") +
geom_path(alpha = gg_line_alpha) +
geom_point() +
theme_minimal(base_line_size = gg_base_line_size) +
scale_colour_brewer(palette = "Dark2") +
labs(x = "x", y = "y", color = "Multiplier")
}
```
### Cluster groups
```{r}
# Set seed for reproducibility
xpectr::set_test_seed(3)
# Create data frame with random data and a grouping variable
df <- data.frame(
"x" = runif(50),
"y" = runif(50),
"g" = rep(c(1, 2, 3, 4, 5), each = 10)
)
cluster_groups(
data = df,
cols = c("x", "y"),
group_col = "g"
)
```
```{r echo=FALSE, fig.align='center', fig.width=6, fig.height=3.5}
df_clustered <- cluster_groups(df, cols = c("x", "y"), group_col = "g")
if (has_ggplot){
ggplot(df_clustered, aes(x = x_clustered, y = y_clustered, color = factor(g))) +
# Original data
geom_point(aes(x = x, y = y), alpha = 0.3, size = 0.8) +
# Clustered data
geom_point() +
theme_minimal(base_line_size = gg_base_line_size) +
scale_colour_brewer(palette = "Dark2") +
labs(x = "x", y = "y", color = "g", caption = "Semi-transparent points are the original data points.")
}
df_clustered <- df_clustered %>%
dplyr::select(x_clustered, y_clustered, g)
```
### Dim values
```{r}
# Add a column with 1s
df_clustered$o <- 1
# Dim the "o" column based on the data point's distance
# to the most central point in the cluster
df_clustered %>%
dplyr::group_by(g) %>%
dim_values(
cols = c("x_clustered", "y_clustered"),
dim_col = "o",
origin_fn = most_centered
)
```
```{r echo=FALSE, fig.align='center', fig.width=6, fig.height=3.5}
df_dimmed <- df_clustered %>%
dplyr::group_by(g) %>%
dim_values(cols = c("x_clustered", "y_clustered", "o"), origin_fn = most_centered)
if (has_ggplot){
ggplot(df_dimmed, aes(x = x_clustered, y = y_clustered, alpha = o_dimmed, color = factor(g))) +
geom_point() +
theme_minimal(base_line_size = gg_base_line_size) +
scale_colour_brewer(palette = "Dark2") +
labs(x = "x", y = "y", color = "g", alpha = "o_dimmed")
}
```
### Flip values
```{r}
# The median value to flip around
median(random_sample)
# Flip the random numbers around the median
flip_values(
data = random_sample,
origin_fn = create_origin_fn(median)
)
```
```{r echo=FALSE, fig.align='center', fig.width=6, fig.height=3.5}
if (has_ggplot && has_tidyr){
# Plot flipped values
orderings %>%
dplyr::filter(Method %in% c("random_sample", "flipped_median")) %>%
ggplot(aes(x = Position, y = Value, color = Method)) +
geom_line(alpha = gg_line_alpha) +
geom_point() +
theme_minimal(base_line_size = gg_base_line_size) +
scale_x_continuous(breaks = c(2, 4, 6, 8, 10)) +
scale_colour_brewer(palette = "Dark2")
}
```
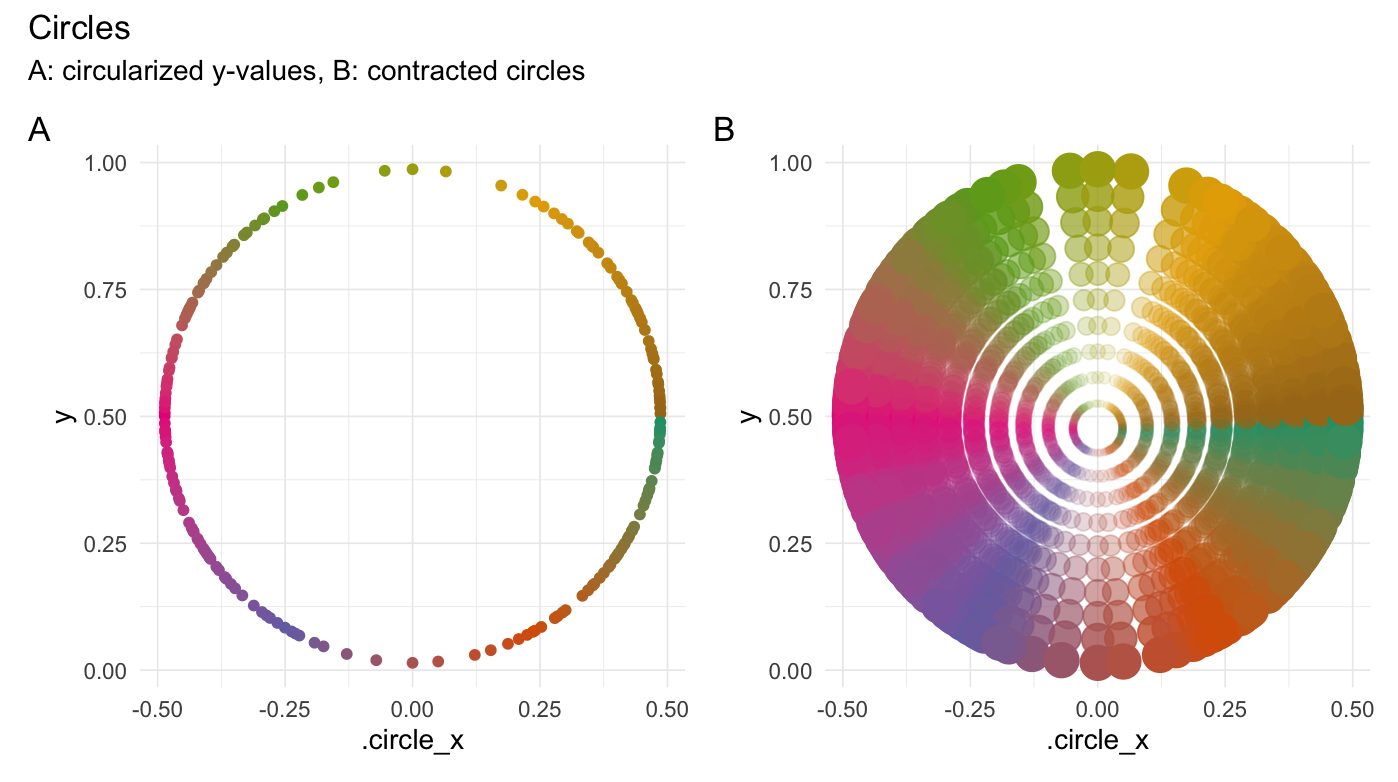
## Forming examples
### Circularize points
```{r}
circularize(runif(200))
```
```{r echo=FALSE, fig.align='center', fig.width=7.6, fig.height=4.25, eval=FALSE}
xpectr::set_test_seed(10)
# Create a data frame
df <- data.frame(
"y" = runif(200)
)
df_circ <- circularize(df, y_col = "y")
if (has_ggplot){
ggcirc_1 <- df_circ %>%
ggplot(aes(x = .circle_x, y = y, color = .degrees)) +
geom_point() +
theme_minimal(base_line_size = gg_base_line_size) +
scale_colour_distiller(palette = "Dark2") +
labs(x = ".circle_x", y = "y")
}
df_circ_expanded <- purrr::map_dfr(
.x = 1:10/10,
.f = function(mult){
expand_distances(
data = df_circ,
cols = c(".circle_x", "y"),
multiplier = mult,
origin_fn = centroid)
})
if (has_ggplot){
ggcirc_2 <- df_circ_expanded %>%
ggplot(aes(x = .circle_x_expanded, y = y_expanded,
color = .degrees, alpha = 0.8*.multiplier^2)) +
geom_point(aes(size = 0.8*.multiplier^2)) +
theme_minimal(base_line_size = gg_base_line_size) +
scale_colour_distiller(palette = "Dark2") +
labs(x = ".circle_x", y = "y")
combined <- (ggcirc_1 + ggcirc_2) & theme(legend.position = "none")
combined +
plot_annotation(title = "Circles",
subtitle = "A: circularized y-values, B: contracted circles",
tag_levels = 'A')
}
```
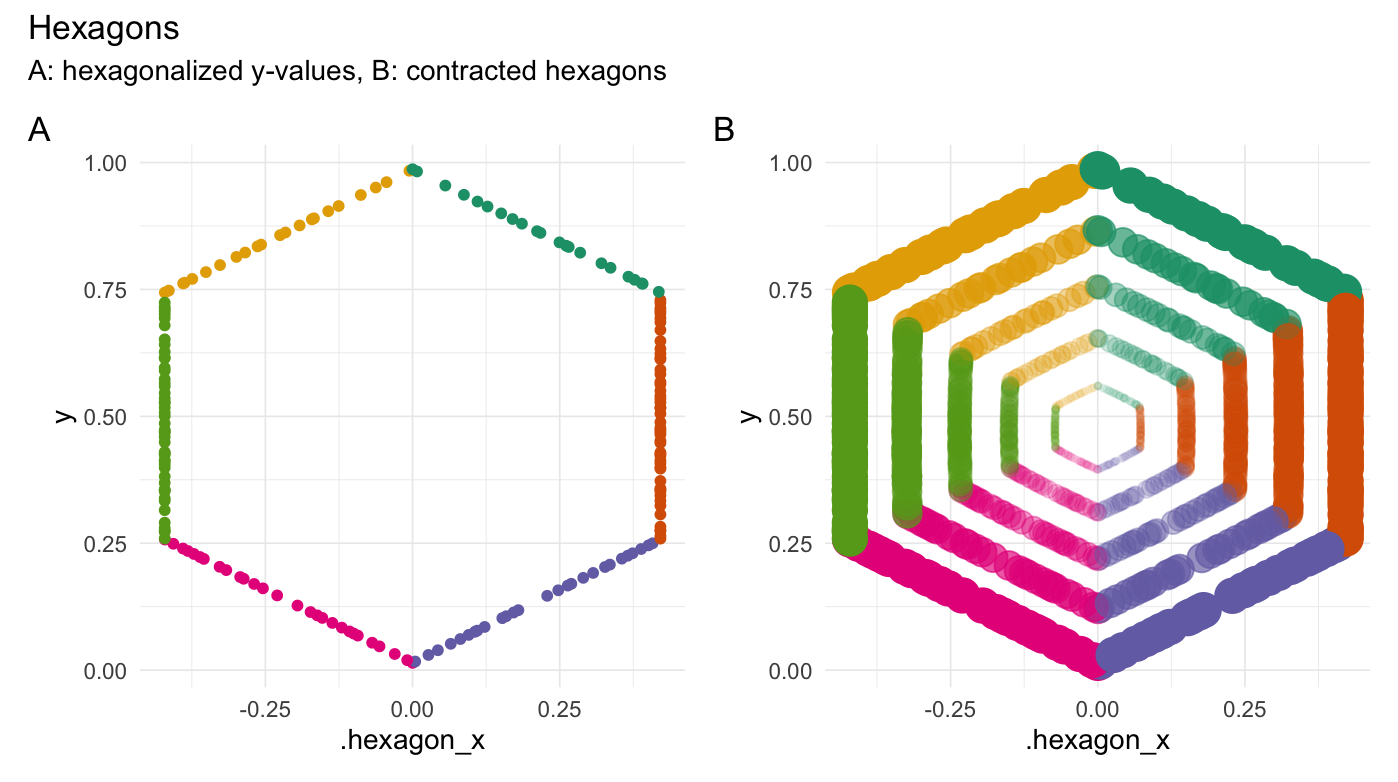
### Hexagonalize points
```{r}
hexagonalize(runif(200))
```
```{r echo=FALSE, fig.align='center', fig.width=7.6, fig.height=4.25, eval=FALSE}
xpectr::set_test_seed(10)
# Create a data frame
df <- data.frame(
"y" = runif(200)
)
df_hex <- hexagonalize(df, y_col = "y")
if (has_ggplot){
gghex_1 <- df_hex %>%
ggplot(aes(x = .hexagon_x, y = y, color = .edge)) +
geom_point() +
theme_minimal(base_line_size = gg_base_line_size) +
scale_colour_brewer(palette = "Dark2") +
labs(x = ".hexagon_x", y = "y")
}
df_hex_expanded <- purrr::map_dfr(
.x = 1:5/10*2,
.f = function(mult){
expand_distances(
data = df_hex,
cols = c(".hexagon_x", "y"),
multiplier = mult,
exponentiate = TRUE,
origin_fn = centroid)
})
if (has_ggplot){
gghex_2 <- df_hex_expanded %>%
ggplot(aes(x = .hexagon_x_expanded, y = y_expanded,
color = .edge, alpha = 0.8*.exponent^2)) +
geom_point(aes(size = 0.8*.exponent^2)) +
theme_minimal(base_line_size = gg_base_line_size) +
scale_colour_brewer(palette = "Dark2") +
labs(x = ".hexagon_x", y = "y")
combined <- (gghex_1 + gghex_2) & theme(legend.position = "none")
combined +
plot_annotation(title = "Hexagons",
subtitle = "A: hexagonalized y-values, B: contracted hexagons",
tag_levels = 'A')
}
```
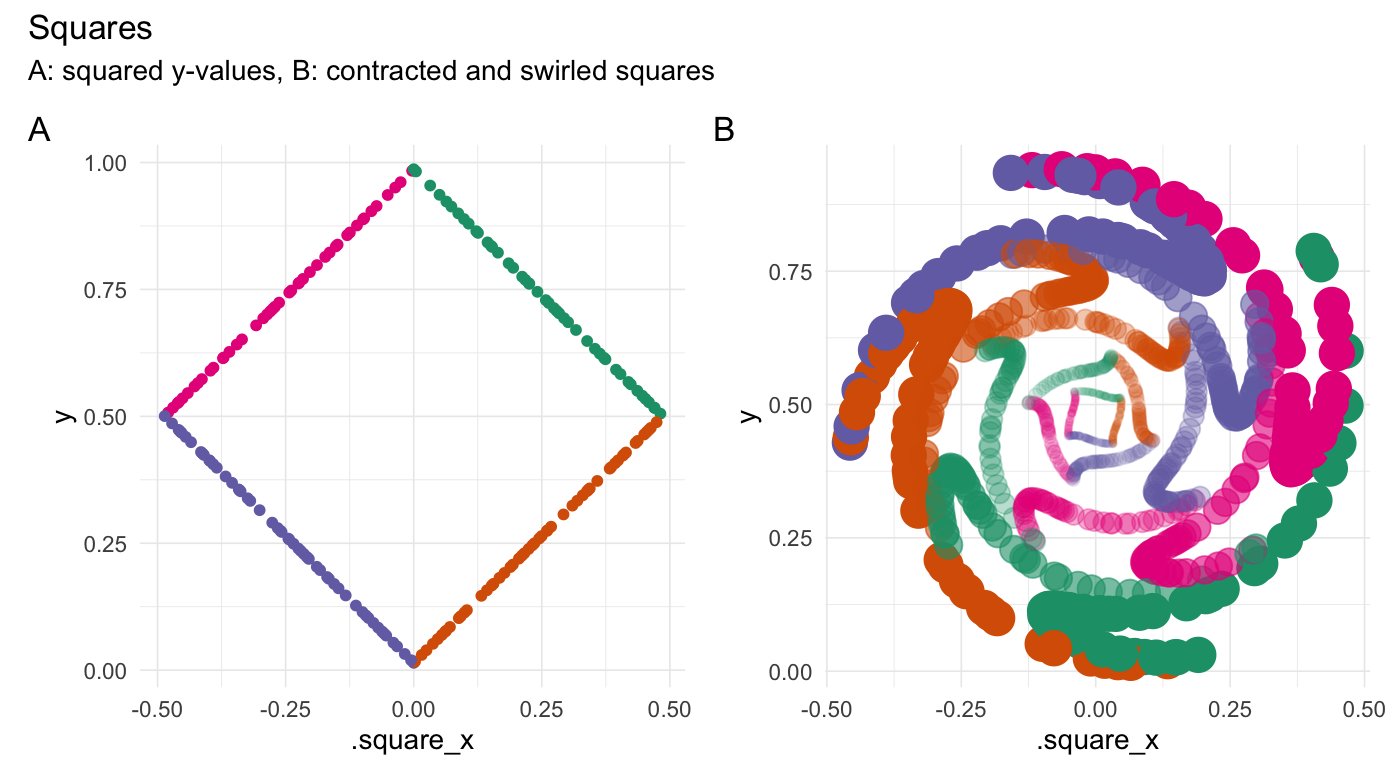
### Square points
```{r}
square(runif(200))
```
```{r echo=FALSE, fig.align='center', fig.width=7.6, fig.height=4.25, eval=FALSE}
df_sq <- square(df, y_col = "y")
if (has_ggplot){
ggsq_1 <- df_sq %>%
ggplot(aes(x = .square_x, y = y, color = .edge)) +
geom_point() +
theme_minimal(base_line_size = gg_base_line_size) +
scale_colour_brewer(palette = "Dark2") +
labs(x = ".square_x", y = "y")
}
df_sq_expanded <- purrr::map_dfr(
.x = c(1, 0.75, 0.5, 0.25, 0.125),
.f = function(mult){
expand_distances(
data = df_sq,
cols = c(".square_x", "y"),
multiplier = mult,
origin_fn = centroid)
}) %>%
swirl_2d(
radius = 0.3,
x_col = ".square_x_expanded",
y_col = "y_expanded",
origin_fn = centroid,
suffix = "",
origin_col_name = NULL
)
if (has_ggplot){
ggsq_2 <- df_sq_expanded %>%
ggplot(aes(x = .square_x_expanded, y = y_expanded,
color = .edge, alpha = 0.8*.multiplier^2)) +
geom_point(aes(size = 0.8*.multiplier^2)) +
theme_minimal(base_line_size = gg_base_line_size) +
scale_colour_brewer(palette = "Dark2") +
labs(x = ".square_x", y = "y")
combined <- (ggsq_1 + ggsq_2) & theme(legend.position = "none")
combined +
plot_annotation(title = "Squares",
subtitle = "A: squared y-values, B: contracted and swirled squares",
tag_levels = 'A')
}
```
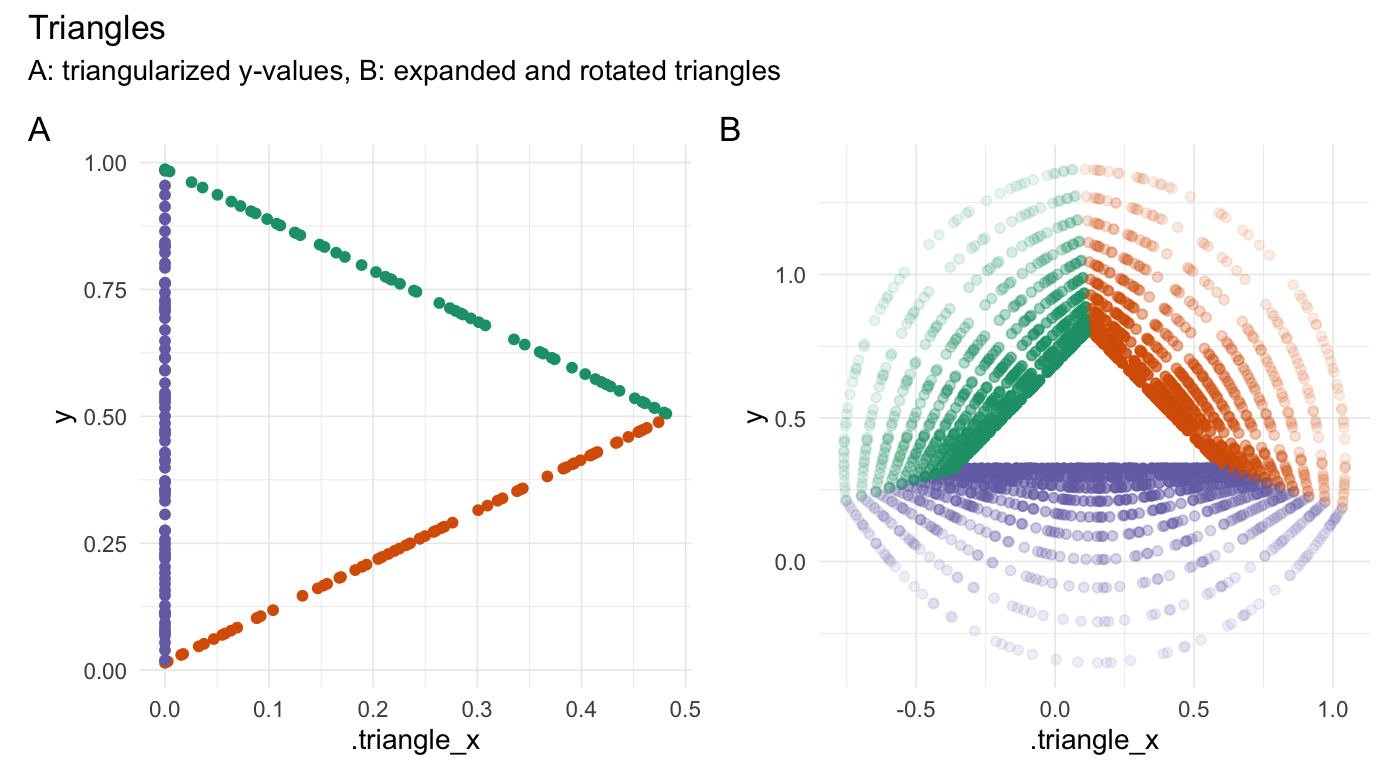
### Triangularize points
```{r}
triangularize(runif(200))
```
```{r echo=FALSE, fig.align='center', fig.width=7.6, fig.height=4.25, eval=FALSE}
xpectr::set_test_seed(10)
# Create a data frame
df <- data.frame(
"y" = runif(200)
)
df_tri <- triangularize(df, y_col = "y")
if (has_ggplot){
ggtri_1 <- df_tri %>%
ggplot(aes(x = .triangle_x, y = y, color = .edge)) +
geom_point() +
theme_minimal(base_line_size = gg_base_line_size) +
scale_colour_brewer(palette = "Dark2") +
labs(x = ".triangle_x", y = "y")
}
origin <- centroid(df_tri$.triangle_x, df_tri$y)
df_tri_expanded <- purrr::map_dfr(
.x = 1:10/10,
.f = function(mult){
expand_distances(
data = df_tri,
cols = c(".triangle_x", "y"),
multiplier = mult,
exponentiate = TRUE,
add_one_exp = FALSE,
origin = origin)
}) %>%
rotate_2d(
degrees = 90,
x_col = ".triangle_x_expanded",
y_col = "y_expanded",
suffix = "",
origin = origin
)
if (has_ggplot){
ggtri_2 <- df_tri_expanded %>%
ggplot(aes(x = .triangle_x_expanded, y = y_expanded,
color = .edge, alpha = 0.8*.exponent^2)) +
geom_point() +
theme_minimal(base_line_size = gg_base_line_size) +
scale_colour_brewer(palette = "Dark2") +
labs(x = ".triangle_x", y = "y")
combined <- (ggtri_1 + ggtri_2) & theme(legend.position = "none")
combined +
plot_annotation(title = "Triangles",
subtitle = "A: triangularized y-values, B: expanded and rotated triangles",
tag_levels = 'A')
}
```
## Generators
### Generate clusters
```{r echo=FALSE, fig.align='center', fig.width=6, fig.height=3.5}
xpectr::set_test_seed(10)
```
```{r}
generate_clusters(
num_rows = 50,
num_cols = 5,
num_clusters = 5,
compactness = 1.6
)
```
```{r echo=FALSE, fig.align='center', fig.width=6, fig.height=3.5}
xpectr::set_test_seed(10)
df_clusters <- generate_clusters(
num_rows = 50, num_cols = 5,
num_clusters = 5, compactness = 1.6
)
if (has_ggplot){
df_clusters %>%
ggplot(
aes(x = D1, y = D2, color = .cluster)) +
geom_point() +
theme_minimal(base_line_size = gg_base_line_size) +
scale_colour_brewer(palette = "Dark2") +
labs(x = "D1", y = "D2", color = "Cluster")
}
```
## Utilities
### Converters
| Function | Description |
|:----------------------|:----------------------------------------------------------------------|
|`radians_to_degrees()` |Converts radians to degrees. |
|`degrees_to_radians()` |Converts degrees to radians. |
### Scalers
| Function | Description |
|:----------------------|:----------------------------------------------------------------------|
|`min_max_scale()` |Scale values to a range. |
|`to_unit_length()` |Scale vectors to unit length *row-wise* or *column-wise*. |
### Measuring functions
| Function | Description |
|:----------------------|:----------------------------------------------------------------------|
|`distance()` |Calculates distance to an origin. |
|`angle()` |Calculates angle between points and an origin. |
|`vector_length()` |Calculates vector length/magnitude *row-wise* or *column-wise*. |
### Helper functions
| Function | Description |
|:----------------------|:----------------------------------------------------------------------|
|`create_origin_fn()` |Creates function for finding origin coordinates (like `centroid()`). |
|`centroid()` |Calculates the mean of each supplied vector/column. |
|`most_centered()` |Finds coordinates of data point closest to the centroid. |
|`is_most_centered()` |Indicates whether a data point is the most centered. |
|`midrange()` |Calculates the midrange of each supplied vector/column. |
|`create_n_fn()` |Creates function for finding the number of positions to move. |
|`median_index()` |Calculates median index of each supplied vector. |
|`quantile_index()` |Calculates quantile of indices for each supplied vector. |