Ecosyste.ms: Awesome
An open API service indexing awesome lists of open source software.
https://github.com/MrMufflon/Leaflet.Elevation
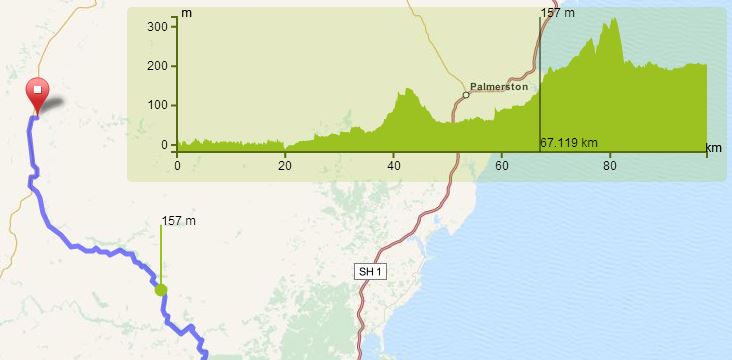
Leaflet plugin to view height profile of GeoJSON- and GPX polylines using d3
https://github.com/MrMufflon/Leaflet.Elevation
Last synced: 4 months ago
JSON representation
Leaflet plugin to view height profile of GeoJSON- and GPX polylines using d3
- Host: GitHub
- URL: https://github.com/MrMufflon/Leaflet.Elevation
- Owner: MrMufflon
- License: mit
- Created: 2013-06-13T18:27:02.000Z (over 11 years ago)
- Default Branch: master
- Last Pushed: 2020-02-01T09:37:32.000Z (about 5 years ago)
- Last Synced: 2024-11-01T22:03:33.221Z (4 months ago)
- Language: JavaScript
- Homepage: http://mrmufflon.github.io/Leaflet.Elevation
- Size: 514 KB
- Stars: 276
- Watchers: 22
- Forks: 83
- Open Issues: 38
-
Metadata Files:
- Readme: README.md
- License: LICENSE
Awesome Lists containing this project
README
        Leaflet.Elevation

=================

1. [What is this?](https://github.com/MrMufflon/Leaflet.Elevation#what-is-this)

2. [How to use](https://github.com/MrMufflon/Leaflet.Elevation#how-to-use)

3. [Install](https://github.com/MrMufflon/Leaflet.Elevation#install-with-bower)

4. [Setup development environment](https://github.com/MrMufflon/Leaflet.Elevation#setup-development-environment)

5. [Customizing styles](https://github.com/MrMufflon/Leaflet.Elevation#customizing-styles)

### What is this?

A [Leaflet](http://leafletjs.com) plugin to view an interactive height profile of polylines lines using [d3](http://d3js.org). This plugin is under development.

Supported and tested Browsers:

- Chrome

- Firefox

- IE 10+

Supported data:

- GeoJSON [Demo](http://mrmufflon.github.io/Leaflet.Elevation/example/example.html)

- GPX-files using [leaflet-gpx](https://github.com/mpetazzoni/leaflet-gpx) [Demo](http://mrmufflon.github.io/Leaflet.Elevation/example/example_gpx.html)

*Tested with Leaflet 0.4+*


### Install with npm

`` npm install leaflet.elevation ``

### Install with Bower

`` bower install leaflet.elevation ``

### How to use

Altitude information for each point is necessary in the given data.

```javascript

//all used options are the default values

var el = L.control.elevation({

  	position: "topright",

	theme: "steelblue-theme", //default: lime-theme

	width: 600,

	height: 125,

	margins: {

		top: 10,

		right: 20,

		bottom: 30,

		left: 50

	},

	useHeightIndicator: true, //if false a marker is drawn at map position

	interpolation: d3.curveLinear, //see https://github.com/d3/d3-shape/blob/master/README.md#area_curve

	hoverNumber: {

		decimalsX: 3, //decimals on distance (always in km)

		decimalsY: 0, //deciamls on hehttps://www.npmjs.com/package/leaflet.coordinatesight (always in m)

		formatter: undefined //custom formatter function may be injected

	},

	xTicks: undefined, //number of ticks in x axis, calculated by default according to width

	yTicks: undefined, //number of ticks on y axis, calculated by default according to height

	collapsed: false,  //collapsed mode, show chart on click or mouseover

	imperial: false    //display imperial units instead of metric

});

el.addTo(map);

L.geoJson(geojson,{

    onEachFeature: el.addData.bind(el) //working on a better solution

}).addTo(map);

```

```javascript

var el = L.control.elevation();

el.addTo(map);

var g=new L.GPX("./mytrack.gpx", {async: true});

g.on("addline",function(e){

	el.addData(e.line);

});

g.addTo(map);

```

```javascript

// reset data and display

el.clear();

```

### Setup development environment

If you are new to grunt please refer to the [quick start](http://gruntjs.com/getting-started) guide.

Install npm dependencies with

```

npm install

```

Run jasmine tests with

```

grunt test

```

And compile with

```

grunt

```

### Customizing styles

To generate different themes [lessCSS](http://lesscss.org/) is used. Create your own theme in a new .less file in src/css/themes. Usable variables are

```css

@theme : lime-theme;

@base-color : #9CC222; //basecolor to derive other colors from

@highlight-color : #637E0B; //basecolor to derive selections from

@background : fade(@base-color,20%); //background-color

@drag-color : fade(@highlight-color,40%); //drag selection color

@axis-color : darken(@base-color,20%); //color of axes

@stroke-color : darken(@base-color,40%); //color for mouse highlight

@stroke-width-mouse-focus : 1; //stroke width for mouse highlight

@stroke-width-height-focus: 2; //stroke width for height focus indicator

@stroke-width-axis : 2; //stroke width for axes

@icon : 'images/elevation-lime.png'; //path to icon for collapsed button

```

Add the theme file to the less- and cssmin task in the Gruntfile and you´re good to go.