https://github.com/NotYuSheng/TracePcap
Self-hosted PCAP analysis platform with LLM-powered incident triage, signature-based threat detection, and AI-generated incident narratives. Features network change monitoring across captures, deep packet inspection via nDPI, and automated Wireshark filter generation. Runs fully offline with local LLMs (Ollama, LM Studio).
https://github.com/NotYuSheng/TracePcap
ai blue-team cyber-defense cybersecurity dfir incident-response llm ndpi network-forensics network-monitoring ollama packet-analysis pcap pcap-analyzer protocol-analysis soc threat-hunting triage tshark wireshark
Last synced: 6 days ago
JSON representation
Self-hosted PCAP analysis platform with LLM-powered incident triage, signature-based threat detection, and AI-generated incident narratives. Features network change monitoring across captures, deep packet inspection via nDPI, and automated Wireshark filter generation. Runs fully offline with local LLMs (Ollama, LM Studio).
- Host: GitHub
- URL: https://github.com/NotYuSheng/TracePcap
- Owner: NotYuSheng
- License: mit
- Created: 2026-01-31T11:53:19.000Z (6 months ago)
- Default Branch: main
- Last Pushed: 2026-07-03T03:20:05.000Z (16 days ago)
- Last Synced: 2026-07-03T03:24:40.158Z (16 days ago)
- Topics: ai, blue-team, cyber-defense, cybersecurity, dfir, incident-response, llm, ndpi, network-forensics, network-monitoring, ollama, packet-analysis, pcap, pcap-analyzer, protocol-analysis, soc, threat-hunting, triage, tshark, wireshark
- Language: TypeScript
- Homepage: https://notyusheng.github.io/TracePcap/
- Size: 10.4 MB
- Stars: 27
- Watchers: 1
- Forks: 0
- Open Issues: 60
-
Metadata Files:
- Readme: README.md
- Contributing: CONTRIBUTING.md
- License: LICENSE
Awesome Lists containing this project
- awesome-starts - NotYuSheng/TracePcap - Self-hosted PCAP analysis platform with LLM-powered incident triage, signature-based threat detection, and AI-generated incident narratives. Features network change monitoring across captures, deep pa (ai)
README
TracePcap
Black-box network analysis from PCAP captures — no prior knowledge of the network required
Features •
Quick Start •
Usage •
Documentation


---
TracePcap is a self-hosted PCAP analysis workbench designed for situations where you work from the **traffic itself** — with no prior knowledge of the network. Upload one or more PCAP captures and the tool characterises devices, maps topology, reconstructs sessions, tracks changes over time, and generates AI-powered narratives — all derived purely from observed traffic.
This makes it well-suited for:
- **Network audits and third-party assessments** — handed a PCAP with no documentation; build the picture from scratch
- **Incident response** — incomplete network records; reconstruct what happened from packet evidence
- **Penetration test reconnaissance** — map an unknown or scarcely-documented network from captured traffic
- **Research and education** — explore any capture without needing context about the environment
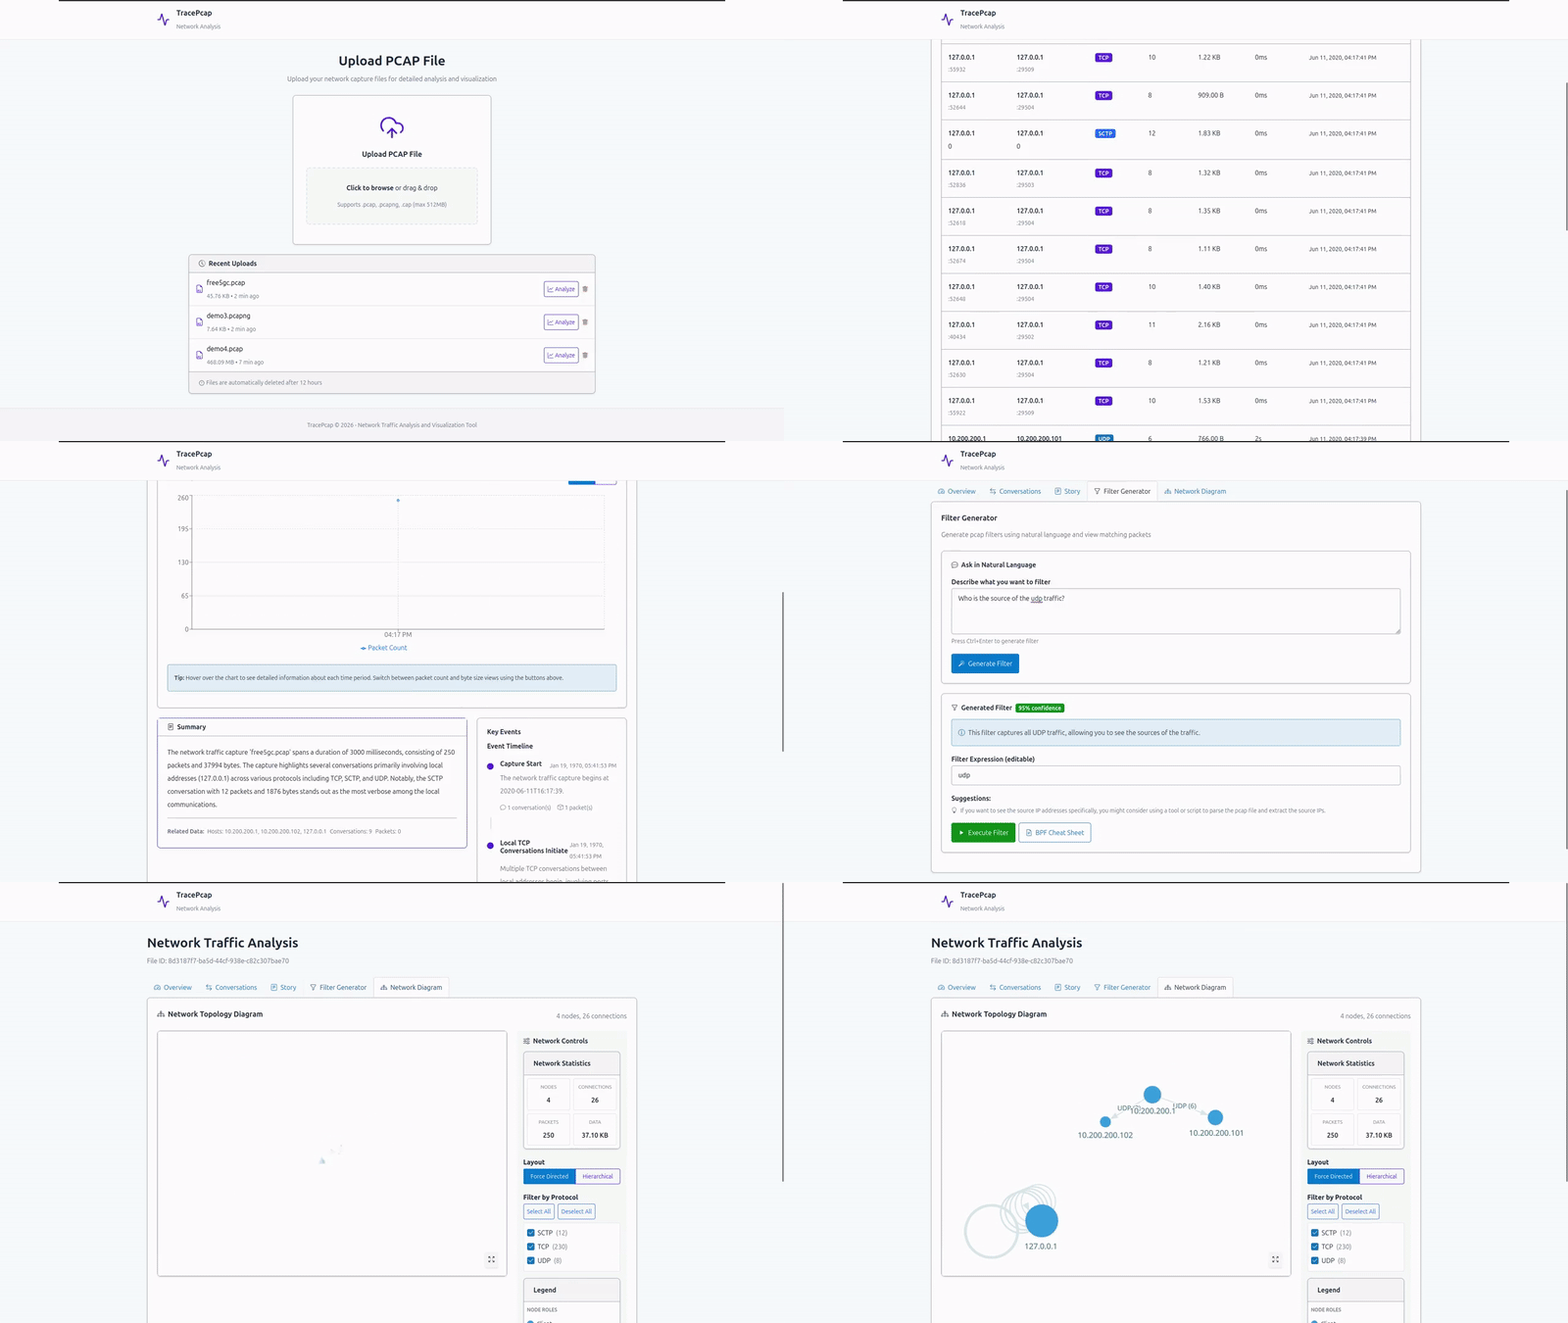
## Features
| Feature | Description |
|---------|-------------|
| **PCAP Upload & Management** | Upload and manage PCAP/PCAPNG/CAP files (upload limit derived from `APP_MEMORY_MB`, 512MB by default) with MinIO object storage; duplicate detection and configurable upload limits |
| **Network Visualization** | Interactive network topology using Sigma.js (WebGL) + graphology with ForceAtlas2 / ELK layouts, a rich filter panel (IP, port, device type, protocol, risk), fullscreen toggle, layout controls, and clickable node detail panels |
| **nDPI Security Detection** | Deep packet inspection via nDPI v5: application identification, traffic categories, risk/alert flags, JA3/JA3S TLS fingerprints, SNI extraction, and TLS certificate metadata per conversation |
| **Conversation Tracking** | Paginated conversation list with advanced filtering (IP, port, protocol, app, risk, custom rules, device type, country, payload pattern), multi-column sorting, column picker, and bulk PCAP export |
| **Session Reconstruction** | TCP/UDP application-layer payload decoding with a hex+ASCII viewer for inspecting raw packet payloads |
| **File Extraction** | HTTP object extraction and raw TCP/UDP stream extraction; automatic MIME type detection; bulk download |
| **Geolocation & Device Classification** | Country/ASN enrichment for external IPs; automatic device-type inference (Router, Server, IoT, Mobile, Laptop/Desktop) from traffic behaviour and manufacturer data |
| **MAC Manufacturer Lookup** | Wireshark OUI database integration for vendor identification from MAC addresses |
| **Timeline Analysis** | Chronological traffic visualization with configurable time granularity and protocol breakdown |
| **AI Filter Generator** | LLM-powered Wireshark/tcpdump filter generation from natural language queries with confidence scores and packet-level results |
| **Story Mode** | AI-generated narrative reconstruction of network activities with an interactive LLM Q&A chat, custom context input, and story timeline |
| **Network Monitor** | Load multiple PCAPs as ordered snapshots to track device, IP, protocol, and topology changes over time — useful for repeated audits or ongoing capture sessions |
| **Subnet Detection & Labelling** | Infer subnet structure from traffic patterns or define CIDRs manually; group observed IPs by subnet across all snapshots |
| **Node Role Annotation** | Annotate any IP or device with a role label (e.g. "SCADA Controller", "Historian"); AI-suggested from traffic signals, human-confirmable |
| **Custom Signature Rules** | YAML-based detection rules matched against IP, CIDR, port, JA3, hostname, app, and protocol fields; live-reloaded without restart |
| **Export Options** | PDF report (with live topology capture), per-conversation PCAP, bulk PCAP export, and CSV export |
| **Real-time Processing** | Asynchronous analysis with detailed progress tracking |
| **Multi-protocol Support** | TCP, UDP, ICMP, and application-layer protocols including TLS, HTTP, DNS, QUIC, and L2 protocols (ARP, STP, LLDP, CDP) |
## Quick Start
### Prerequisites
| Software | Version | Purpose |
|----------|---------|---------|
| Docker | Latest | Container runtime |
| Docker Compose | Latest | Multi-container orchestration |
| LLM Server | Any OpenAI-compatible API | AI features (e.g., LM Studio, Ollama, OpenAI) |
**Minimum Hardware:**
- RAM: 4GB (8GB+ recommended)
- Storage: 10GB (for database, PCAP files, and object storage)
### Installation
**1. Clone and setup:**
```bash
git clone https://github.com/NotYuSheng/TracePcap.git
cd TracePcap
cp .env.example .env
```
**2. Configure `.env`:**
```env
# Memory & Upload Configuration
# Upload limits are derived from this single value (max upload = 25% of it).
APP_MEMORY_MB=2048 # 512MB max upload (default)
# Nginx Port Configuration
NGINX_PORT=80 # Change if port 80 is already in use
# LLM Configuration (Local LLM Server)
LLM_API_BASE_URL=http://localhost:1234/v1
LLM_API_KEY=
LLM_MODEL=Qwen2.5-14B-Coder-Instruct
LLM_TEMPERATURE=0.7
LLM_MAX_TOKENS=8000
```
**3. Start the application:**
```bash
docker compose up -d
```
**4. Access TracePcap:**
Open **http://localhost:80** in your browser.
> **Note**: First startup may take a minute while PostgreSQL and MinIO initialise. AI features require a running LLM server pointed to by `LLM_API_BASE_URL`; all other features work without it.
## Usage
### Single-file Analysis
1. **Upload** — Drag-and-drop a PCAP/PCAPNG file; optionally enable nDPI analysis and file extraction
2. **Analyze** — File is processed asynchronously; a progress view shows each analysis stage
3. **Overview** — Review detected applications, protocols, risk alerts, and custom signature matches
4. **Visualize** — Explore the interactive network topology with filters, layout controls, and node detail panels
5. **Conversations** — Review flows with advanced filtering, session reconstruction, and payload inspection
6. **Story Mode** — Read the AI-generated narrative and ask follow-up questions via LLM chat
7. **Extracted Files** — Browse and download files recovered from HTTP responses and raw streams
8. **Generate Filters** — Use AI to create Wireshark/tcpdump filters from natural language
9. **Export** — Download a PDF report, per-conversation or bulk PCAP, or CSV
### Multi-file Network Monitor
The Network Monitor lets you build a picture of an unknown network from multiple captures taken at different points in time — and track how it changes between them.
1. **Create a Network** — Give the network a name (e.g. "Client Site — Building A")
2. **Add Snapshots** — Upload PCAPs in capture order; each becomes a snapshot ordered by capture time
3. **Review the Diagram** — Click any snapshot filename to open the network diagram; changed nodes are highlighted by severity
4. **Track Drift** — Device, IP, protocol, and VPN changes are detected automatically between consecutive snapshots
5. **Define Subnets** — Use "Detect Subnets" to infer CIDR blocks from traffic, or add them manually; IPs are then grouped by subnet in the IP Addresses panel
6. **Annotate Nodes** — Click any IP or device to assign a role label; use "Suggest with AI" to auto-generate one from traffic signals
7. **Correlate Events** — Log real-world events (maintenance windows, incidents) to correlate with observed network changes
8. **Generate Insights** — Use the AI insights panel to get a narrative explanation of all changes across snapshots
### Supported File Formats
PCAP, PCAPNG, CAP (max 512MB default, derived from `APP_MEMORY_MB`)
## How Network Monitor Works
The Monitor is designed for black-box retrospective analysis — it assumes you know nothing about the network upfront and builds understanding from the traffic itself:
- **No prior knowledge needed** — subnet structure, device roles, and topology are all inferred from observed traffic
- **Snapshots, not agents** — there is no persistent sensor; you feed in PCAPs and the tool compares them
- **Bottom-up inventory** — devices and IPs are discovered from ARP, MAC addresses, and IP conversations; not imported from a CMDB
- **Inference over assumption** — device types, manufacturers, and roles are estimated from traffic patterns and can be confirmed or corrected by the analyst
- **Change detection without a baseline** — the first snapshot becomes the implicit baseline; every subsequent snapshot is compared against the one before it
This is intentionally different from a blue team SIEM or EDR: there is no always-on agent, no rule engine with predefined baselines, and no assumption that you have network documentation. The tool is most useful when you are the one trying to *produce* that documentation.
### Change Detection
Changes are compared between consecutive snapshots (ordered by capture time):
| Severity | Event Type | Description |
|----------|-----------|-------------|
| CRITICAL | `IP_MAC_DRIFT` | An IP is now claimed by a different MAC — possible ARP spoofing or device swap |
| CRITICAL | `GATEWAY_CHANGE` | Default gateway IP changed between snapshots |
| WARNING | `MAC_ADDED` | A new MAC address appeared — new device on the network |
| WARNING | `IP_MAC_DRIFT` | A known MAC moved to a new IP — possible DHCP drift |
| INFO | `PROTOCOL_ADDED` | A new layer-7 protocol appeared |
| INFO | `APP_ADDED` | A new application name appeared |
| INFO | `ASN_CHANGE` | The top external peer shifted ISP/ASN |
| INFO | `VPN_DRIFT` | VPN usage appeared or disappeared |
## Tech Stack
| Component | Technology |
|-----------|------------|
| **Backend** | Spring Boot 3.2.1, Java 21, Maven, Lombok, MapStruct |
| **Frontend** | React 19, Vite, TypeScript, SGDS React |
| **Visualization** | Sigma.js + graphology + ELK (network topology), React Flow (Network Intelligence cluster graph), Recharts, D3.js |
| **Reverse Proxy** | Nginx |
| **Packet Parsing** | tshark / Wireshark, nDPI v5 (deep packet inspection) |
| **Database** | PostgreSQL 15 with Flyway migrations |
| **Object Storage** | MinIO (S3-compatible) |
| **Containerization** | Docker, Docker Compose |
| **API Documentation** | SpringDoc OpenAPI (Swagger UI) |
## Documentation
Full documentation is available at **https://notyusheng.github.io/TracePcap**.
API documentation is also available via Swagger UI at **http://localhost:80/swagger-ui.html** when the application is running.
## Common Tasks
### View Logs
```bash
# All services
docker compose logs -f
# Specific service
docker compose logs -f tracepcap-backend
docker compose logs -f postgres
docker compose logs -f minio
```
### Restart Services
```bash
docker compose restart
docker compose restart tracepcap-backend
```
### Backup Data
```bash
# Backup database
docker exec tracepcap-postgres pg_dump -U tracepcap_user tracepcap > backup.sql
# Backup MinIO data (PCAP files)
docker exec tracepcap-minio mc mirror minio/tracepcap-files ./backup-pcaps/
# Backup all volumes
sudo tar -czf tracepcap_backup.tar.gz /var/lib/docker/volumes/tracepcap_*
```
### Access Database
```bash
docker exec -it tracepcap-postgres psql -U tracepcap_user tracepcap
```
### Access MinIO Console
Navigate to **http://localhost:9001** and login with `minioadmin` / `minioadmin`.
### Access Swagger API Documentation
Navigate to **http://localhost:80/swagger-ui.html** to explore the API interactively.
## Deployment
TracePcap is designed for self-hosted deployment.
### Offline / Air-gapped Deployment
For environments without internet access:
**On an internet-connected machine:**
> **Windows users**: These scripts require a Bash shell. Use **Git Bash** or **WSL** — not CMD or PowerShell.
```bash
# Pull all third-party images, build local images, and save everything as .tar files
bash scripts/pull-and-save-images.sh
```
**Transfer to the offline machine:** the generated `images/` directory, `docker-compose.offline.yml`, `scripts/load-images.sh`, and your configured `.env`.
**On the offline machine:**
```bash
bash scripts/load-images.sh
docker compose -f docker-compose.offline.yml up -d
```
> The offline compose file defaults `LLM_API_BASE_URL` to `http://localhost:1234/v1` (LM Studio). Configure a locally-hosted LLM before starting if you want AI features.
---
**Production hardening:**
- Change default MinIO credentials in `docker-compose.yml`
- Update PostgreSQL password
- Configure reverse proxy with SSL/TLS
- Adjust `APP_MEMORY_MB` based on your needs (upload limit is derived from it)
- Add an authentication layer for multi-user deployments
## Security
- **Local Processing**: All PCAP analysis runs on your server — packet data never leaves your infrastructure
- **Offline-capable**: GeoIP uses a bundled DB-IP MMDB as fallback; LLM queries use a configurable local endpoint
- **No Authentication by default**: runs fully open; turn on OIDC/Keycloak auth before exposing to multiple users (see [Authentication](#authentication-oidc--keycloak))
- **Object Storage**: MinIO provides S3-compatible secure file storage; not exposed outside the Docker network
## Authentication (OIDC / Keycloak)
Authentication is **disabled by default** — the base `docker-compose.yml` runs the app fully open, exactly as before (suitable for single-user / trusted-network deployments like Lanturn).
To run with login enabled, use the production overlay, which bundles a Keycloak identity provider and rebuilds the frontend with the OIDC client. Set `PUBLIC_URL` to the exact origin you browse to (scheme + host + port):
```bash
PUBLIC_URL=http://localhost:8888 \
docker compose -f docker-compose.yml -f docker-compose.prod.yml up -d --build
```
The Keycloak admin console is reachable at `${PUBLIC_URL}/admin` — default `user` / `P@ssw0rd`. **Override `KEYCLOAK_ADMIN` / `KEYCLOAK_ADMIN_PASSWORD` for any real deployment.**
Set `PUBLIC_URL` to the exact origin you browse to. For any non-`localhost` deployment this must be an **HTTPS** origin (see the secure-context note below); plain-HTTP LAN/Tailscale IPs only work if you terminate TLS in front of nginx. It defaults to `http://localhost:${NGINX_PORT:-8888}`.
> **⚠️ Requires a secure context (HTTPS or localhost).** OIDC login uses the browser Web Crypto API (PKCE), which browsers expose **only over HTTPS or via `http://localhost`**. Serving the app over plain HTTP on a LAN/VPN IP (e.g. `http://192.168.x.x:8888` or a Tailscale `http://100.x.y.z:8888`) will fail at login with *"Crypto.subtle is available only in secure contexts"*. Put TLS in front and set `PUBLIC_URL` to the HTTPS origin — e.g. a reverse proxy that terminates TLS, or, on a tailnet, `tailscale serve --bg --https=443 http://localhost:8888` (browse to the `https://..ts.net` MagicDNS name). For single-admin use, an SSH tunnel to `http://localhost:8888` also works (localhost is a secure context).
This:
- Starts **Keycloak** (auto-importing the `tracepcap` realm from [`keycloak/realm-export.json`](keycloak/realm-export.json) — a public PKCE SPA client `tracepcap-frontend` and a demo user) and **proxies it through nginx on the same origin as the app**. The browser reaches the identity provider at the same host:port it loaded the app from — no second exposed port, no CORS.
- Gates the entire backend API behind a valid Keycloak JWT (Spring OAuth2 resource server).
- Redirects unauthenticated users to the Keycloak login page and adds a user chip + logout button to the header.
**Default demo login:** `analyst` / `analyst` — change this (and the Keycloak admin password) for any real deployment. The Keycloak admin console is proxied at `${PUBLIC_URL}/admin` (`admin` / `admin` by default).
### How it works
| Concern | Where |
| --- | --- |
| Master switch | `TRACEPCAP_AUTH_ENABLED` (backend) + `VITE_AUTH_ENABLED` (frontend build arg), both default `false` |
| Backend security | `com.tracepcap.config.security` — two env-gated `SecurityFilterChain`s: permit-all when off, JWT-required when on |
| Public origin | `PUBLIC_URL` pins Keycloak's `KC_HOSTNAME` (token issuer) and the backend's `KEYCLOAK_ISSUER_URI`. The browser must load the app via this same origin |
| Issuer vs. keys | Backend validates the token `iss` against `KEYCLOAK_ISSUER_URI` (public) but fetches signing keys from `KEYCLOAK_JWK_SET_URI` (internal `keycloak:8080`), so the two hostnames need not match in Docker |
| Same-origin proxy | nginx proxies `/realms`, `/resources`, `/admin`, `/js` to Keycloak (see `nginx/nginx.conf.template`); the SPA derives its OIDC authority from `window.location` at runtime |
| Frontend | `src/auth/` — `react-oidc-context` provider mounted only when auth is enabled |
Data is **shared across all authenticated users** (no per-user ownership) in this version — so disabling auth never strands data behind a missing user. Per-user scoping and concurrent-edit conflict handling are tracked separately (issues #360, #444).
> The overlay keeps the working runtime profile (it does not switch Spring to the `prod` profile, which expects external log volumes and additional required env vars). It changes only what auth needs: the Keycloak service, the auth env vars, and the frontend build args.
## Custom Signature Rules
TracePcap supports user-defined detection rules matched against every conversation after nDPI analysis. Matched rule names appear as colour-coded badges in the Conversations tab and Overview.
### Rule format
```yaml
signatures:
- name: rule_name_shown_in_ui # shown as a badge
description: Human-readable description
severity: low # low | medium | high | critical
match:
ip: "203.0.113.42" # exact match against srcIp OR dstIp
```
Rules fire when **all** specified match fields are satisfied. All fields are optional.
### Match fields
| Field | Type | Description | Example |
|-------|------|-------------|---------|
| `ip` | string | Exact match against srcIp or dstIp | `"203.0.113.42"` |
| `cidr` | string | CIDR range match against srcIp or dstIp | `"10.0.0.0/8"` |
| `srcPort` | number | Exact source port | `67` |
| `dstPort` | number | Exact destination port | `4444` |
| `ja3` | string | Exact JA3S fingerprint hash | `"82f0d8a75fa483d1cfe4b7085b784d7e"` |
| `hostname` | string | Exact or wildcard SNI hostname — `*.evil.com` matches any subdomain | `"*.evil.com"` |
| `app` | string | Case-insensitive nDPI application name | `"Telegram"`, `"TOR"` |
| `protocol` | string | Case-insensitive transport protocol | `"TCP"`, `"UDP"` |
Click **Custom Detection Rules** in the navbar to open the built-in YAML editor. Changes take effect on the next analysis run — no restart required.
A full set of demo rules covering every match field is in [`signatures.sample.yml`](signatures.sample.yml). The script [`sample-files/gen_demo.py`](sample-files/gen_demo.py) generates a PCAP that triggers all 12 rules.
## Sample Files
The [`sample-files/`](sample-files/) directory contains example PCAPs:
- `atm_capture1.cap` — ATM network traffic sample
- `free5gc.pcap` — 5G core network traffic sample
- `demo_all_rules.pcap` — Triggers all 12 custom signature demo rules
- `dns_demo.pcap` — Two LAN resolvers answering a variety of DNS record types (A, AAAA, CNAME, MX, TXT, PTR, SRV) for the Network Intelligence "DNS Servers" view. Regenerate with [`sample-files/gen_dns_demo.py`](sample-files/gen_dns_demo.py)
- `http_demo.pcap` — A JSON API server, a plain website, and a host under endpoint enumeration (mostly 404s) — drives the web/API-server classification and the node-modal HTTP endpoint log. Regenerate with [`sample-files/gen_http_demo.py`](sample-files/gen_http_demo.py)
- `monitor_large/` — 8 weekly snapshots of a simulated 550-node office network for testing the Network Monitor
## Star History

## License
This project is licensed under the MIT License. See [LICENSE](LICENSE) for details.