Ecosyste.ms: Awesome
An open API service indexing awesome lists of open source software.
https://github.com/Parkkeo1/Reddit_Unlocked
:chart_with_upwards_trend: A Python web app that analyzes popular trends of subreddits with data pulled from Reddit and news articles.
https://github.com/Parkkeo1/Reddit_Unlocked
news-articles newspaper praw reddit reddit-api reddit-crawler subreddit trend-analysis trending-topics
Last synced: 3 months ago
JSON representation
:chart_with_upwards_trend: A Python web app that analyzes popular trends of subreddits with data pulled from Reddit and news articles.
- Host: GitHub
- URL: https://github.com/Parkkeo1/Reddit_Unlocked
- Owner: Parkkeo1
- Created: 2017-09-23T17:16:55.000Z (over 7 years ago)
- Default Branch: master
- Last Pushed: 2018-01-21T21:09:12.000Z (about 7 years ago)
- Last Synced: 2024-08-01T13:36:05.879Z (6 months ago)
- Topics: news-articles, newspaper, praw, reddit, reddit-api, reddit-crawler, subreddit, trend-analysis, trending-topics
- Language: Jupyter Notebook
- Homepage:
- Size: 9.05 MB
- Stars: 23
- Watchers: 3
- Forks: 7
- Open Issues: 1
-
Metadata Files:
- Readme: README.md
Awesome Lists containing this project
README
# Reddit_Unlocked: A Reddit-cal Analysis of The Web
A program for analyzing & visualizing data pulled from the Reddit API and scraped from news articles.
### What is Reddit_Unlocked?
Reddit_Unlocked is a program based primarily on Python that analyzes & visualizes data pulled from the Reddit API and scraped from news articles. Our program implements various libraries, such as Newspaper and PRAW, to gather insight about the popular types of content and trends on Reddit.
### The Reddit_Unlocked Group
Isaac - Data Extraction, Web Application (Flask + Frontend)
Jayam - Data Analysis (Keyword Extraction + Sentiment Analysis)
Gary - Data Visualization (Comprehensive Visual Overviews of Trend Analyses)
### The Why
According to Alexa, Reddit is the 5th most visited website in the United States (and 8th in the world). As a social news aggregation, web content rating, and discussion website, Reddit represents a very significant portion of America's population of internet users. As evidenced by Reddit's higher-than-most typical per-user visit time of almost 16 minutes per day (compared to 10 minutes for Facebook and 6 for Twitter), Reddit tends to pull in users who are more likely to spend their time engaging in longer and thorough discussions to express their opinions and ideas.
On top of all this, Reddit's voting and commenting features for every discussion "thread" enable each sub-community (subreddit) to not only aggregate news but also its users' sentiments toward and reactions to the wide range of topics in these threads. In conclusion, Reddit is essentially a goldmine for gathering and analyzing data on how the internet thinks and reacts to real-life issues and events. For our project, we wanted to tap into this goldmine to gather insights about the popular trends that permeate throughout the Reddit population and its sub-communities.
### The How
Thanks to Reddit's voting feature, the best first step to gaining insight about a subreddit's prevalent and popular topics is to look at its most upvoted threads in a given timeframe (day, week, month, year, or lifetime). For our project, we chose to analyze the top ~50 threads in the past week of a subreddit. We concluded that, after testing our program with other timeframes, a week was optimal for balancing recent and popular threads. Thus, Reddit Unlocked pulls data about these top weekly threads from the Reddit API (upvote %, post title, relevant links, etc).
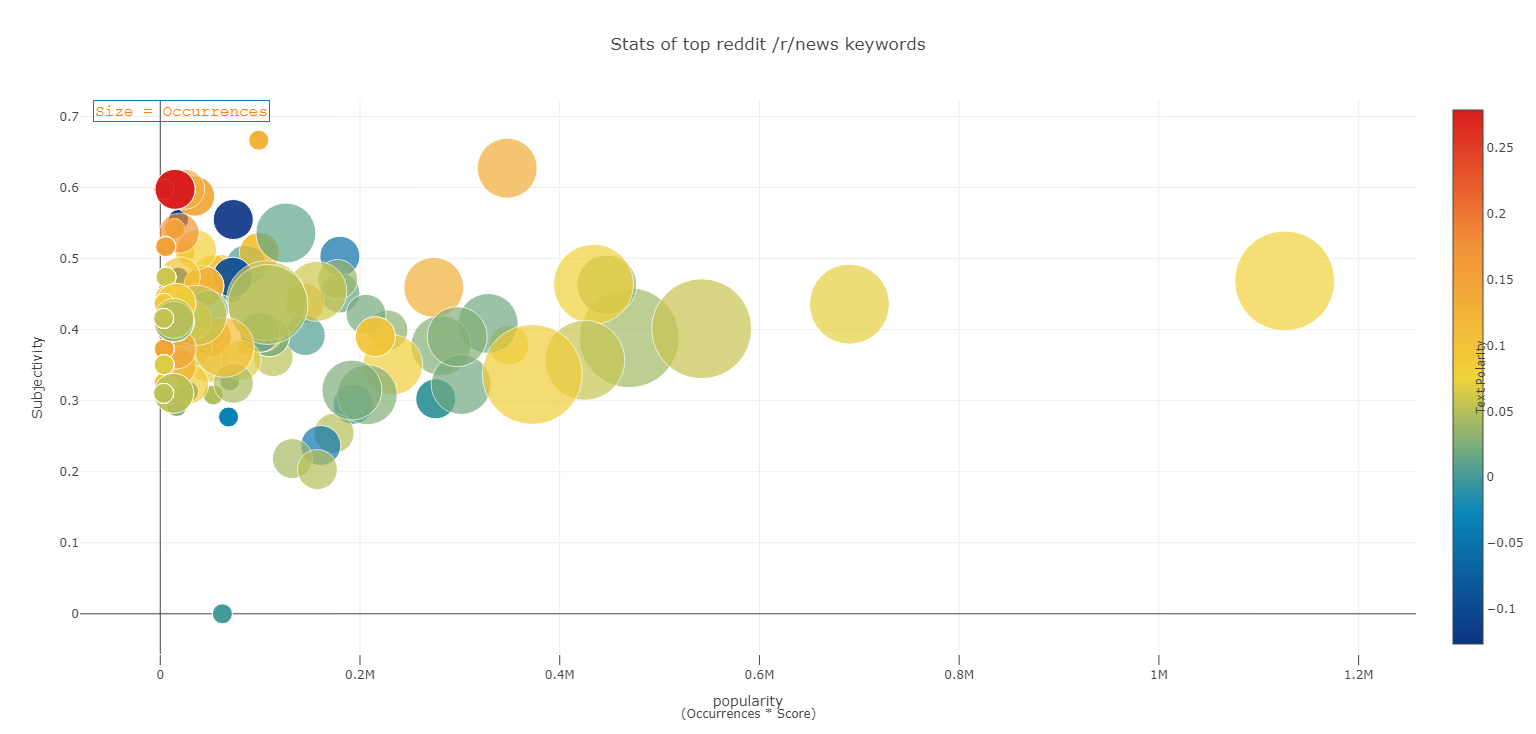
The collected thread data serves as the basis for our data analysis. Also, the webscraping algorithm crawls links to news articles from Reddit posts for more text. The keyword extraction and sentiment analysis algorithms are run on the compiled text data to generate a list of the most occurring/popular important keywords with corresponding sentiment values (polarity and subjectivity) attached to each keyword. Finally, a graph that acccounts for all of the resulting data (frequency, sentiment, upvotes, etc) is generated for the user.

Each colored bubble can be hovered over to show which keyword it represents. Since the above is only a static image, this example plot can be viewed [here.](https://plot.ly/~reddit_unlocked/100)