https://github.com/PhDMeiwp/ggtrendline
ggtrendline: An R Package for Adding Trendline and Confidence Interval to 'ggplot'.
https://github.com/PhDMeiwp/ggtrendline
Last synced: about 1 year ago
JSON representation
ggtrendline: An R Package for Adding Trendline and Confidence Interval to 'ggplot'.
- Host: GitHub
- URL: https://github.com/PhDMeiwp/ggtrendline
- Owner: PhDMeiwp
- Created: 2022-04-13T13:51:22.000Z (about 4 years ago)
- Default Branch: master
- Last Pushed: 2022-05-04T11:55:38.000Z (about 4 years ago)
- Last Synced: 2025-04-26T22:34:40.408Z (about 1 year ago)
- Language: R
- Homepage: https://CRAN.R-project.org/package=ggtrendline
- Size: 99.6 KB
- Stars: 26
- Watchers: 1
- Forks: 1
- Open Issues: 6
-
Metadata Files:
- Readme: README.md
Awesome Lists containing this project
- awesome-ggplot2 - ggtrendline
README
# ggtrendline: an R package for adding trendline and confidence interval to ggplot
[](http://cran.rstudio.com/web/packages/ggtrendline)
[](https://github.com/metacran/cranlogs.app)
## 1. Installing "ggtrendline" package in R
- Get the released version from CRAN:
install.packages("ggtrendline")
- Or the development version from Github:
install.packages("devtools")
devtools::install_github("PhDMeiwp/ggtrendline@master", force = TRUE)
library(ggtrendline)
## 2. Using "ggtrendline" package
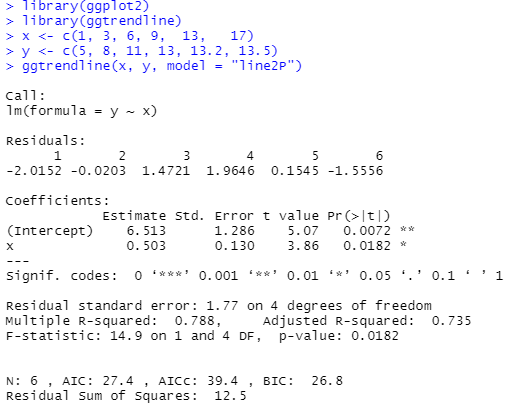
library(ggplot2)
library(ggtrendline)
x <- c(1, 3, 6, 9, 13, 17)
y <- c(5, 8, 11, 13, 13.2, 13.5)
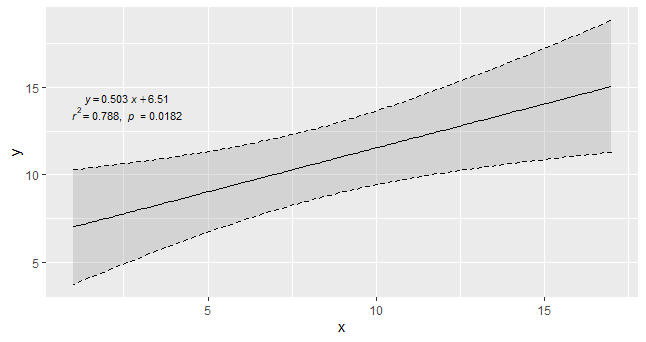
### 2.1 default ("line2P")
ggtrendline(x, y, model = "line2P")
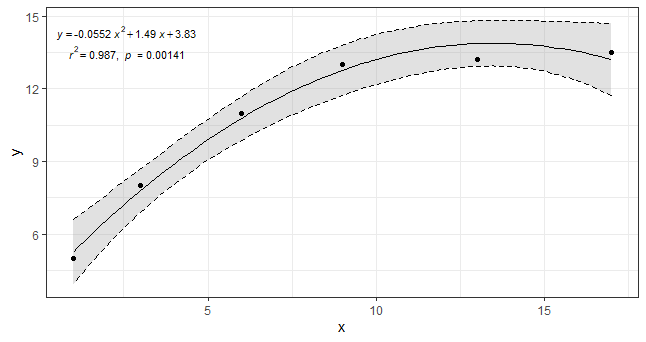
### 2.2 add geom_point()
ggtrendline(x, y, model = "line3P") + geom_point(aes(x, y)) + theme_bw()
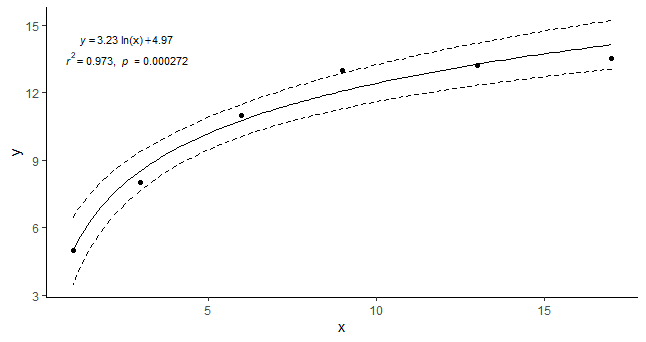
### 2.3 CI lines only, without CI filling
ggtrendline(x, y, model = "log2P", CI.fill = NA) +
geom_point(aes(x, y))+ theme_classic()
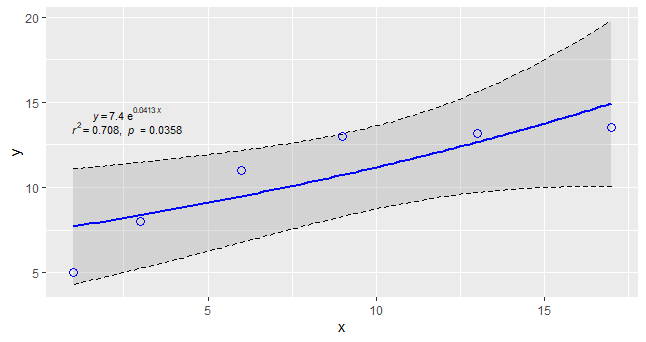
### 2.4 set the regression line and geom_point()
ggtrendline(x, y, model = "exp2P", linecolor = "blue", linetype = 1, linewidth = 1) +
geom_point(aes(x, y), color = "blue", shape = 1, size = 3)
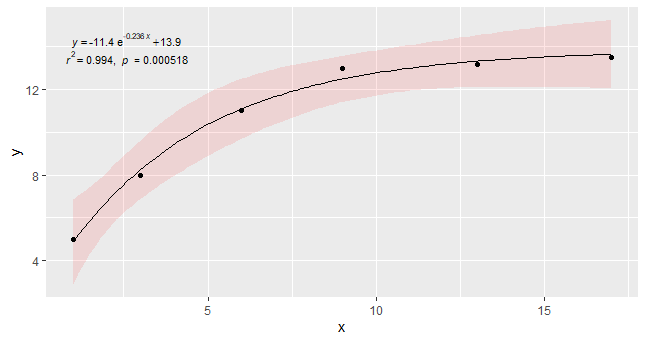
### 2.5 set confidence interval
ggtrendline(x, y, model = "exp3P", CI.level = 0.99,
CI.fill = "red", CI.alpha = 0.1, CI.color = NA, CI.lty = 2, CI.lwd = 1.5) +
geom_point(aes(x, y))
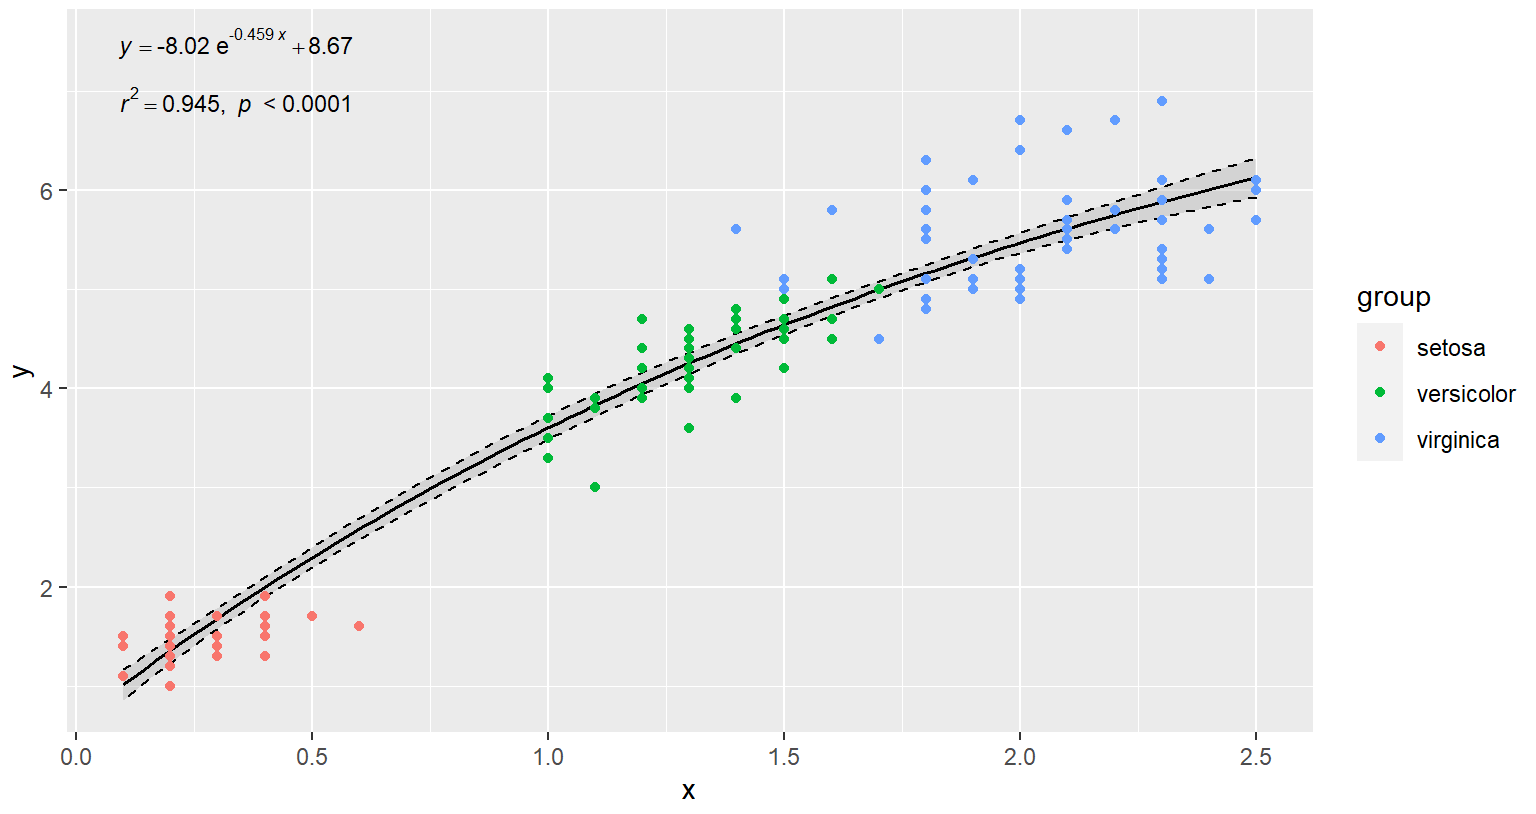
### 2.6 one trendline with different points belonged to multiple groups.
library(ggplot2)
library(ggtrendline)
data("iris")
x <- iris$Petal.Width
y <- iris$Petal.Length
group <- iris$Species
ggtrendline(x,y,"exp3P") + geom_point(aes(x,y,color=group))
## 3. Details
### 3.1 Description
The 'ggtrendline' package is developed for adding **trendline and confidence interval** of **linear or nonlinear regression** model, and
**showing equation, R square, and P value** to 'ggplot' as simple as possible.
For a general overview of the methods used in this package,
see Ritz and Streibig (2008) and
Greenwell and Schubert Kabban (2014) .
### 3.2 ggtrendline function
The built-in 'ggtrendline()' function includes the following models:
"line2P", formula as: y = a\*x + b;
"line3P", y = a\*x^2 + b\*x + c;
"log2P" , y = a\*ln(x) + b;
"exp2P", y = a\*exp(b\*x);
"exp3P", y = a\*exp(b\*x) + c;
"power2P", y = a\*x^b;
"power3P", y = a\*x^b + c.
### 3.3 stat_eq and stat_rrp functions
**The built-in 'stat_eq()' and 'stat_rrp()' functions can be used separately, i.e., not together with 'ggtrendline()' function.**
To see more details, you can run the following R code if you have the "ggtrendline" package installed:
library(ggtrendline)
?ggtrendline
?stat_eq
?stat_rrp
## 4. Contact
- Bugs and feature requests can be filed to https://github.com/PhDMeiwp/ggtrendline/issues.
- BTW, [Pull requests](https://github.com/PhDMeiwp/ggtrendline/pulls) are also welcome.
## 5. Acknowledgements
We would like to express our special thanks to **Uwe Ligges, Gregor Seyer, and CRAN team** for their valuable comments to the 'ggtrendline' package.