Ecosyste.ms: Awesome
An open API service indexing awesome lists of open source software.
https://github.com/PrometheusClientNet/Prometheus.Client
.NET client for Prometheus
https://github.com/PrometheusClientNet/Prometheus.Client
metrics prometheus prometheus-client
Last synced: about 2 months ago
JSON representation
.NET client for Prometheus
- Host: GitHub
- URL: https://github.com/PrometheusClientNet/Prometheus.Client
- Owner: prom-client-net
- License: mit
- Created: 2017-03-03T09:44:01.000Z (over 7 years ago)
- Default Branch: main
- Last Pushed: 2024-04-12T01:04:58.000Z (5 months ago)
- Last Synced: 2024-04-13T18:32:35.462Z (5 months ago)
- Topics: metrics, prometheus, prometheus-client
- Language: C#
- Homepage:
- Size: 1.15 MB
- Stars: 126
- Watchers: 3
- Forks: 21
- Open Issues: 2
-
Metadata Files:
- Readme: README.md
- Funding: .github/FUNDING.yml
- License: LICENSE
- Codeowners: .github/CODEOWNERS
Awesome Lists containing this project
- awesome-dotnet-core - Prometheus.Client - .NET Client for [Prometheus](https://prometheus.io). (Frameworks, Libraries and Tools / Code Analysis and Metrics)
- awesome-dotnet-core - Prometheus.Client - Prometheus客户端。 (框架, 库和工具 / 代码分析和指标)
- awesome-dotnet-core - Prometheus.Client - .NET Client for [Prometheus](https://prometheus.io). (Frameworks, Libraries and Tools / Code Analysis and Metrics)
- fucking-awesome-dotnet-core - Prometheus.Client - .NET Client for 🌎 [Prometheus](prometheus.io). (Frameworks, Libraries and Tools / Code Analysis and Metrics)
README
# Prometheus.Client
[](https://github.com/prom-client-net/prom-client/actions/workflows/ci.yml)
[](https://www.nuget.org/packages/Prometheus.Client)
[](https://www.nuget.org/packages/Prometheus.Client)
[](https://app.codecov.io/gh/prom-client-net/prom-client)
[](https://www.codefactor.io/repository/github/prom-client-net/prom-client)
[](https://github.com/prom-client-net/prom-client/blob/main/LICENSE)
.NET Client library for [prometheus.io](https://prometheus.io/)
It was started as a fork of [prometheus-net](https://github.com/prometheus-net/prometheus-net), but over time the library was evolved into a different product. Our main goals:
- Keep possibility of rapid development.
- Extensibility is one of the core values, together with performance and minimal allocation.
- We are open for suggestions and new ideas, contribution is always welcomed.
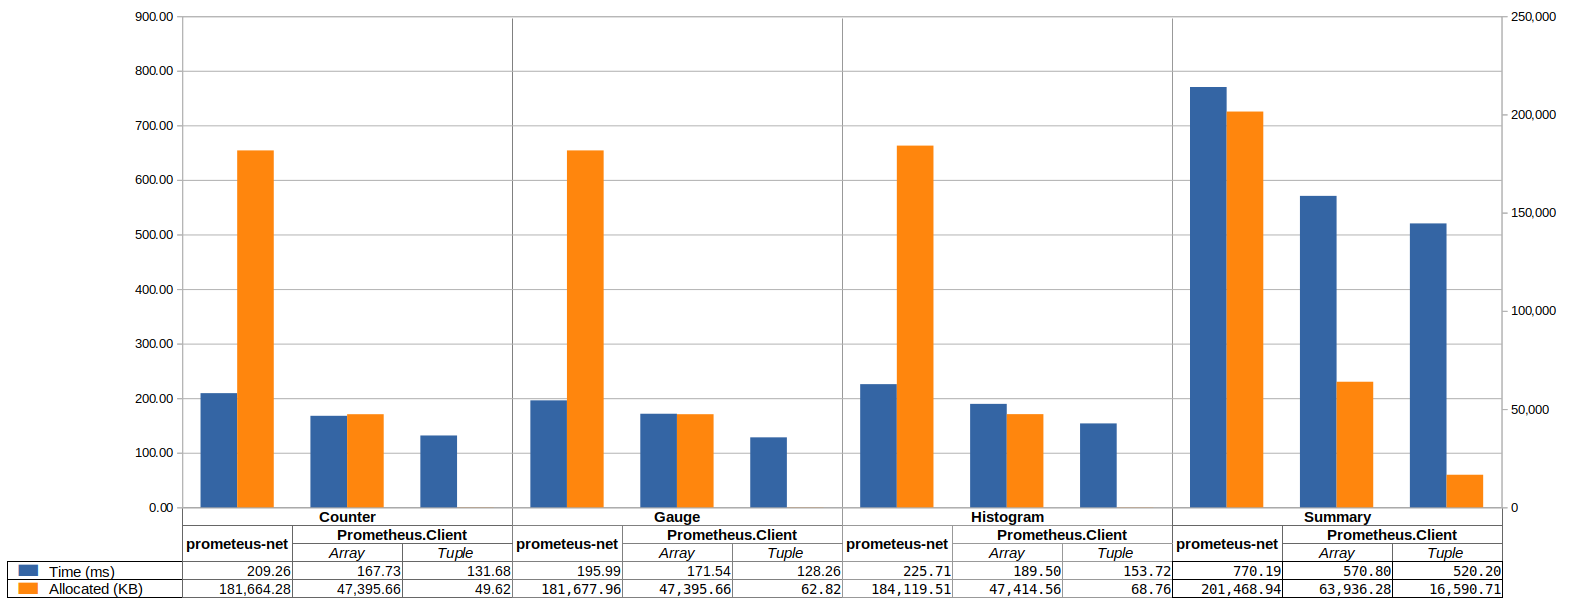
## Performance comparison with prometheus-net

Find more details on [benchmarks description](https://github.com/prom-client-net/prom-client/blob/main/docs/benchmarks/GeneralUseCase.md)
## Installation
```sh
dotnet add package Prometheus.Client
```
### Extensions
| Name | Description |
|---|--------------------------|
| [Prometheus.Client.AspNetCore](https://github.com/prom-client-net/prom-client-aspnetcore) | ASP.NET Core middleware |
| [Prometheus.Client.DependencyInjection](https://github.com/prom-client-net/prom-client-dependencyinjection) | DependencyInjection support |
| [Prometheus.Client.HttpRequestDurations](https://github.com/prom-client-net/prom-client-httprequestdurations) | Metrics logging of request durations |
| [Prometheus.Client.MetricPusher](https://github.com/prom-client-net/prom-client-metricpusher) | Push metrics to a PushGateway |
| [Prometheus.Client.MetricPusher.HostedService](https://github.com/prom-client-net/prom-client-metricpusher-hostedservice) | MetricPusher as HostedService |
| [Prometheus.Client.HealthChecks](https://github.com/prom-client-net/prom-client-healthchecks) | HealthChecks Publisher |
| [Prometheus.Client.MetricServer](https://github.com/prom-client-net/prom-client-metricserver) | Standalone Kestrel server |
| [Prometheus.Client.Owin](https://github.com/prom-client-net/prom-client-owin) | Owin middleware |
## Configuration
[Examples](https://github.com/prom-client-net/prom-examples)
[Prometheus Docs](https://prometheus.io/docs/introduction/overview/)
## Quick start
- Add `IMetricFactory` and `ICollectorRegistry` into DI container with extension library `Prometheus.Client.DependencyInjection`
```c#
public void ConfigureServices(IServiceCollection services)
{
services.AddMetricFactory();
}
```
- Add metrics endpoint
With `Prometheus.Client.AspNetCore`:
```c#
public void Configure(IApplicationBuilder app, IHostingEnvironment env, ILoggerFactory loggerFactory, IApplicationLifetime appLifetime)
{
app.UsePrometheusServer();
}
```
Or without extension:
```c#
[Route("[controller]")]
public class MetricsController : Controller
{
private readonly ICollectorRegistry _registry;
public MetricsController(ICollectorRegistry registry)
{
_registry = registry;
}
[HttpGet]
public async Task Get()
{
Response.StatusCode = 200;
await using var outputStream = Response.Body;
await ScrapeHandler.ProcessAsync(_registry, outputStream);
}
}
```
For collect http requests, use `Prometheus.Client.HttpRequestDurations`.
It does not depend of `Prometheus.Client.AspNetCore`, however together it's very convenient to use:
```c#
public void Configure(IApplicationBuilder app, IHostingEnvironment env, ILoggerFactory loggerFactory, IApplicationLifetime appLifetime)
{
app.UsePrometheusServer();
app.UsePrometheusRequestDurations();
}
```
### Instrumenting
Four types of metric are offered: `Counter`, `Gauge`, `Summary` and `Histogram`.
See the documentation on [metric types](http://prometheus.io/docs/concepts/metric_types/)
and [instrumentation best practices](http://prometheus.io/docs/practices/instrumentation/#counter-vs.-gauge-vs.-summary)
on how to use them.
### Counter
Counters go up, and reset when the process restarts.
```c#
var counter = metricFactory.CreateCounter("myCounter", "some help about this");
counter.Inc(5.5);
```
### Gauge
Gauges can go up and down.
```c#
var gauge = metricFactory.CreateGauge("gauge", "help text");
gauge.Inc(3.4);
gauge.Dec(2.1);
gauge.Set(5.3);
```
### Summary
Summaries track the size and number of events.
```c#
var summary = metricFactory.CreateSummary("mySummary", "help text");
summary.Observe(5.3);
```
### Histogram
Histograms track the size and number of events in buckets.
This allows for aggregate calculation of quantiles.
```c#
var hist = metricFactory.CreateHistogram("my_histogram", "help text", buckets: new[] { 0, 0.2, 0.4, 0.6, 0.8, 0.9 });
hist.Observe(0.4);
```
The default buckets are intended to cover a typical web/rpc request from milliseconds to seconds.
They can be overridden passing in the `buckets` argument.
### Labels
All metrics can have labels, allowing grouping of related time series.
See the best practices on [naming](http://prometheus.io/docs/practices/naming/)
and [labels](http://prometheus.io/docs/practices/instrumentation/#use-labels).
Taking a counter as an example:
```c#
var counter = metricFactory.CreateCounter("myCounter", "help text", labelNames: new []{ "method", "endpoint"});
counter.WithLabels("GET", "/").Inc();
counter.WithLabels("POST", "/cancel").Inc();
```
Since v4 there is alternative new way to provide a labels via ValueTuple that allow to reduce memory allocation:
```c#
var counter = metricFactory.CreateCounter("myCounter", "help text", labelNames: ("method", "endpoint"));
counter.WithLabels(("GET", "/")).Inc();
counter.WithLabels(("POST", "/cancel")).Inc();
```
## Contribute
Contributions to the package are always welcome!
- Report any bugs or issues you find on the [issue tracker](https://github.com/prom-client-net/prom-client/issues).
- You can grab the source code at the package's [git repository](https://github.com/prom-client-net/prom-client).
## Supporters
[](https://github.com/jetbrains)
We much appreciate free licenses provided by [JetBrains](https://github.com/jetbrains) to support our library.
## License
All contents of this package are licensed under the [MIT license](https://opensource.org/licenses/MIT).