https://github.com/SebKrantz/collapse
Advanced and Fast Data Transformation in R
https://github.com/SebKrantz/collapse
cran data-aggregation data-analysis data-manipulation data-processing data-science data-transformation econometrics high-performance panel-data r rstats scientific-computing statistics time-series weighted weights
Last synced: about 1 year ago
JSON representation
Advanced and Fast Data Transformation in R
- Host: GitHub
- URL: https://github.com/SebKrantz/collapse
- Owner: SebKrantz
- License: other
- Created: 2019-02-27T12:21:05.000Z (over 7 years ago)
- Default Branch: master
- Last Pushed: 2024-05-22T11:22:46.000Z (about 2 years ago)
- Last Synced: 2024-05-22T15:55:48.394Z (about 2 years ago)
- Topics: cran, data-aggregation, data-analysis, data-manipulation, data-processing, data-science, data-transformation, econometrics, high-performance, panel-data, r, rstats, scientific-computing, statistics, time-series, weighted, weights
- Language: C
- Homepage: https://sebkrantz.github.io/collapse/
- Size: 99 MB
- Stars: 605
- Watchers: 10
- Forks: 29
- Open Issues: 9
-
Metadata Files:
- Readme: README.md
- License: LICENSE
- Citation: CITATION.cff
Awesome Lists containing this project
- StarryDivineSky - SebKrantz/collapse
- jimsghstars - SebKrantz/collapse - Advanced and Fast Data Transformation in R (C)
README
# collapse 
[](https://github.com/SebKrantz/collapse/actions/workflows/R-CMD-check.yaml)
[](https://fastverse.r-universe.dev/collapse)
[](https://cran.r-project.org/package=collapse)
[](https://cran.r-project.org/web/checks/check_results_collapse.html)


[](https://anaconda.org/conda-forge/r-collapse)
[](https://anaconda.org/conda-forge/r-collapse)
[](https://app.codecov.io/gh/SebKrantz/collapse?branch=master)
[](https://cran.r-project.org/)
[](https://CRAN.R-project.org/package=collapse)
[](https://zenodo.org/badge/latestdoi/172910283)
[](https://arxiv.org/abs/2403.05038)
*collapse* is a large C/C++-based package for data transformation and statistical computing in R. It aims to:
* Facilitate complex data transformation, exploration and computing tasks in R.
* Help make R code fast, flexible, parsimonious and programmer friendly.
Its novel [class-agnostic architecture](https://sebkrantz.github.io/collapse/articles/collapse_object_handling.html) supports all basic R objects and their popular extensions, including *units*, *integer64*, *xts*/*zoo*, *tibble*, *grouped_df*, *data.table*, *sf*, *pseries* and *pdata.frame*.
**Key Features:**
* **Advanced statistical programming**: A full set of fast statistical functions
supporting grouped and weighted computations on vectors, matrices and
data frames. Fast and programmable grouping, ordering, matching, deduplication,
factor generation and interactions.
* **Fast data manipulation**: Fast and flexible functions for data
manipulation, data object conversions and memory efficient R programming.
* **Advanced aggregation**: Fast and easy multi-type, weighted and parallelized data aggregation.
* **Advanced transformations**: Fast row/column arithmetic, (grouped) sweeping out of statistics (by reference),
(grouped, weighted) scaling and (higher-dimensional) centering and averaging.
* **Advanced time-computations**: Fast and flexible indexed time series and panel data classes, lags/leads,
differences and (compound) growth rates on (irregular) time series and panels, panel-autocorrelation functions and panel data to array conversions.
* **List processing**: Recursive list search, filtering, splitting, apply and unlisting to data frame.
* **Advanced data exploration**: Fast (grouped, weighted, multi-level) descriptive statistical tools.
*collapse* is written in C and C++, with algorithms much faster than base R's, has extremely low evaluation overheads, scales well (benchmarks: [linux](https://duckdblabs.github.io/db-benchmark/) | [windows](https://github.com/AdrianAntico/Benchmarks?tab=readme-ov-file#benmark-results)), and excels on complex statistical tasks.
## Installation
``` r
# Install the current version on CRAN
install.packages("collapse")
# Install a stable development version (Windows/Mac binaries) from R-universe
install.packages("collapse", repos = "https://fastverse.r-universe.dev")
# Install a stable development version from GitHub (requires compilation)
remotes::install_github("SebKrantz/collapse")
# Install previous versions from the CRAN Archive (requires compilation)
install.packages("https://cran.r-project.org/src/contrib/Archive/collapse/collapse_2.0.19.tar.gz",
repos = NULL, type = "source")
# Older stable versions: 1.9.6, 1.8.9, 1.7.6, 1.6.5, 1.5.3, 1.4.2, 1.3.2, 1.2.1
```
## Documentation
*collapse* installs with a built-in structured [documentation](), implemented via a set of separate help pages. Calling `help('collapse-documentation')` brings up the the top-level documentation page, providing an overview of the entire package and links to all other documentation pages.
In addition there are several [vignettes](), among them one on [Documentation and Resources](https://sebkrantz.github.io/collapse/articles/collapse_documentation.html).
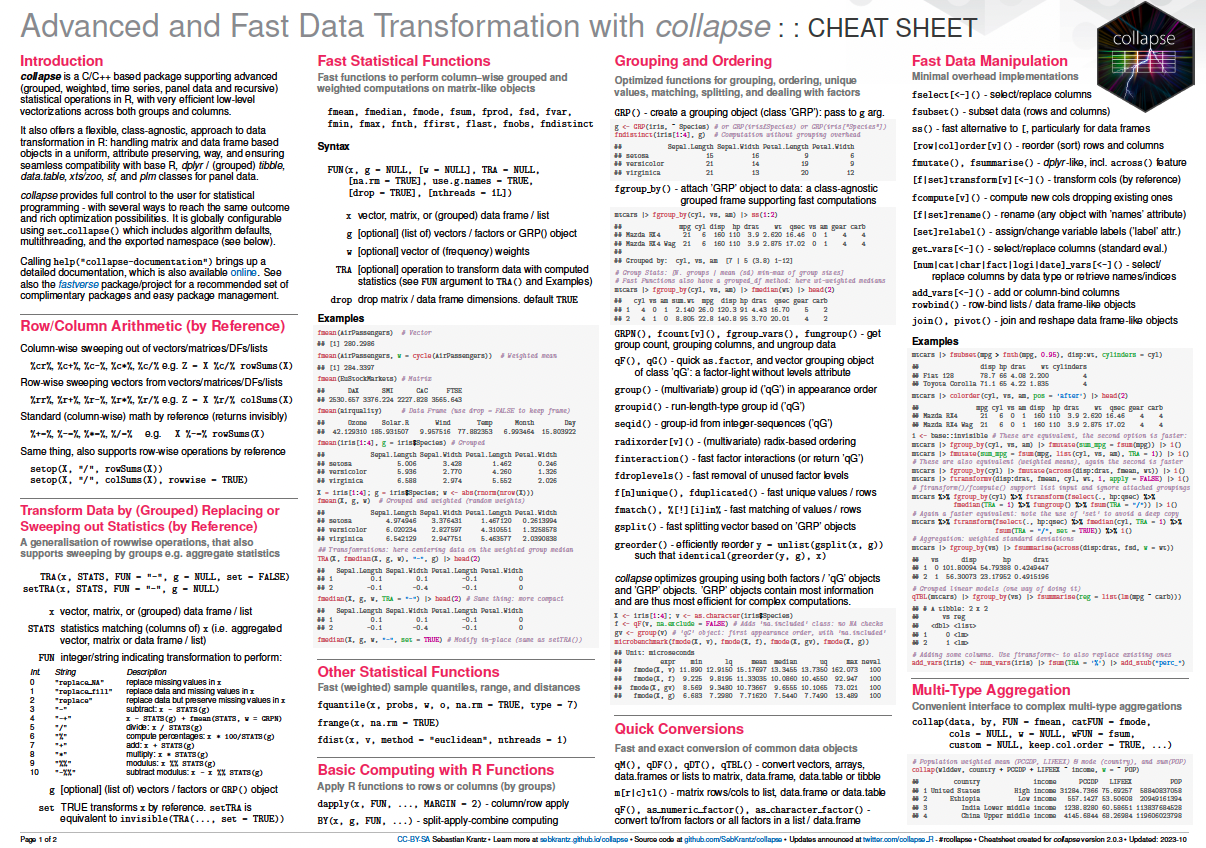
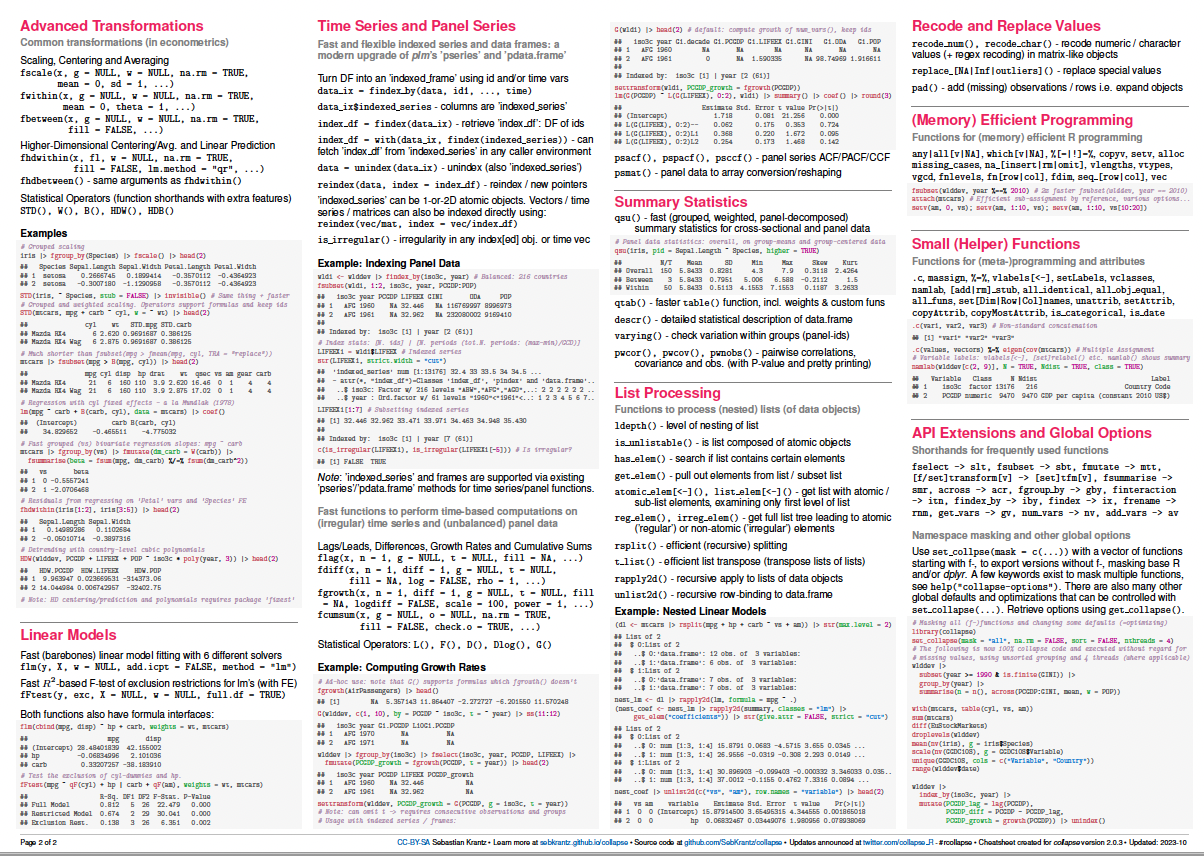
### Cheatsheet
### Article on arXiv
An [**article**](https://arxiv.org/abs/2403.05038) on *collapse* was submitted to the [Journal of Statistical Software](https://www.jstatsoft.org/) in March 2024 and updated/revised in February 2025.
### Presentation at [useR 2022](https://user2022.r-project.org)
[**Video Recording**]() |
[**Slides**]()
## Example Usage
This provides a simple set of examples introducing some important features of *collapse*. It should be easy to follow for readers familiar with R.
Click here to expand
``` r
library(collapse)
data("iris") # iris dataset in base R
v <- iris$Sepal.Length # Vector
d <- num_vars(iris) # Saving numeric variables (could also be a matrix, statistical functions are S3 generic)
g <- iris$Species # Grouping variable (could also be a list of variables)
## Advanced Statistical Programming -----------------------------------------------------------------------------
# Simple (column-wise) statistics...
fmedian(v) # Vector
fsd(qM(d)) # Matrix (qM is a faster as.matrix)
fmode(d) # data.frame
fmean(qM(d), drop = FALSE) # Still a matrix
fmax(d, drop = FALSE) # Still a data.frame
# Fast grouped and/or weighted statistics
w <- abs(rnorm(fnrow(iris)))
fmedian(d, w = w) # Simple weighted statistics
fnth(d, 0.75, g) # Grouped statistics (grouped third quartile)
fmedian(d, g, w) # Groupwise-weighted statistics
fsd(v, g, w) # Similarly for vectors
fmode(qM(d), g, w, ties = "max") # Or matrices (grouped and weighted maximum mode) ...
# A fast set of data manipulation functions allows complex piped programming at high speeds
library(magrittr) # Pipe operators
iris %>% fgroup_by(Species) %>% fndistinct # Grouped distinct value counts
iris %>% fgroup_by(Species) %>% fmedian(w) # Weighted group medians
iris %>% add_vars(w) %>% # Adding weight vector to dataset
fsubset(Sepal.Length < fmean(Sepal.Length), Species, Sepal.Width:w) %>% # Fast selecting and subsetting
fgroup_by(Species) %>% # Grouping (efficiently creates a grouped tibble)
fvar(w) %>% # Frequency-weighted group-variance, default (keep.w = TRUE)
roworder(sum.w) # also saves group weights in a column called 'sum.w'
# Can also use dplyr (but dplyr manipulation verbs are a lot slower)
library(dplyr)
iris %>% add_vars(w) %>%
filter(Sepal.Length < fmean(Sepal.Length)) %>%
select(Species, Sepal.Width:w) %>%
group_by(Species) %>%
fvar(w) %>% arrange(sum.w)
## Fast Data Manipulation ---------------------------------------------------------------------------------------
head(GGDC10S)
# Pivot Wider: Only SUM (total)
SUM <- GGDC10S |> pivot(c("Country", "Year"), "SUM", "Variable", how = "wider")
head(SUM)
# Joining with data from wlddev
wlddev |>
join(SUM, on = c("iso3c" = "Country", "year" = "Year"), how = "inner")
# Recast pivoting + supplying new labels for generated columns
pivot(GGDC10S, values = 6:16, names = list("Variable", "Sectorcode"),
labels = list(to = "Sector",
new = c(Sectorcode = "GGDC10S Sector Code",
Sector = "Long Sector Description",
VA = "Value Added",
EMP = "Employment")),
how = "recast", na.rm = TRUE)
## Advanced Aggregation -----------------------------------------------------------------------------------------
collap(iris, Sepal.Length + Sepal.Width ~ Species, fmean) # Simple aggregation using the mean..
collap(iris, ~ Species, list(fmean, fmedian, fmode)) # Multiple functions applied to each column
add_vars(iris) <- w # Adding weights, return in long format..
collap(iris, ~ Species, list(fmean, fmedian, fmode), w = ~ w, return = "long")
# Generate some additional logical data
settransform(iris, AWMSL = Sepal.Length > fmedian(Sepal.Length, w = w),
AWMSW = Sepal.Width > fmedian(Sepal.Width, w = w))
# Multi-type data aggregation: catFUN applies to all categorical columns (here AMWSW)
collap(iris, ~ Species + AWMSL, list(fmean, fmedian, fmode),
catFUN = fmode, w = ~ w, return = "long")
# Custom aggregation gives the greatest possible flexibility: directly mapping functions to columns
collap(iris, ~ Species + AWMSL,
custom = list(fmean = 2:3, fsd = 3:4, fmode = "AWMSL"), w = ~ w,
wFUN = list(fsum, fmin, fmax), # Here also aggregating the weight vector with 3 different functions
keep.col.order = FALSE) # Column order not maintained -> grouping and weight variables first
# Can also use grouped tibble: weighted median for numeric, weighted mode for categorical columns
iris %>% fgroup_by(Species, AWMSL) %>% collapg(fmedian, fmode, w = w)
## Advanced Transformations -------------------------------------------------------------------------------------
# All Fast Statistical Functions have a TRA argument, supporting 10 different replacing and sweeping operations
fmode(d, TRA = "replace") # Replacing values with the mode
fsd(v, TRA = "/") # dividing by the overall standard deviation (scaling)
fsum(d, TRA = "%") # Computing percentages
fsd(d, g, TRA = "/") # Grouped scaling
fmin(d, g, TRA = "-") # Setting the minimum value in each species to 0
ffirst(d, g, TRA = "%%") # Taking modulus of first value in each species
fmedian(d, g, w, "-") # Groupwise centering by the weighted median
fnth(d, 0.95, g, w, "%") # Expressing data in percentages of the weighted species-wise 95th percentile
fmode(d, g, w, "replace", # Replacing data by the species-wise weighted minimum-mode
ties = "min")
# TRA() can also be called directly to replace or sweep with a matching set of computed statistics
TRA(v, sd(v), "/") # Same as fsd(v, TRA = "/")
TRA(d, fmedian(d, g, w), "-", g) # Same as fmedian(d, g, w, "-")
TRA(d, BY(d, g, quantile, 0.95), "%", g) # Same as fnth(d, 0.95, g, TRA = "%") (apart from quantile algorithm)
# For common uses, there are some faster and more advanced functions
fbetween(d, g) # Grouped averaging [same as fmean(d, g, TRA = "replace") but faster]
fwithin(d, g) # Grouped centering [same as fmean(d, g, TRA = "-") but faster]
fwithin(d, g, w) # Grouped and weighted centering [same as fmean(d, g, w, "-")]
fwithin(d, g, w, theta = 0.76) # Quasi-centering i.e. d - theta*fbetween(d, g, w)
fwithin(d, g, w, mean = "overall.mean") # Preserving the overall weighted mean of the data
fscale(d) # Scaling and centering (default mean = 0, sd = 1)
fscale(d, mean = 5, sd = 3) # Custom scaling and centering
fscale(d, mean = FALSE, sd = 3) # Mean preserving scaling
fscale(d, g, w) # Grouped and weighted scaling and centering
fscale(d, g, w, mean = "overall.mean", # Setting group means to overall weighted mean,
sd = "within.sd") # and group sd's to fsd(fwithin(d, g, w), w = w)
get_vars(iris, 1:2) # Use get_vars for fast selecting data.frame columns, gv is shortcut
fhdbetween(gv(iris, 1:2), gv(iris, 3:5)) # Linear prediction with factors and continuous covariates
fhdwithin(gv(iris, 1:2), gv(iris, 3:5)) # Linear partialling out factors and continuous covariates
# This again opens up new possibilities for data manipulation...
iris %>%
ftransform(ASWMSL = Sepal.Length > fmedian(Sepal.Length, Species, w, "replace")) %>%
fgroup_by(ASWMSL) %>% collapg(w = w, keep.col.order = FALSE)
iris %>% fgroup_by(Species) %>% num_vars %>% fwithin(w) # Weighted demeaning
## Time Series and Panel Series ---------------------------------------------------------------------------------
flag(AirPassengers, -1:3) # A sequence of lags and leads
EuStockMarkets %>% # A sequence of first and second seasonal differences
fdiff(0:1 * frequency(.), 1:2)
fdiff(EuStockMarkets, rho = 0.95) # Quasi-difference [x - rho*flag(x)]
fdiff(EuStockMarkets, log = TRUE) # Log-difference [log(x/flag(x))]
EuStockMarkets %>% fgrowth(c(1, frequency(.))) # Ordinary and seasonal growth rate
EuStockMarkets %>% fgrowth(logdiff = TRUE) # Log-difference growth rate [log(x/flag(x))*100]
# Creating panel data
pdata <- EuStockMarkets %>% list(`A` = ., `B` = .) %>%
unlist2d(idcols = "Id", row.names = "Time")
L(pdata, -1:3, ~Id, ~Time) # Sequence of fully identified panel-lags (L is operator for flag)
pdata %>% fgroup_by(Id) %>% flag(-1:3, Time) # Same thing..
# collapse also supports indexed series and data frames (and plm panel data classes)
pdata <- findex_by(pdata, Id, Time)
L(pdata, -1:3) # Same as above, ...
psacf(pdata) # Multivariate panel-ACF
psmat(pdata) %>% plot # 3D-array of time series from panel data + plotting
HDW(pdata) # This projects out id and time fixed effects.. (HDW is operator for fhdwithin)
W(pdata, effect = "Id") # Only Id effects.. (W is operator for fwithin)
## List Processing ----------------------------------------------------------------------------------------------
# Some nested list of heterogenous data objects..
l <- list(a = qM(mtcars[1:8]), # Matrix
b = list(c = mtcars[4:11], # data.frame
d = list(e = mtcars[2:10],
f = fsd(mtcars)))) # Vector
ldepth(l) # List has 4 levels of nesting (considering that mtcars is a data.frame)
is_unlistable(l) # Can be unlisted
has_elem(l, "f") # Contains an element by the name of "f"
has_elem(l, is.matrix) # Contains a matrix
get_elem(l, "f") # Recursive extraction of elements..
get_elem(l, c("c","f"))
get_elem(l, c("c","f"), keep.tree = TRUE)
unlist2d(l, row.names = TRUE) # Intelligent recursive row-binding to data.frame
rapply2d(l, fmean) %>% unlist2d # Taking the mean of all elements and repeating
# Application: extracting and tidying results from (potentially nested) lists of model objects
list(mod1 = lm(mpg ~ carb, mtcars),
mod2 = lm(mpg ~ carb + hp, mtcars)) %>%
lapply(summary) %>%
get_elem("coef", regex = TRUE) %>% # Regular expression search and extraction
unlist2d(idcols = "Model", row.names = "Predictor")
## Summary Statistics -------------------------------------------------------------------------------------------
irisNA <- na_insert(iris, prop = 0.15) # Randmonly set 15% missing
fnobs(irisNA) # Observation count
pwnobs(irisNA) # Pairwise observation count
fnobs(irisNA, g) # Grouped observation count
fndistinct(irisNA) # Same with distinct values... (default na.rm = TRUE skips NA's)
fndistinct(irisNA, g)
descr(iris) # Detailed statistical description of data
varying(iris, ~ Species) # Show which variables vary within Species
varying(pdata) # Which are time-varying ?
qsu(iris, w = ~ w) # Fast (one-pass) summary (with weights)
qsu(iris, ~ Species, w = ~ w, higher = TRUE) # Grouped summary + higher moments
qsu(pdata, higher = TRUE) # Panel-data summary (between and within entities)
pwcor(num_vars(irisNA), N = TRUE, P = TRUE) # Pairwise correlations with p-value and observations
pwcor(W(pdata, keep.ids = FALSE), P = TRUE) # Within-correlations
```
Evaluated and more extensive sets of examples are provided on the [package page]() (also accessible from R by calling `example('collapse-package')`), and further in the [vignettes]() and [documentation]().
## Citation
If *collapse* was instrumental for your research project, please consider citing it using `citation("collapse")`.