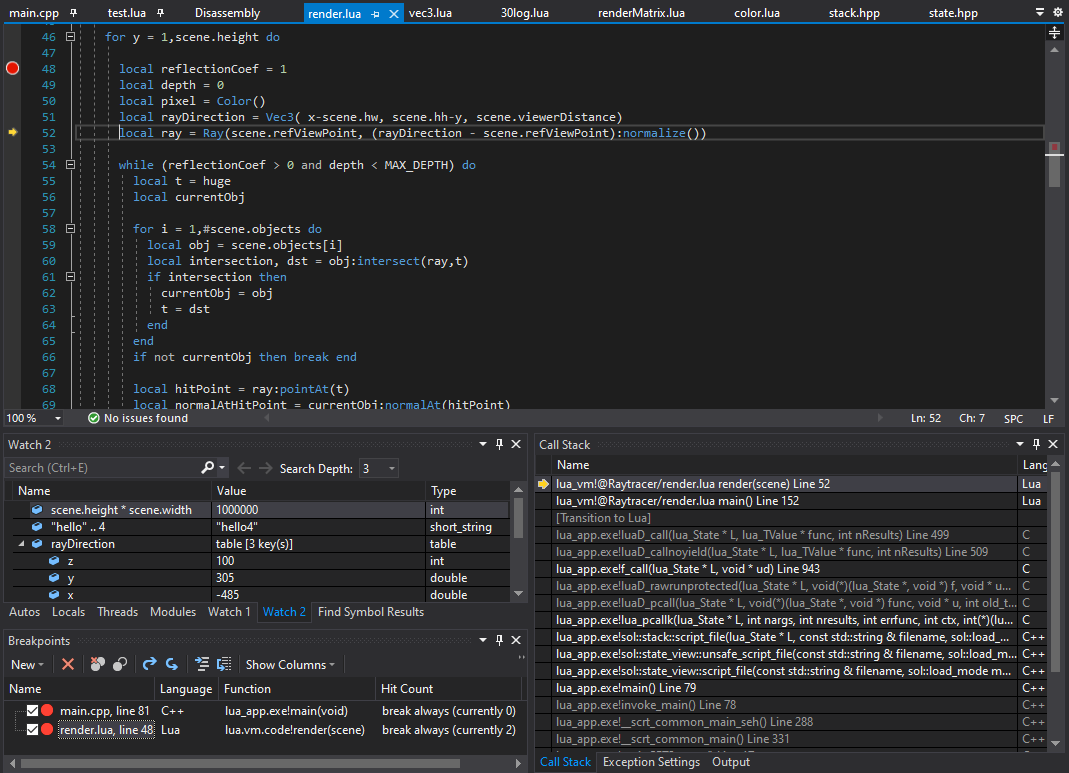
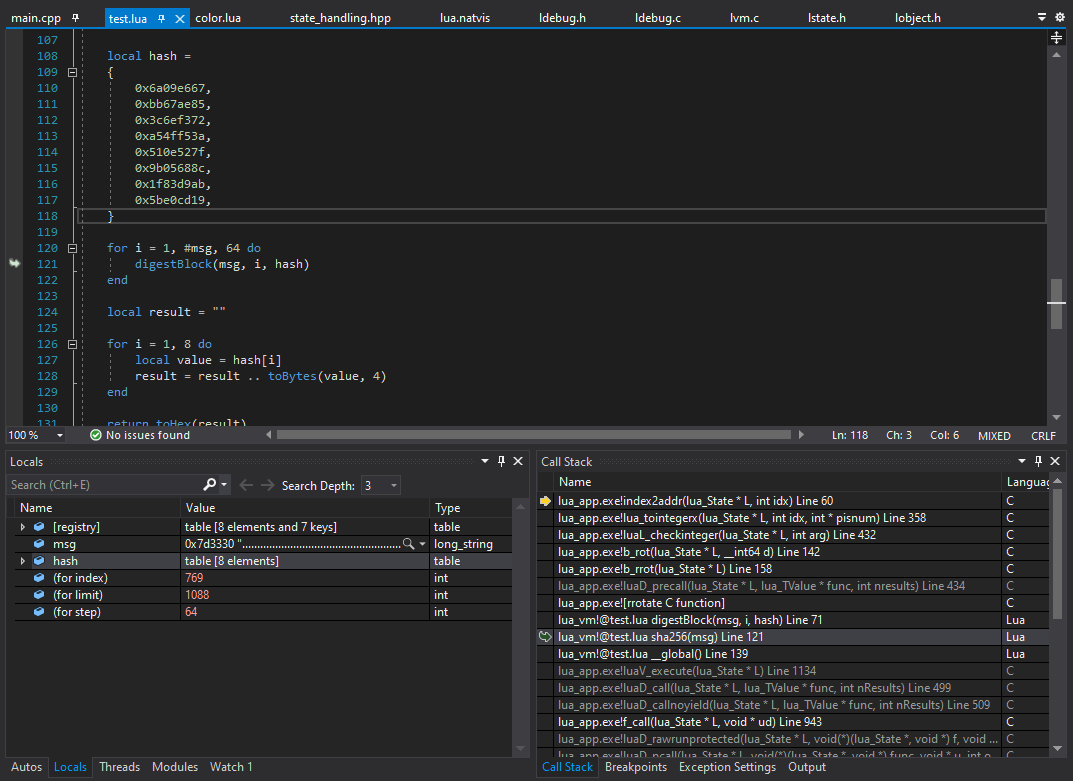
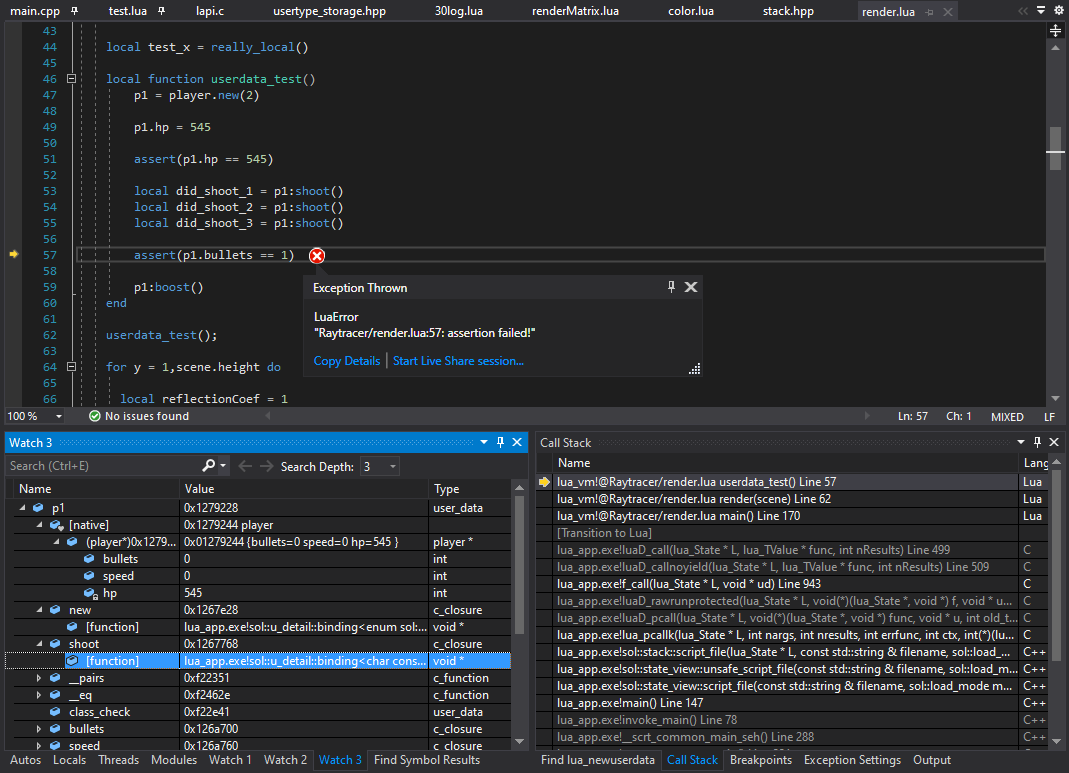
https://github.com/WheretIB/LuaDkmDebugger
Visual Studio C++ debugger extensions for Lua
https://github.com/WheretIB/LuaDkmDebugger
debugger lua visual-studio-extension
Last synced: about 1 year ago
JSON representation
Visual Studio C++ debugger extensions for Lua
- Host: GitHub
- URL: https://github.com/WheretIB/LuaDkmDebugger
- Owner: WheretIB
- License: mit
- Created: 2020-05-20T18:50:54.000Z (almost 6 years ago)
- Default Branch: master
- Last Pushed: 2023-08-29T22:00:30.000Z (over 2 years ago)
- Last Synced: 2024-11-05T19:43:12.281Z (over 1 year ago)
- Topics: debugger, lua, visual-studio-extension
- Language: C#
- Size: 1.3 MB
- Stars: 83
- Watchers: 9
- Forks: 32
- Open Issues: 11
-
Metadata Files:
- Readme: README.md
- Changelog: CHANGELOG.md
- License: LICENSE
Awesome Lists containing this project
README
# C++ Debugger Extensions for Lua
---
This Visual Studio extension enables debugging of Lua scripts running inside C++ applications with Lua library.
Supported Lua versions:
* Lua 5.4
* Lua 5.3
* Lua 5.2 with LUA_NANTRICK (default configuration)
* Lua 5.1
* LuaJIT 2.0.5
* LuaJIT 2.1.0
[Extension on Visual Studio Marketplace](https://marketplace.visualstudio.com/items?itemName=wheretib.lua-dkm-debug)
## Features:
* Lua call stack frames in the Call Stack window
* Lua library call stack frames are marked as non-user code
* Jump to Lua source/line from Lua call stack frames
* Function arguments, local variables and upvalues are displayed in the 'Locals' window
* Lua expression evaluation in Watch, Immediate and similar elements
* Numeric, string and user data values can be modified
* Breakpoints
* Up to 256 breakpoints are supported
* Step Over, Step Into and Step Out
* Conditional breakpoints (not supported in LuaJIT)
* Quick Info tooltip display with variable value evaluation on mouse over in the code window
* External C function/closure pointer display with 'Go To Source' provided by Visual Studio
* Assertion failure, 'error' call and runtime errors are displayed as unhandled exceptions ('Break on Error' option)
* Location display and Jump to Source context menu option for Lua function values
* When Lua library is used together with sol library, C++ object in user data is available


## Requirements
This extension relies on debug information for the Lua library itself. This means that debug information has to be provided for the Lua source files. This is different from other Lua debuggers that use the built-in `debug.` package.
When using pre-compiled Lua libraries (static .lib or a .dll) a .pdb file has to be available as well. You can build Lua or LuaJIT with debug information with or without optimizations.
If Lua source files are included in the project in your solution, debug information should be available by default. If not, you can enable it in the project settings even if building in Release configuration (without affecting performance).
## Additional configuration
In the default configuration, debugger searches for script files in current working directory and application executable directory.
Application may provide Lua with script file paths that do not match the file system. To help the debugger find your script files in this scenario, additional script search paths can be provided using an optional configuration file.
`lua_dkm_debug.json` file can be placed in application working directory or near the executable file.
Add `ScriptPaths` key with an array of additional search paths.
```
{
"ScriptPaths": [
"../",
"../scripts/base/"
]
}
```
## Troubleshooting
If you experience issues with the extension, you can enable debug logs in 'Extensions -> Lua Debugger' menu if you wish to provide additional info in your report.
### Breakpoints and Stepping information
As in other Lua debuggers, breakpoints are implemented using Lua library hooks. The hooks are set when breakpoints are active or if stepping through Lua code was performed.
This debugger or other debuggers might override each other hooks, so if breakpoints are not hit, this might be the reason.
If you experience issues with the debugger on launch, you can disable attachment to your process in 'Extensions -> Lua Debugger' menu. Debug logs can be enabled there as well if you wish to report the issue. (note that names of your Lua scripts might be included in the log). If debugger attachment is disabled, all features except for breakpoints and stepping will still work.
## Compatibility Mode
If you use Lua 5.2 without LUA_NANTRICK or if you have your own modifications in Lua library and you are experiencing issues with this extension, you can enable 'Compatibility Mode' from the extension menu options.
With this options, the debugger will load Lua data using symbolic field offsets instead of constant byte offsets expected for a specific version of Lua library.
## Known Issues:
* This extension will always add Lua module to the application (can be seen in 'Modules' section of the debugger) even when debugging applications with no Lua code
* Step Into from Lua into C++ doesn't work at the moment