https://github.com/XanderHorn/autoEDA
Automated exploratory data analysis
https://github.com/XanderHorn/autoEDA
Last synced: 4 months ago
JSON representation
Automated exploratory data analysis
- Host: GitHub
- URL: https://github.com/XanderHorn/autoEDA
- Owner: XanderHorn
- License: mit
- Created: 2018-04-03T11:00:21.000Z (over 7 years ago)
- Default Branch: master
- Last Pushed: 2019-06-19T08:10:46.000Z (over 6 years ago)
- Last Synced: 2024-08-13T07:15:34.568Z (over 1 year ago)
- Language: R
- Size: 48.8 KB
- Stars: 80
- Watchers: 9
- Forks: 18
- Open Issues: 1
-
Metadata Files:
- Readme: README.md
- License: LICENSE
Awesome Lists containing this project
- jimsghstars - XanderHorn/autoEDA - Automated exploratory data analysis (R)
README
# autoEDA - Automated exploratory data analysis
## Introduction
`autoEDA` aims to automate exploratory data analysis in a univariate or bivariate manner. It has the ability to output plots created with the `ggplot2` library and themes inspired by `RColorBrewer`. The main ability involves seemlessly cleaning and pre-processing your data inorder for plots to display adequately.
## Installation
`install.packages('devtools')`
`library(devtools)`
`devtools::install_github("XanderHorn/autoEDA")`
`library(autoEDA)`
## Use
Please refer to the help files for each function.
## Examples
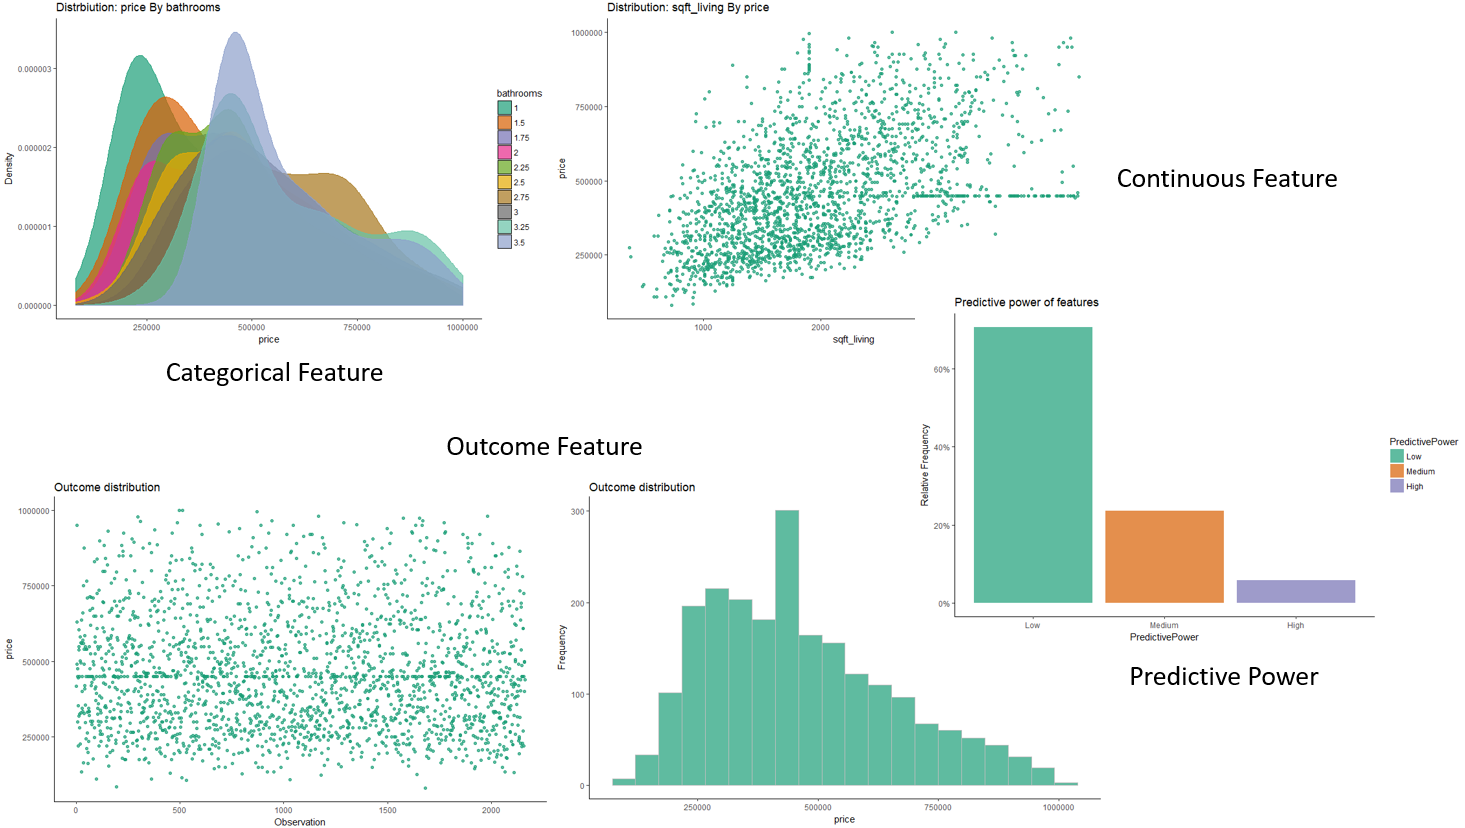
Below are some examples of plots produced.
### Continuous outcome (Regression problems)
Example plots for a regression problem.

### Categorical outcome (Classification problems)
Example plots for a classification problem.

### Univariate analysis

### Plot types
Categorical plot types:

Continuous plot types:

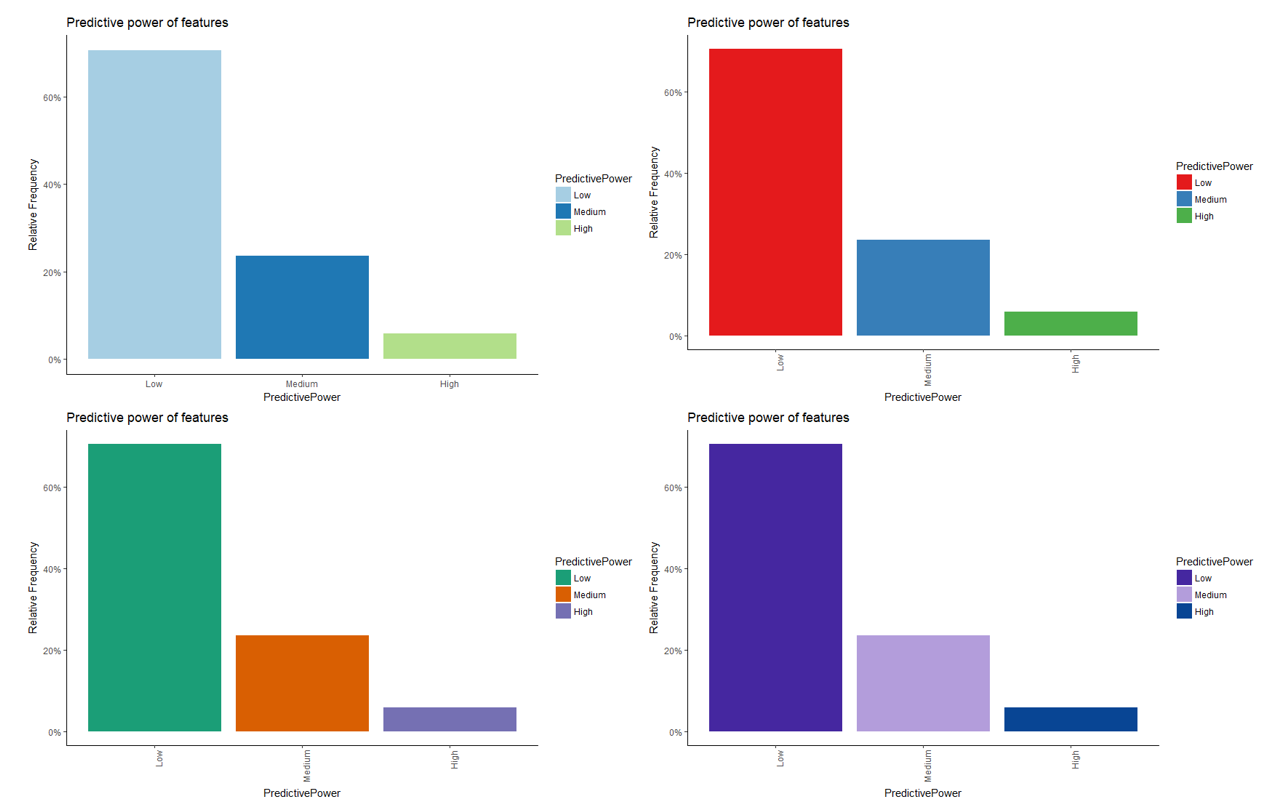
### Themes
Available color themes.
