https://github.com/abednarz210/State_of_Survival-
Team project to perform ETL on Kaggle dataset to analyze and predict life expectancy by state and present findings.
https://github.com/abednarz210/State_of_Survival-
etl google-slides python-3
Last synced: 9 months ago
JSON representation
Team project to perform ETL on Kaggle dataset to analyze and predict life expectancy by state and present findings.
- Host: GitHub
- URL: https://github.com/abednarz210/State_of_Survival-
- Owner: abednarz210
- Created: 2021-11-24T01:43:49.000Z (about 4 years ago)
- Default Branch: main
- Last Pushed: 2021-12-23T00:28:19.000Z (almost 4 years ago)
- Last Synced: 2024-03-19T05:50:52.667Z (over 1 year ago)
- Topics: etl, google-slides, python-3
- Language: Jupyter Notebook
- Homepage:
- Size: 1.83 MB
- Stars: 0
- Watchers: 1
- Forks: 0
- Open Issues: 0
-
Metadata Files:
- Readme: README.md
Awesome Lists containing this project
README
**State of Survival**

*Can Where You Live Determine Your Life Expecatancy?*
**Data for Analysis**
* Life Expectancy
* Physical Activity
* Obesity
**Questions**
* What are factors that can impact your longevity?
* Will exercise bring a change in your lifespan?
* Are there variations in life expectancy by Region? Gender?
* Were there any noticeable increases clustered in an area?
* Did any region experience a decrease of life expectancy?
**Data Clean Up**
* Examined data from 2001 -2011 for physical activity and obesity rates, as well as life expectancy from 1985-2010.
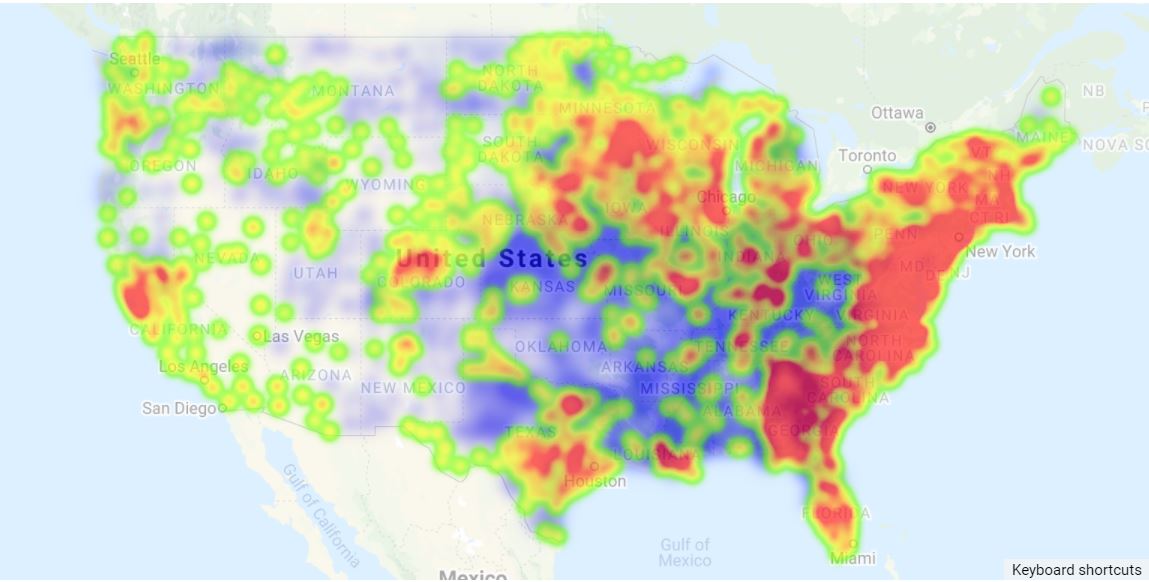
* Sorted states by averages per counties to examine trends for changes in life expectancy to create heat map.
* Graphics created by regions, state, counties, and gender.
**Overall US Life Expectancy**
* Both genders life expectancy increased
* Increase in males by 5.2 years, females had an increase of 3 years.
**Physical Activity and Obesity Prevalence Average in the US**
Due to the similar rates of increase in obesity prevalence and physical activity prevalence among the regions, the linear regression indicates there is no strong
correlation between the two data points.
**Conclusion/ Findings**
* Moving from the southwest to the northeast could add almost 2 years to your life.
* While both life expectancy and physical activity increased, obesity also increased nationwide.
* Don’t move to Oklahoma.
**Data Limitations**
* Life Expectancy data was from 1985- 2010
* Physical and Obesity 2001- 2011
* Modern Medicine most likely contributed to higher life expectancy
**Sources**
(http://www.healthdata.org/)
(https://simplemaps.com/data/us-counties)
**Final Presentation**
(https://docs.google.com/presentation/d/1QjBsSOIbkLeH1M9UeD2AW_zI5XcNzgZ_HP-N9yrk7sI/edit?usp=sharing)
Contributing Group Memebers: Amy Bednarz, Taylor Lyons, Matthew Villarreal, and Dillon Carter