https://github.com/abhy-kumar/ahmedabad-weather-projection
This notebook tries to predict Ahmedabad's weather using historical trends
https://github.com/abhy-kumar/ahmedabad-weather-projection
arima-forecasting numpy pandas python
Last synced: about 2 months ago
JSON representation
This notebook tries to predict Ahmedabad's weather using historical trends
- Host: GitHub
- URL: https://github.com/abhy-kumar/ahmedabad-weather-projection
- Owner: abhy-kumar
- License: mit
- Created: 2024-11-14T11:51:55.000Z (6 months ago)
- Default Branch: main
- Last Pushed: 2024-11-16T06:44:25.000Z (6 months ago)
- Last Synced: 2025-02-08T14:12:17.150Z (3 months ago)
- Topics: arima-forecasting, numpy, pandas, python
- Language: Jupyter Notebook
- Homepage: https://abhy-kumar.github.io/ahmedabad-weather-projection/
- Size: 10.1 MB
- Stars: 1
- Watchers: 1
- Forks: 0
- Open Issues: 0
-
Metadata Files:
- Readme: README.md
- License: LICENSE
Awesome Lists containing this project
README
# Ahmedabad-Weather-Projection
This notebook tries to predict Ahmedabad's weather using historical trends
## Features
- **Data Loading & Preprocessing**: Efficiently handles CSV data, cleans invalid entries, and prepares it for analysis.
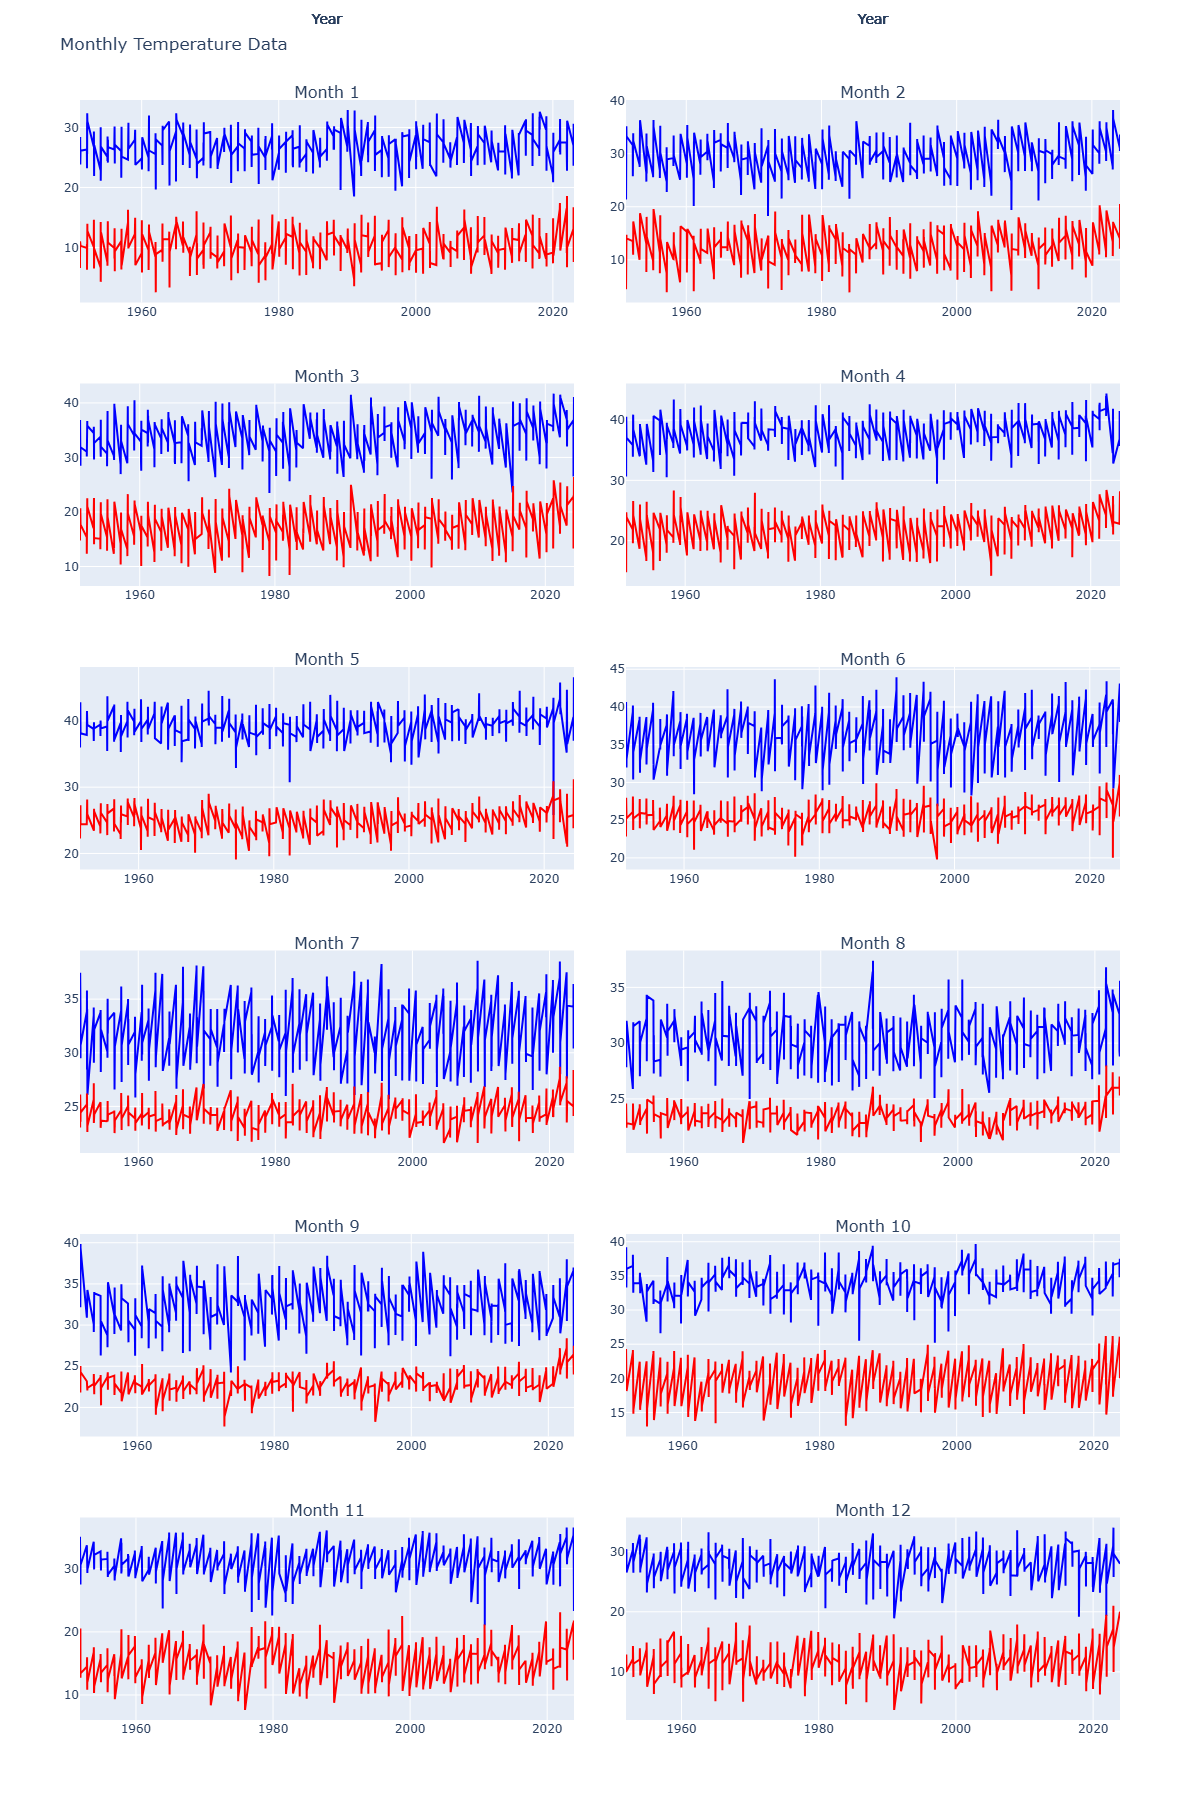
- **Monthly Temperature Plots**: Visualize maximum and minimum temperatures for each month using interactive Plotly plots.
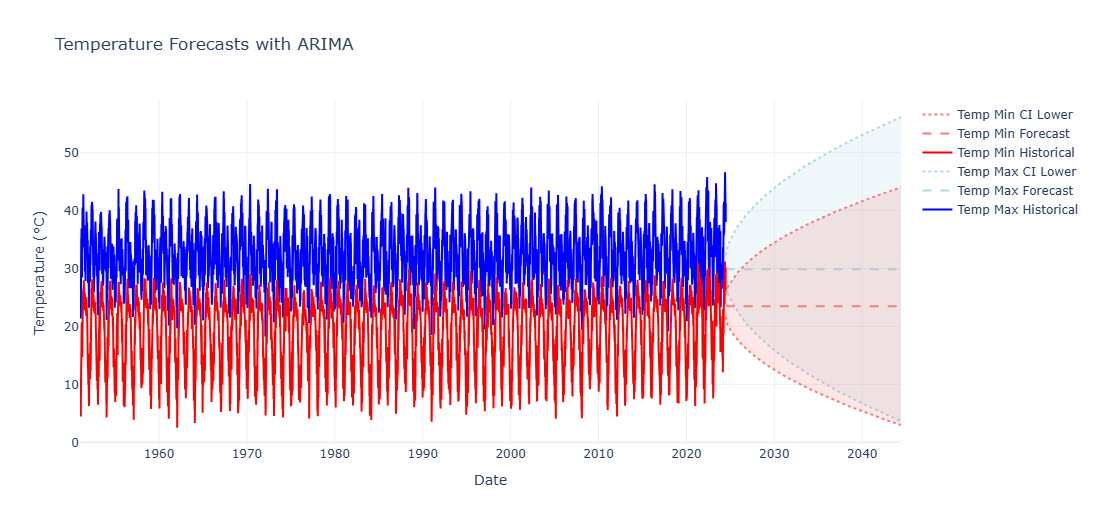
- **ARIMA Forecasting**: Predict future temperatures with ARIMA models, including confidence intervals.
- **Additional Visualizations**:
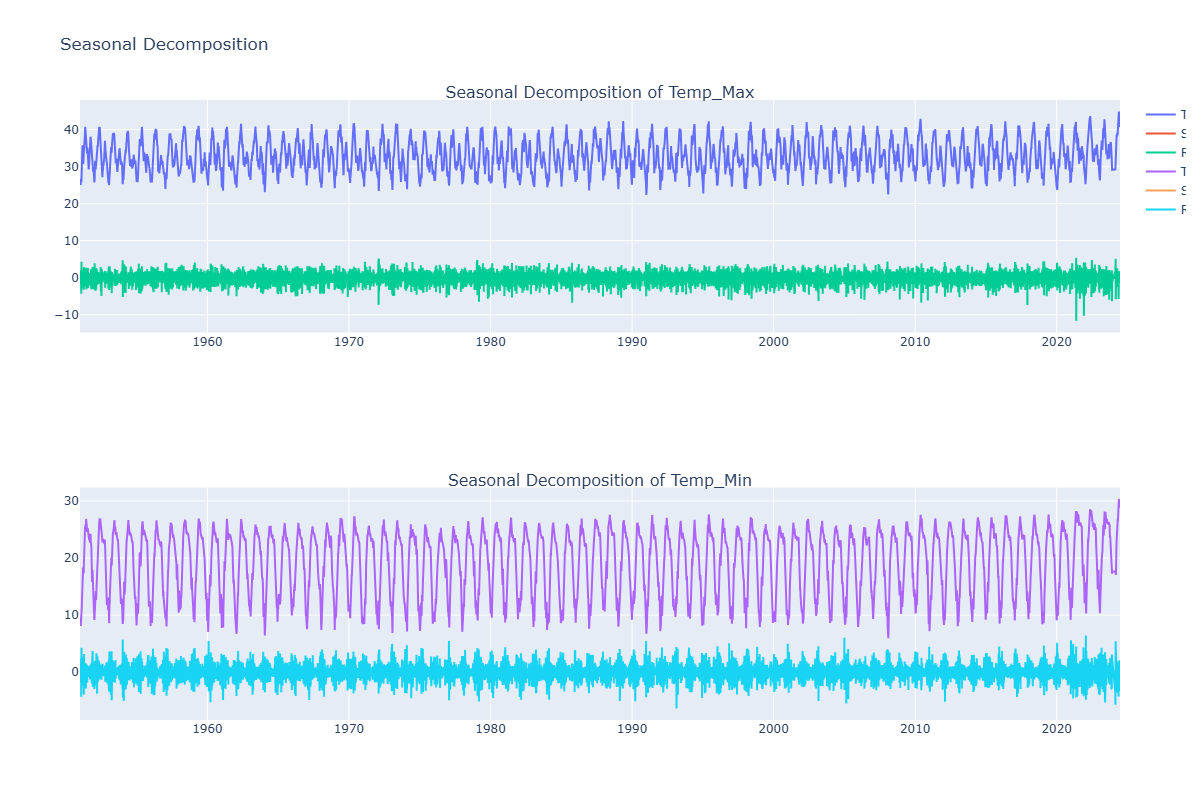
- Seasonal decomposition of temperature data.
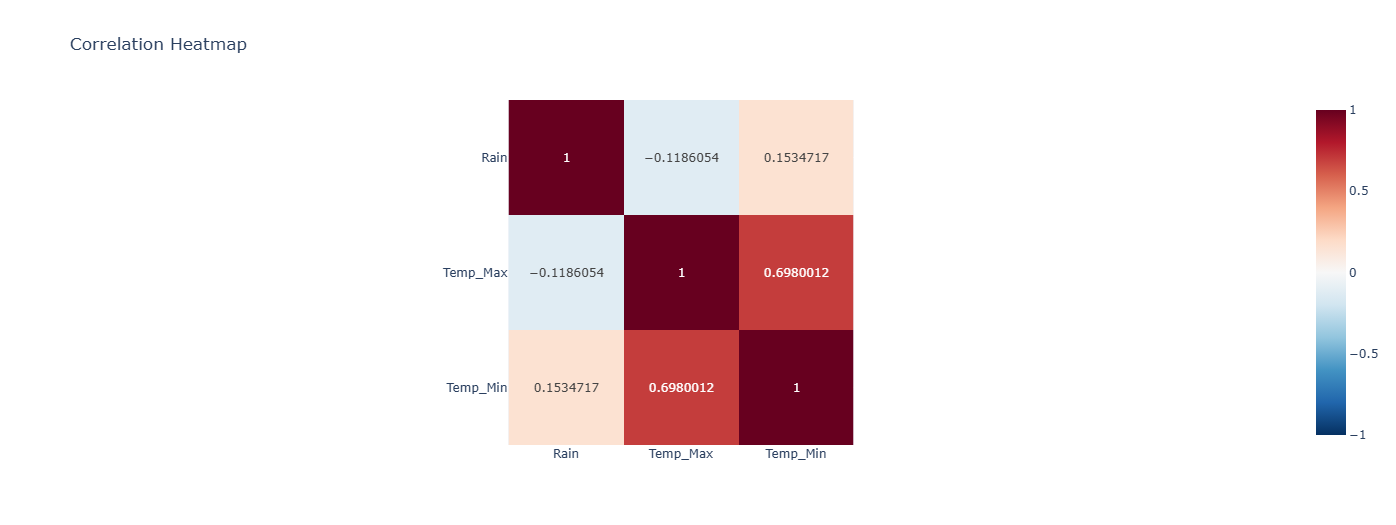
- Correlation heatmaps to explore relationships between variables.
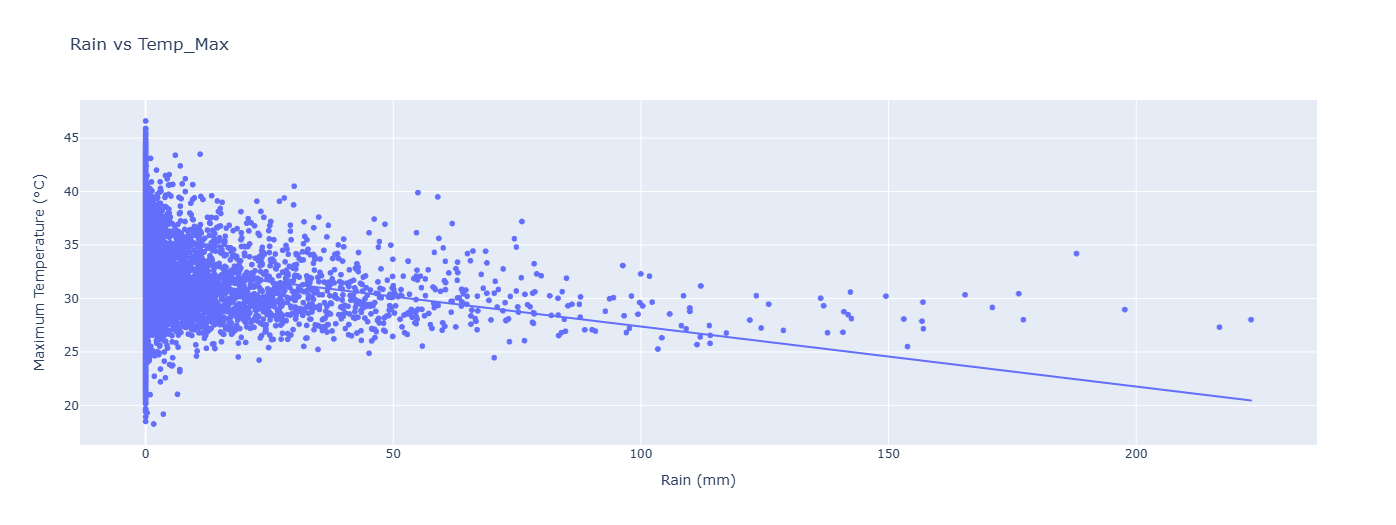
- Scatter plots showcasing the relationship between rainfall and temperatures.
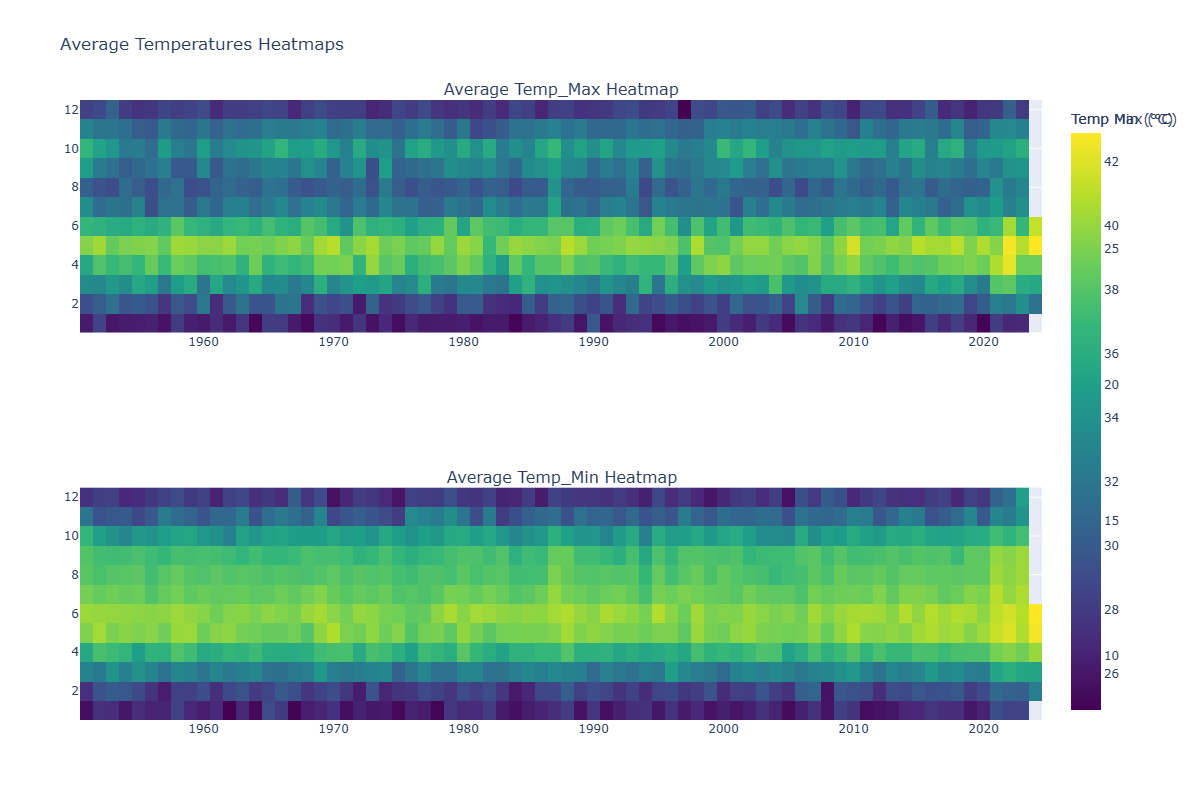
- Heatmaps displaying average temperatures by month and year.
- **Interactive Dashboard (Optional)**: Structure provided for building a Plotly Dash dashboard to interact with the data in real-time.
## Visualizations
Here's an overview of the visualizations you can generate with this script:
- Monthly Temperature Data:
- Temperature Forecasts with ARIMA:
- Seasonal Decomposition:
- Correlation Heatmap:
- Rain vs Temperature Scatter Plots:
- Average Temperature Heatmap: