https://github.com/abidhasanrafi/edge-computing-anomaly-detection
This repository is part of an ongoing research initiative.
https://github.com/abidhasanrafi/edge-computing-anomaly-detection
anomaly-detection edge-computing esp32 express-js mongodb mongoose tailwind-css wokwi
Last synced: 3 months ago
JSON representation
This repository is part of an ongoing research initiative.
- Host: GitHub
- URL: https://github.com/abidhasanrafi/edge-computing-anomaly-detection
- Owner: AbidHasanRafi
- Created: 2025-01-02T19:00:35.000Z (over 1 year ago)
- Default Branch: main
- Last Pushed: 2025-01-02T20:03:04.000Z (over 1 year ago)
- Last Synced: 2025-02-25T20:43:53.698Z (over 1 year ago)
- Topics: anomaly-detection, edge-computing, esp32, express-js, mongodb, mongoose, tailwind-css, wokwi
- Language: C++
- Homepage: https://anomaly-detection-server.vercel.app
- Size: 287 KB
- Stars: 0
- Watchers: 1
- Forks: 0
- Open Issues: 0
-
Metadata Files:
- Readme: README.md
Awesome Lists containing this project
README
# Test Framework for Edge Computing and Anomaly Detection
This repository contains two main components:
1. **Anomaly Detection Server**: An Express.js server for testing POST requests and handling anomaly data.
2. **ESP32 Anomaly Detection Server**: An ESP32 microcontroller project that simulates sending anomaly detection data to the server.
## Directory Structure
```
AbidHasanRafi-edge-computing-anomaly-detection/
├── README.md
├── anomaly-detection-server/
│ ├── package-lock.json
│ ├── package.json
│ ├── api/
│ │ ├── data.js
│ │ └── index.js
│ └── public/
│ └── index.html
├── assets/
│ └── anomaly-detected.png
└── esp32-anomaly-detection-server/
├── diagram.json
├── libraries.txt
├── sketch.ino
└── wokwi-project.txt
```
---
## 1. Anomaly Detection Server
The `anomaly-detection-server` is an Express.js application designed to simulate a server capable of receiving and handling POST requests with anomaly detection data.
### Directory Structure
```
anomaly-detection-server/
├── api/
│ ├── data.js # (Optional) Handles database interaction
│ └── index.js # Main server logic
└── public/
└── index.html # Frontend interface for displaying anomalies
```
### Features
- Accepts and stores anomaly data using a RESTful API.
- Fetches and displays real-time data on the frontend.
- Easy to deploy and test.
### Installation and Usage
1. **Navigate to the directory:**
```bash
cd anomaly-detection-server
```
2. **Install dependencies:**
```bash
npm install
```
3. **Set up environment variables:**
Create a `.env` file in the `anomaly-detection-server` directory with the following keys:
```env
DB_USER=
DB_PASSWORD=
CLUSTER_URL=
DB_NAME=
APP_NAME=
PORT=3000
```
4. **Run the server:**
```bash
node api/index.js
```
5. **Access the application:**
Open your browser and navigate to `http://localhost:3000`.
### Server User Interface
The figure below shows the server's user interface, which displays the data received from the ESP-32. It includes anomaly information and power readings, providing a clear overview of the system's current status.
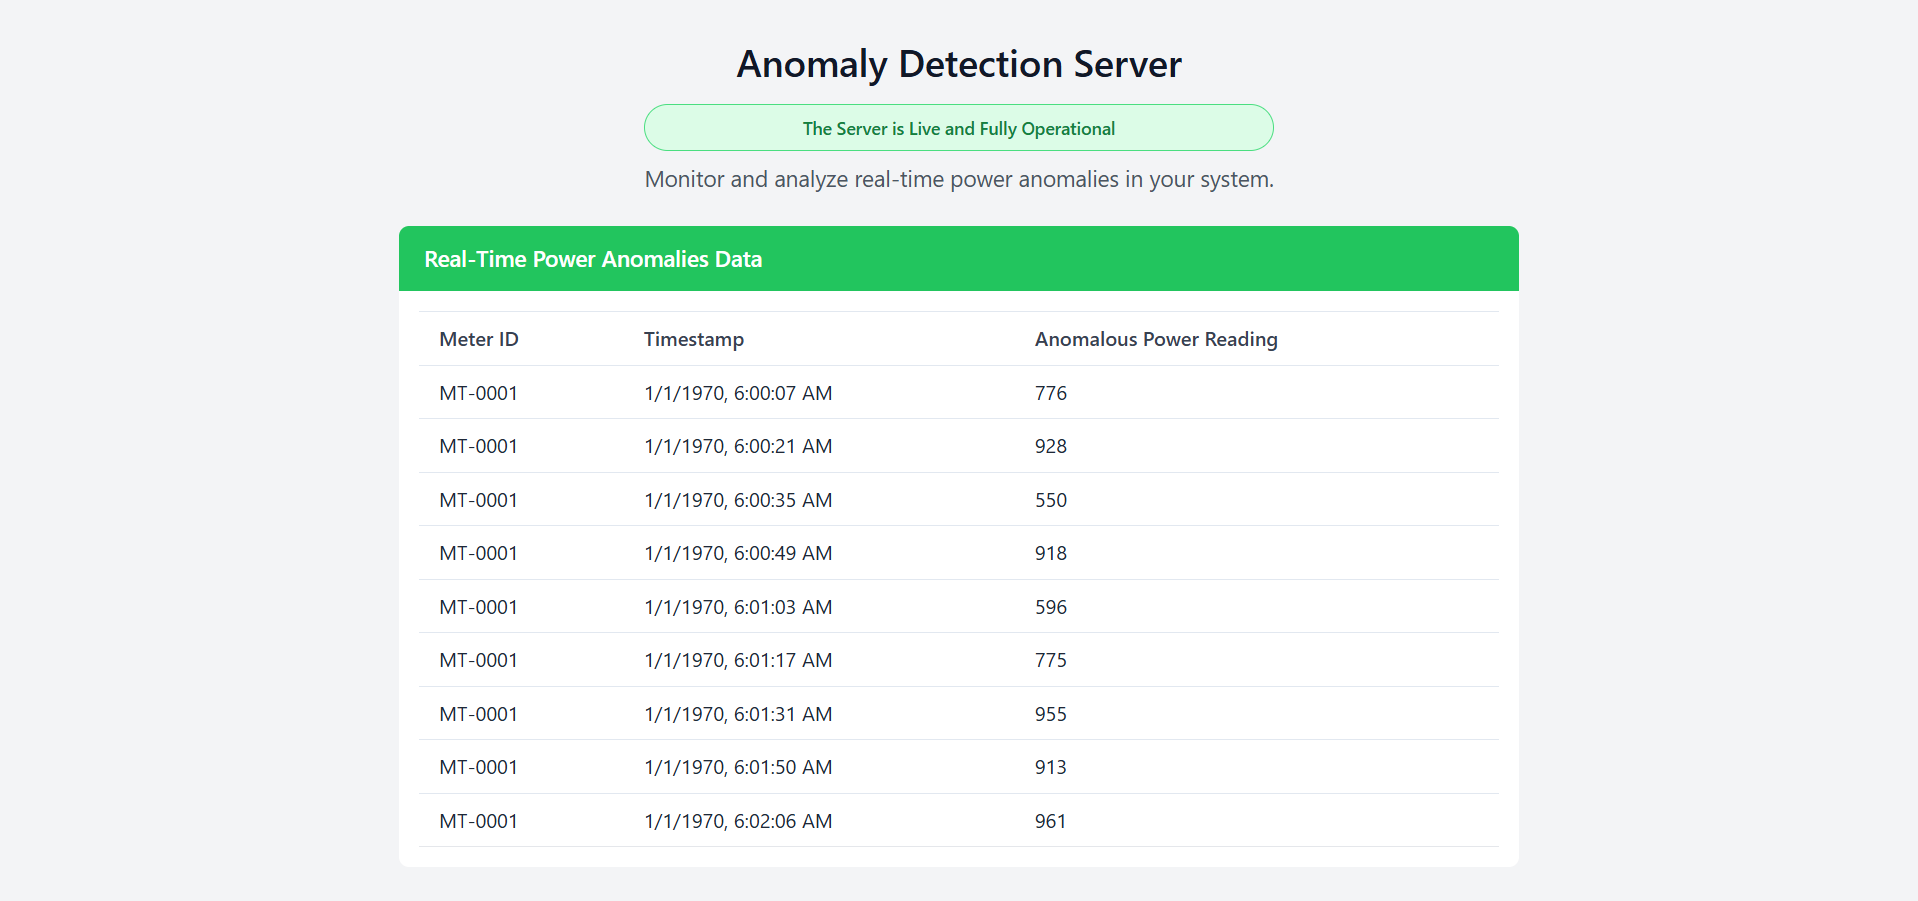
_Figure: The server UI displaying data received from the ESP-32._
### API Endpoints
#### `POST /api/data`
- **Description:** Saves anomaly data to the database.
- **Request Body:**
```json
{
"meterId": "string",
"time": "Date",
"anomalousPowerReading": "number"
}
```
#### `GET /api/data`
- **Description:** Fetches all saved anomaly data.
- **Response Example:**
```json
[
{
"_id": "string",
"meterId": "string",
"time": "Date",
"anomalousPowerReading": "number"
}
]
```
---
## 2. ESP32 Anomaly Detection Server
The `esp32-anomaly-detection-server` is an Arduino-based project designed to simulate anomaly data transmission from an ESP32 microcontroller.
### Directory Structure
```
esp32-anomaly-detection-server/
├── diagram.json # Circuit diagram (Wokwi format)
├── libraries.txt # Required libraries for the ESP32 project
├── sketch.ino # Main Arduino code for the ESP32
└── wokwi-project.txt # Wokwi project link
```
### Features
- Simulates anomaly detection by generating and sending data to the server.
- Provides a practical demonstration of IoT and edge computing concepts.
### View or Run the Project
- **View the Wokwi Project:** [ESP32 Anomaly Detection Server on Wokwi](https://wokwi.com/projects/418995936898646017)
- **Run on Wokwi:** [Wokwi Simulator](https://wokwi.com)
### Installation and Usage
1. **Upload the Sketch:**
- Open `sketch.ino` in the Arduino IDE.
- Install required libraries listed in `libraries.txt`.
- Connect your ESP32 and upload the code.
2. **Circuit Setup:**
- Use the `diagram.json` to set up your circuit in Wokwi or on a physical breadboard.
3. **Simulate Data:**
- The ESP32 will send POST requests with anomaly data to the server.
Here’s the updated README text with a detailed explanation of which light is lit based on the status shown in the figures:
---
### ESP-32 Circuit Simulation
The figure below shows the circuit simulation when the ESP-32 detects normal power readings. The green LED is lit to indicate normal operation, signaling that no anomalies are currently detected.
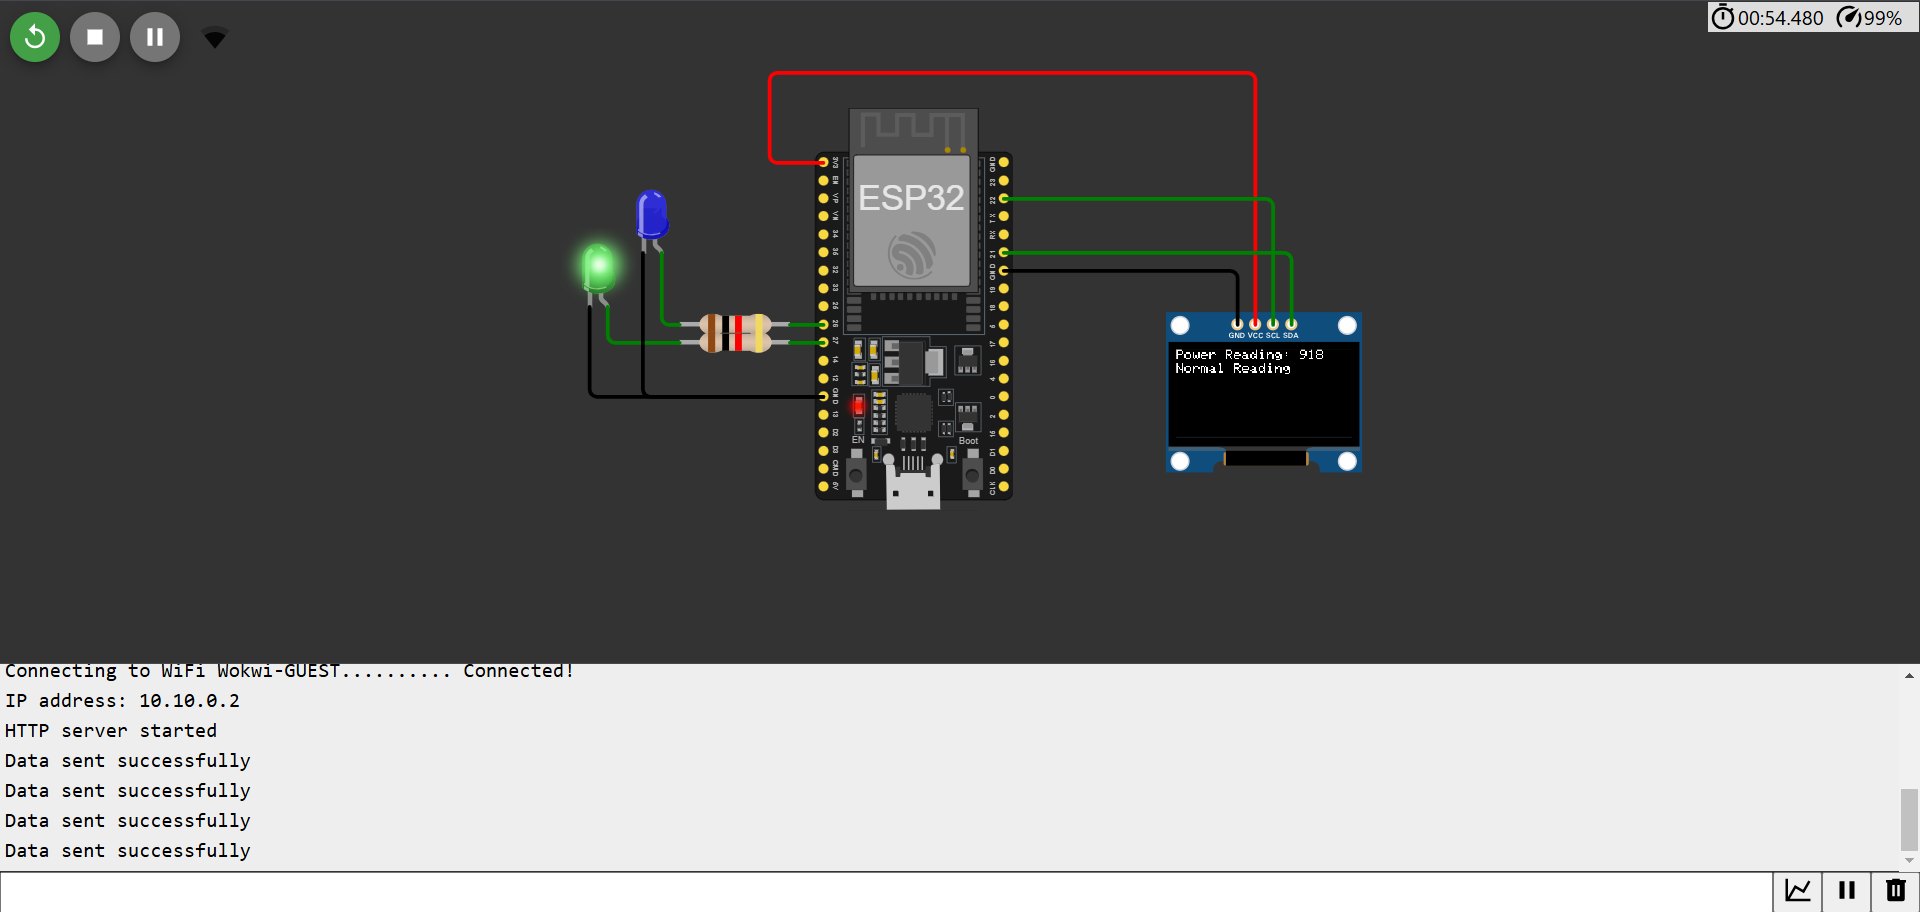
_Figure: The circuit simulation for normal reading of ESP-32. The green LED is on, representing normal power consumption._
---
The figure below shows the circuit simulation when the ESP-32 detects an anomaly in the power readings. The blue LED is lit to signify an anomaly, alerting the user to unusual power consumption.
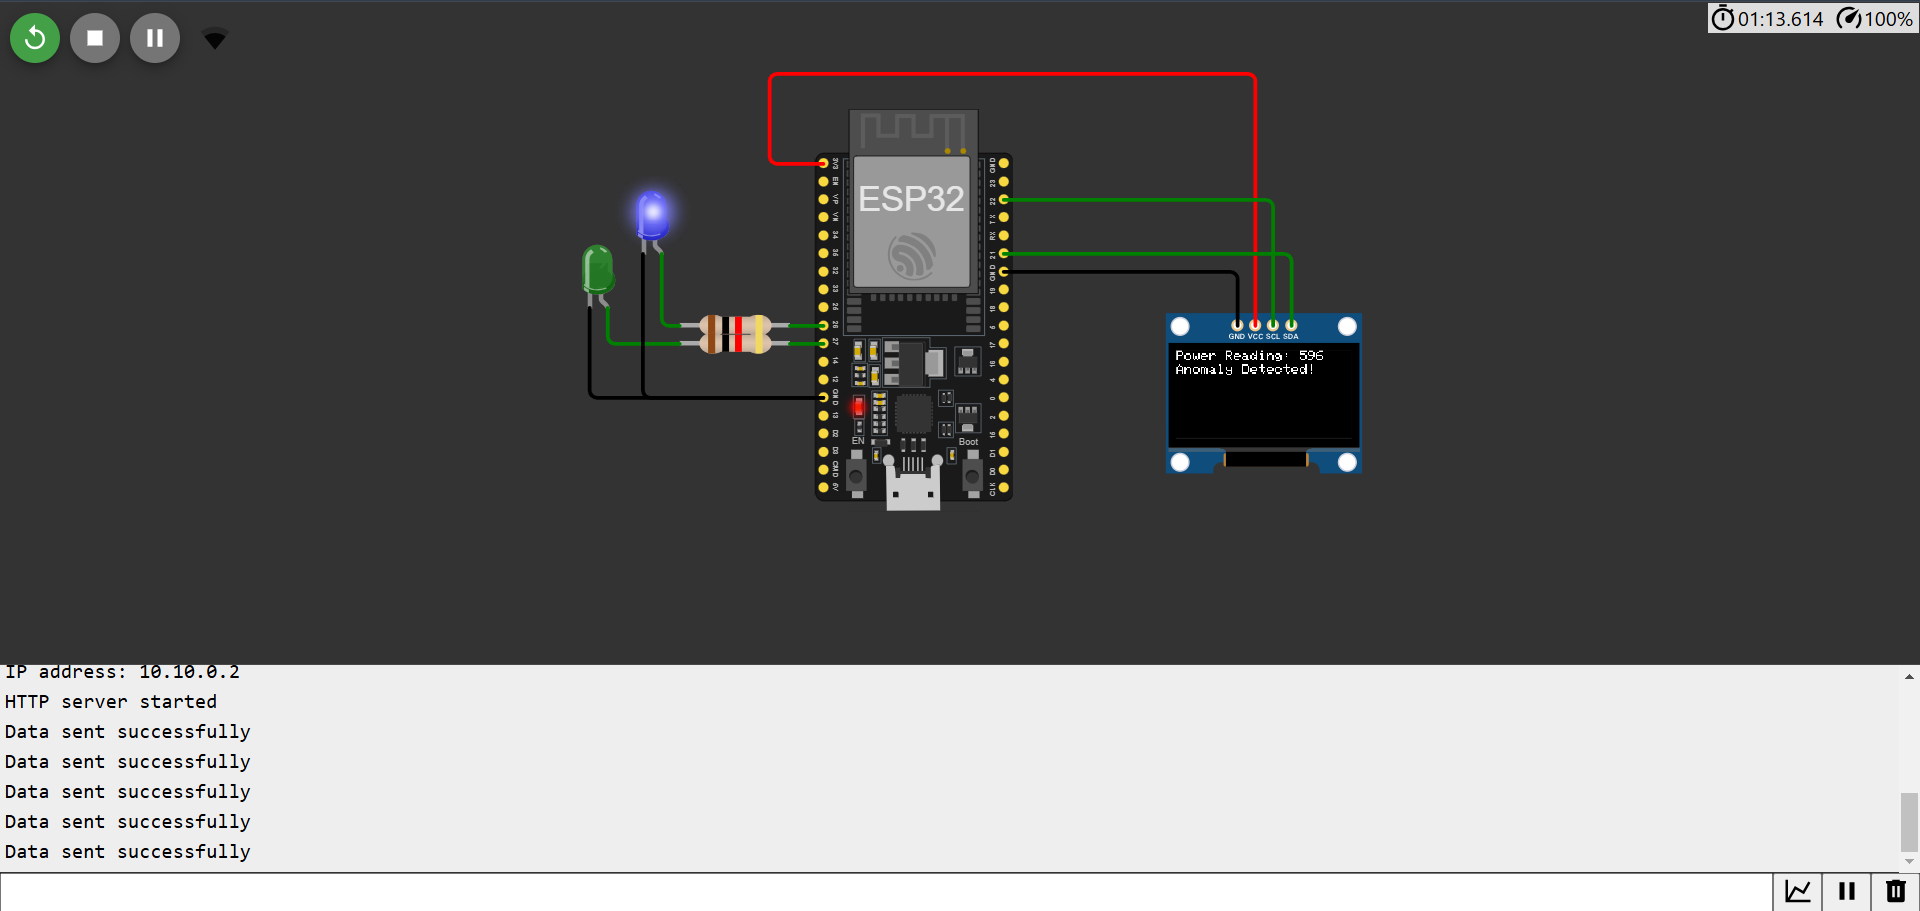
_Figure: The anomaly detected circuit simulation of ESP-32. The blue LED is on, indicating an anomalous power reading._
### ESP-32 Server Functionality
The ESP-32 server is designed to simulate power readings from an electric meter and send anomaly data to a remote server via HTTP POST requests. It also hosts a local web server to manage LED states and display real-time data on an OLED screen. Key features include:
1. **Wi-Fi Connectivity**:
- Connects to a predefined Wi-Fi network (`WIFI_SSID` and `WIFI_PASSWORD`).
- Retrieves and prints the ESP-32's IP address on successful connection.
2. **Power Reading Simulation**:
- Generates random power readings between 500 and 1000 units.
- Uses the `isAnomaly()` function to randomly flag anomalies (30% probability).
- Anomalies are marked for further processing and visualization.
3. **Anomaly Data Transmission**:
- Sends detected anomalies and their associated power readings to a remote server via an HTTP POST request.
- Data is structured in JSON format using the ArduinoJson library.
4. **Local Web Server**:
- Hosts a web server accessible from the ESP-32's local IP address.
- Provides an interactive HTML page to toggle the state of two LEDs (blue and red).
- URL patterns are dynamically handled using the `UriBraces` feature.
5. **LED Indications**:
- Blue LED: Indicates an anomaly in power readings.
- Green LED: Indicates normal power readings.
- Red LED: Reserved for additional notifications or error signals.
6. **OLED Display**:
- Displays the current power reading and its status (normal or anomalous) on an Adafruit SSD1306 OLED screen.
- Provides visual feedback for both simulated data and anomaly detection.
7. **Data Streaming**:
- Streams power readings and anomaly statuses for two minutes or until 10 anomalies are detected.
- After the streaming period, the LEDs are turned off to conserve power.
8. **HTTP Server Routes**:
- `/`: Returns an HTML interface to toggle LED states and view their status.
- `/toggle/{LED}`: Toggles the state of the specified LED (blue or red).
### How It Works
1. **Setup Phase**:
- Initializes Wi-Fi, OLED display, and GPIO pins for LEDs.
- Starts the HTTP server and waits for client requests.
2. **Power Reading Loop**:
- Simulates power readings at 10-second intervals.
- Flags readings as anomalies using a probabilistic function.
- Sends the flagged data to a remote server and updates the OLED display.
3. **Client Interaction**:
- Users can toggle LED states using the provided web interface.
- The server dynamically updates the HTML page to reflect the current LED states.
4. **End Condition**:
- Stops streaming data after two minutes or 10 anomalies.
- Resets LED states to off.
### How to Test the ESP-32 Server
1. **Setup Environment**:
- Connect the ESP-32 to a Wi-Fi network.
- Upload the sketch to the ESP-32 using the Arduino IDE.
2. **Access Web Interface**:
- Open the ESP-32's IP address in a web browser.
- Use the interface to toggle LED states.
3. **Monitor OLED Display**:
- Observe real-time power readings and anomaly detection statuses.
4. **Check Server Integration**:
- Update the `serverUrl` with the actual API endpoint.
- Verify that anomaly data is being sent and received correctly.
---
## Disclaimer
This repository is part of an ongoing research initiative. Unauthorized use, duplication, or modification of the resources provided here without the explicit consent of the author is **strictly prohibited**.
For inquiries, please contact:
📧 **ahr16.abidhasanrafi@gmail.com**
© **Test Framework for Edge Computing and Anomaly Detection - All rights reserved.**