https://github.com/abidhasanrafi/slicevision-f2i
SlicVision-F2I is a novel dataset that transforms network slice Key Performance Indicators (KPIs) into multiple visual representation patterns, designed for machine learning and deep learning applications in network slicing management.
https://github.com/abidhasanrafi/slicevision-f2i
network-slicing patterns-design synthetic-data
Last synced: 9 months ago
JSON representation
SlicVision-F2I is a novel dataset that transforms network slice Key Performance Indicators (KPIs) into multiple visual representation patterns, designed for machine learning and deep learning applications in network slicing management.
- Host: GitHub
- URL: https://github.com/abidhasanrafi/slicevision-f2i
- Owner: AbidHasanRafi
- Created: 2025-05-23T18:48:24.000Z (about 1 year ago)
- Default Branch: main
- Last Pushed: 2025-05-27T15:48:58.000Z (about 1 year ago)
- Last Synced: 2025-05-31T16:52:30.170Z (about 1 year ago)
- Topics: network-slicing, patterns-design, synthetic-data
- Language: Python
- Homepage: https://doi.org/10.17632/68xp3vszsz.1
- Size: 938 KB
- Stars: 0
- Watchers: 0
- Forks: 0
- Open Issues: 0
-
Metadata Files:
- Readme: README.md
Awesome Lists containing this project
README
# SliceVision-F2I: Synthetic Visual Dataset for Network Slicing
SlicVision-F2I is a novel multimodal dataset that transforms network slice Key Performance Indicators (KPIs) into multiple visual representation patterns, designed to bridge telecommunications and computer vision for next-generation network management systems.
## Dataset Description
SlicVision-F2I contains 30,000 samples of network slice KPIs converted into four distinct visual representation patterns. Each sample represents one of three primary 5G network slice types:
1. **eMBB (Enhanced Mobile Broadband)**: High-throughput applications
2. **URLLC (Ultra-Reliable Low-Latency Communications)**: Mission-critical services
3. **mIoT (Massive Internet of Things)**: Large-scale sensor networks
The dataset enables novel approaches to network management by providing multiple visual representations of identical underlying KPI data, facilitating multimodal learning and cross-pattern analysis.
## Key Features
- **Multi-pattern representations**: Four distinct visual encodings per sample
- **Comprehensive KPI coverage**: 10 key network performance metrics with realistic correlations
- **Real-world characteristics**:
- Simulated measurement noise (5-15%)
- Missing values (~5% random missingness)
- Natural class imbalance (eMBB:URLLC:mIoT = 2:1:7 ratio)
- **Production-ready**:
- Pre-normalized values (0-1 range)
- Missing value imputation (median-based)
- Consistent 16×16 RGB image format
## Potential Use Cases
### Network Management Applications
- **Anomaly Detection**: Train vision-based models to identify slice performance degradation
- **Slice Classification**: Multi-class recognition of slice types from KPI patterns
- **Quality Prediction**: Regression models for QoE metrics from visual representations
### Machine Learning Research
- **Multimodal Learning**: Study cross-pattern relationships and ensemble methods
- **Data Augmentation**: Test augmentation strategies across different representations
- **Explainable AI**: Visual interpretability of network performance decisions
### Telecommunications Education
- **Teaching Resource**: Visual demonstrations of network performance concepts
- **Benchmarking**: Standard dataset for comparing network AI approaches
- **Prototyping**: Rapid development of visual network analytics tools
## Dataset Structure
```
SlicVision-F2I/
├── numeric_data.csv # Raw KPI measurements and slice labels
├── guided_patterns.npy # Physics-inspired representations
├── perlin_patterns.npy # Procedural noise-based patterns
├── wallpaper_patterns.npy # Structural/geometric patterns
└── fractal_patterns.npy # Recursive branching patterns
```
### Data Fields Specification
| Field | Description | Normalized Range | Physical Range |
|-------|------------|------------------|----------------|
| slice_type | Slice category | - | {eMBB, URLLC, mIoT} |
| delay | End-to-end latency | [0,1] | 0-100ms |
| jitter | Latency variation | [0,1] | 0-50ms |
| loss | Packet loss rate | [0,1] | 0-10% |
| throughput | Data rate | [0,1] | 0-300Mbps |
| retransmissions | Retry rate | [0,1] | 0-10% |
| packet_discard_rate | Drop rate | [0,1] | 0-10% |
| rssi | Signal strength | [0,1] | -100dBm to -30dBm |
| snr | Signal quality | [0,1] | 0-40dB |
| cpu_util | Processor usage | [0,1] | 0-100% |
| mem_util | Memory usage | [0,1] | 0-100% |
| label | Class encoding | {0,1,2} | - |
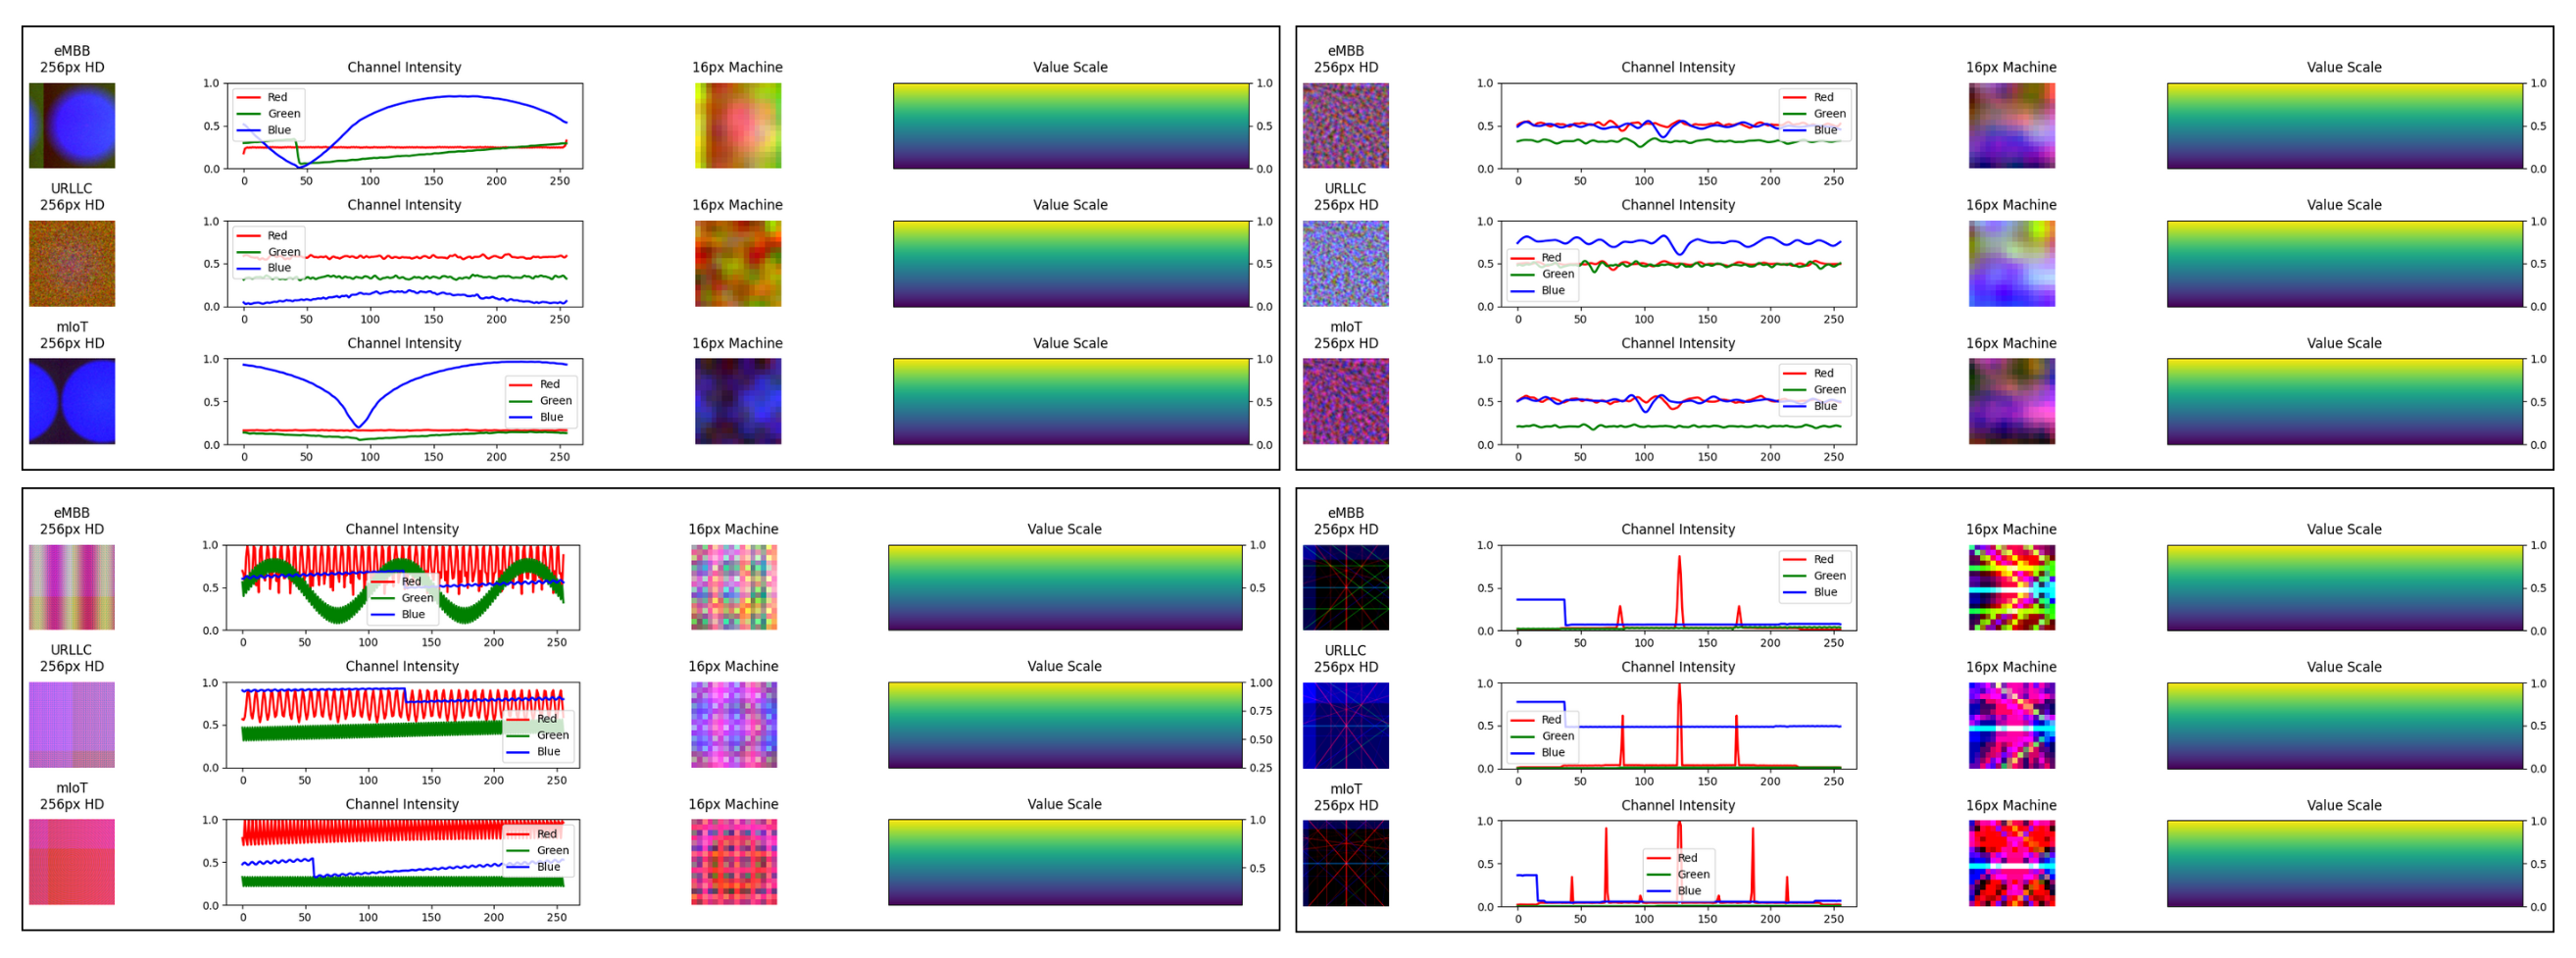
## Visual Representation Patterns
### 1. Physically-Guided Patterns
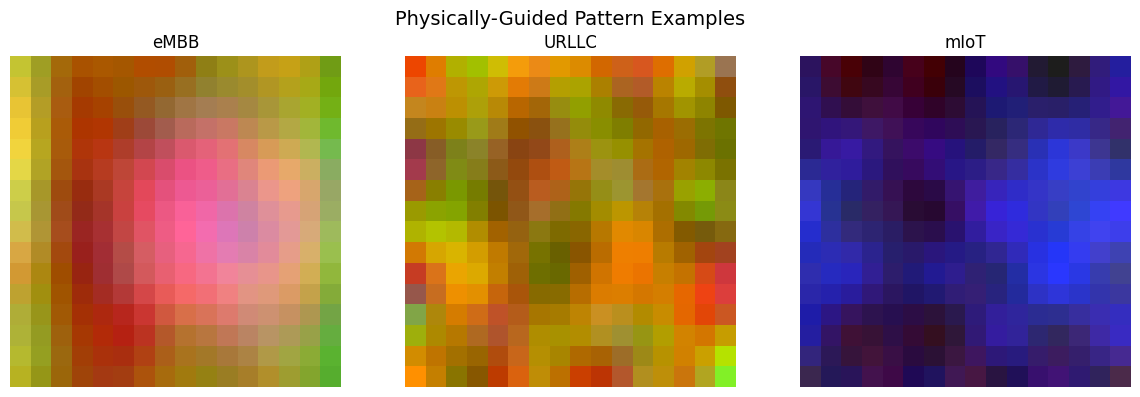
**Design Philosophy**: Embeds physical network relationships into spatial patterns
**Key Characteristics**:
- Gaussian blobs represent concentrated performance metrics
- Wave patterns show periodic behaviors
- Color channels encode related KPI groups:
- 🔴 Red: Latency metrics (delay/jitter/loss)
- 🟢 Green: Throughput metrics
- 🔵 Blue: System health (RSSI/SNR/resource usage)
### 2. Perlin Noise Patterns
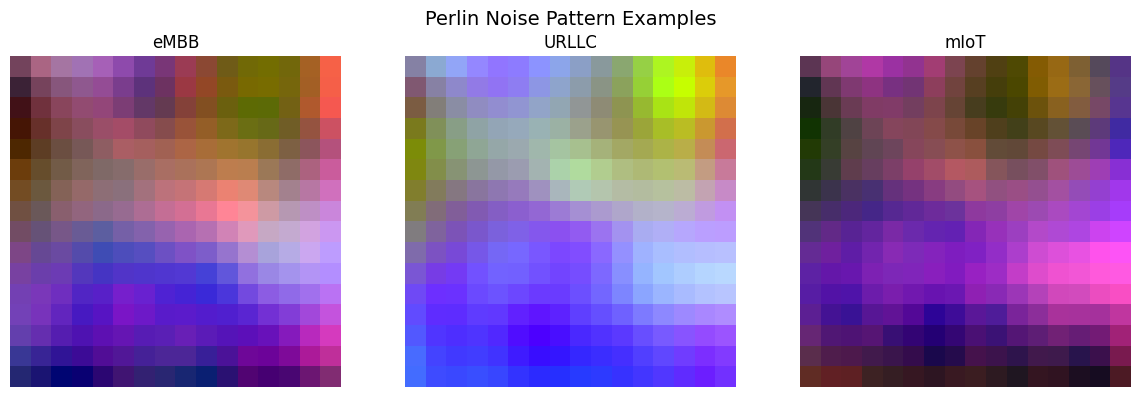
**Design Philosophy**: Organic patterns reflecting natural network variability
**Key Characteristics**:
- Noise parameters dynamically adjust to KPI values
- Each channel has unique generation parameters:
- Red: Octaves scaled by loss rate
- Green: Persistence set by throughput
- Blue: Lacunarity adjusted by SNR
### 3. Wallpaper Patterns
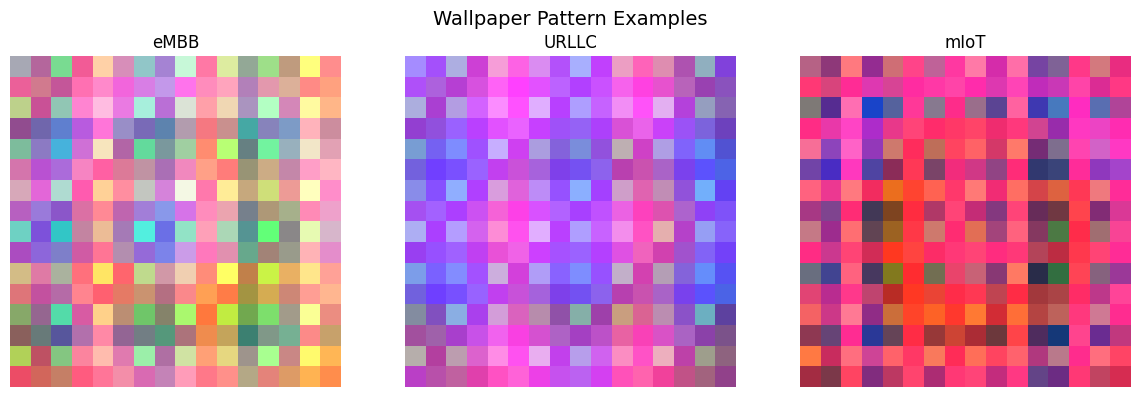
**Design Philosophy**: Structural representations of network periodicities
**Key Characteristics**:
- Combines multiple geometric primitives:
- Stripes → Throughput levels
- Grids → Packet loss patterns
- Radial gradients → Signal strength
- Parameters adapt to slice type characteristics
### 4. Fractal Branching Patterns
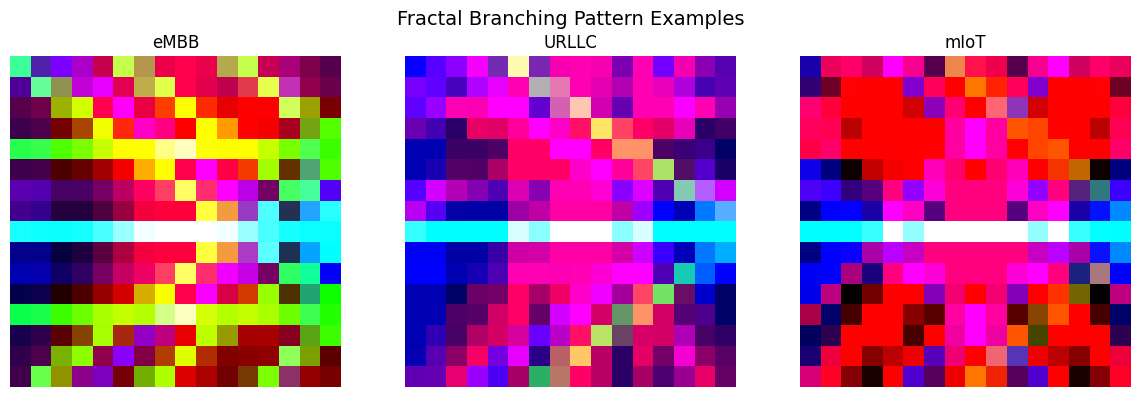
**Design Philosophy**: Tree structures modeling network paths
**Key Characteristics**:
- Branching complexity scales with traffic volume
- Leaf density reflects packet success rates
- Trunk stability indicates connection reliability
- Color gradients show resource utilization
## Dataset Statistics
| Category | Metric | Value |
|----------|--------|-------|
| **Samples** | Total | 30,000 |
| | eMBB | 6,000 (20%) |
| | URLLC | 3,000 (10%) |
| | mIoT | 21,000 (70%) |
| **Patterns** | Resolution | 16×16px |
| | Color Channels | 3 (RGB) |
| | Size on Disk | ~550MB |
| **Quality** | Missing Values | 4.8% |
| | Noise Level | 5-15% |
| | Normalization | Min-Max [0,1] |
## Dataset Testing Suite
This `dataset-testing` folder contains the core analysis scripts for evaluating the SlicVision-F2I dataset using both traditional machine learning and deep learning approaches.
### Files Overview
```
dataset-testing/
├── traditional_ml_analysis.py # Classical ML analysis script
├── cnn_analysis.py # CNN-based evaluation script
└── requirements.txt # Python dependencies
```
### 1. Traditional ML Analysis
`traditional_ml_analysis.py` - Evaluates the raw KPI data using classical machine learning algorithms.
### Features:
- Tests three classifier types:
- Random Forest
- Support Vector Machine (SVM)
- XGBoost
- Generates:
- Feature importance plots
- Correlation matrices
- Classification report
#### Usage:
```bash
python traditional_ml_analysis.py
```
### 2. CNN Analysis
`cnn_analysis.py` - Evaluates all four visual pattern types using convolutional neural networks.
### Features:
- Tests four pattern representations:
- Guided patterns
- Perlin noise patterns
- Wallpaper patterns
- Fractal patterns
- Generates:
- Training history plots
- Model accuracy comparisons
- Classification reports
#### Usage:
```bash
python cnn_analysis.py
```
### Requirements
Install dependencies with:
```bash
pip install -r requirements.txt
```
`requirements.txt` contents:
```
numpy
pandas
scikit-learn
xgboost
tensorflow
matplotlib
seaborn
```
### Running the Full Test Suite
1. First run traditional ML analysis:
```bash
python traditional_ml_analysis.py
```
2. Then run CNN evaluation:
```bash
python cnn_analysis.py
```
### Adding New Models
To extend this testing suite:
1. For traditional ML:
- Add new classifiers to `traditional_ml_analysis.py`
- Append evaluation metrics to existing JSON output
2. For CNN models:
- Create new architecture in `cnn_analysis.py`
- Follow the existing pattern comparison framework
### Troubleshooting
Common issues:
- **Shape mismatches**: Ensure numpy files match CSV metadata length
- **Memory errors**: Reduce batch size in CNN training
- **NaN values**: Confirm all KPIs are properly imputed in the CSV
## Citation
```bibtex
@misc{rafi2025slicevision,
author = {Rafi, Abid Hasan and Johora, Mst. Fatematuj and Bhowmik, Pankaj},
title = {{SliceVision-F2I: Synthetic Visual Dataset for Network Slicing}},
year = {2025},
publisher = {Mendeley Data},
version = {V1},
doi = {10.17632/68xp3vszsz.1},
url = {https://doi.org/10.17632/68xp3vszsz.1}
}
```
## Core Contributors
- **[Abid Hasan Rafi](https://github.com/abidhasanrafi)**
Dataset creation, pattern design, KPI modeling
- **[Mst. Fatematuj Johora](https://github.com/fatema-rifa)**
Dataset management, Data documentation
- **[Pankaj Bhowmik](https://hstu.ac.bd/teacher/pankaj)**
Dataset evaluation, Process supervision
## Disclaimer
Any sort of use, reproduction, or distribution of the content in this repository without proper citation or reference to the author is strictly prohibited. Please respect the intellectual property and give appropriate credit when using or referencing any part of this work.