https://github.com/abrie/data-challenge-2014
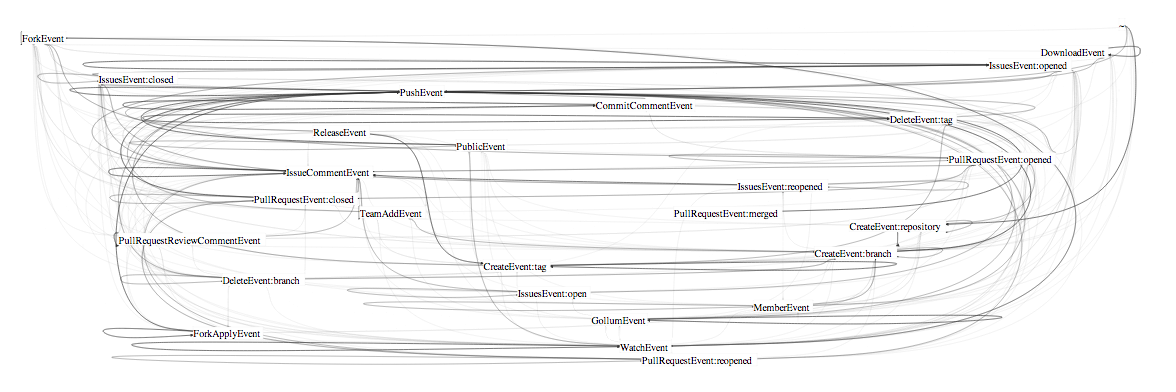
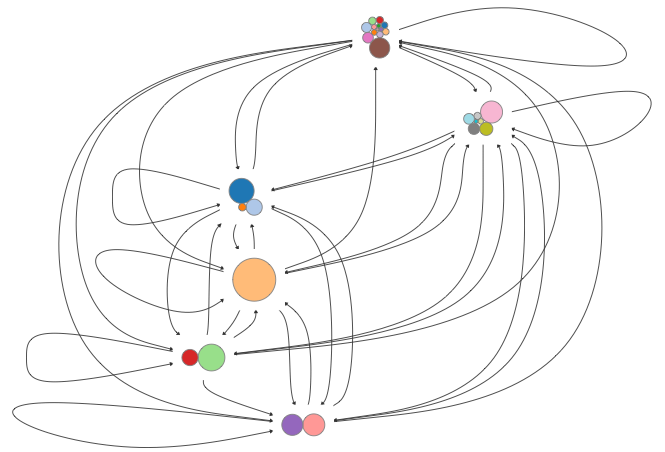
Bundled-Edge Views of the Github Event Graph
https://github.com/abrie/data-challenge-2014
Last synced: 23 days ago
JSON representation
Bundled-Edge Views of the Github Event Graph
- Host: GitHub
- URL: https://github.com/abrie/data-challenge-2014
- Owner: abrie
- Created: 2014-08-24T20:27:54.000Z (almost 12 years ago)
- Default Branch: master
- Last Pushed: 2014-09-17T15:40:45.000Z (over 11 years ago)
- Last Synced: 2025-03-18T21:23:40.500Z (about 1 year ago)
- Language: Python
- Homepage: abrie.github.io/data-challenge-2014
- Size: 4.6 MB
- Stars: 1
- Watchers: 1
- Forks: 1
- Open Issues: 0
-
Metadata Files:
- Readme: README.md
Awesome Lists containing this project
README
## Motivation
[Github Data Challenge 2014](https://github.com/blog/1864-third-annual-github-data-challenge)
## Results
[Bundled-Edged Views of the Github Event Graph](http://abrie.github.io/data-challenge-2014)
## Methodology and Source Code
At the heart of this plot are the SQL (or rather, BQL) queries sent to Google Bigquery. The queries consist of two types: a [model query](https://github.com/abrie/data-challenge-2014/blob/master/sql/repo-model.sql) and [state query](https://github.com/abrie/data-challenge-2014/blob/master/sql/repo-state.sql). The model query collects the data necessary for building a [markov matrix](http://en.wikipedia.org/wiki/Stochastic_matrix) by [counting transitions between sequential events](https://en.wikipedia.org/wiki/Adjacency_matrix). The state query computes a census of the most recent events (i.e. events not followed by another event). These two sets of data are then ["munged"](http://en.wikipedia.org/wiki/Data_wrangling) by [`munger.py`](https://github.com/abrie/data-challenge-2014/blob/master/munger.py). A [cluster detection algorithm](http://micans.org/mcl/) is used to group events. The results are gathered into a single JSON structure (example:[results.json](https://github.com/abrie/data-challenge-2014/blob/gh-pages/data/repo/results.json)). The [front end](https://github.com/abrie/data-challenge-2014/blob/master/pages/main.js) retrieves the results via [AJAX](http://en.wikipedia.org/wiki/Ajax_(programming)) and generates the illustrations using [D3js](http://d3js.org).
## Dependencies
This application uses [MCL](http://micans.org/mcl/). The source is contained in the `external/` directory. Install as follows:
- `tar xfz mcl-latest.tar.gz`
- `cd mcl-14-137`
- ``configure --prefix=`pwd```
- `make`
- `make install`
MCL will then be installed to `external/mcl-14-137`. If you install to a different path, then change the [`MCL_BIN`](https://github.com/abrie/data-challenge-2014/blob/master/mclinterface.py#L7) string found in `mclinterface.py`.
Numpy/Scipy are also required. If you're using Mavericks, use this: [ScipySuperpack](https://github.com/fonnesbeck/ScipySuperpack).
## Authorization of APIs
This application uses Google Bigquery. You'll need to supply authenticated credentials:
- [ ] Log into [Google Developer Console](https://console.developers.google.com/)
- [ ] Navigate to the [project list](https://console.developers.google.com/project)
- [ ] Create a new project. (Or use one you may have previously created :)
- [ ] Enable the BigQuery API: Select Project -> APIs and Auth -> API's -> BigQuery
- [ ] Generate a client_secrets JSON -> API's and Auth -> Credentials -> Create New Client ID
- [ ] Download the generated JSON and save as `client_secrets.json` to the root of this project.
- [ ] When you run the app a browser window will open and request authorization.
- [ ] Authorize it.
## Data Collection and Munging
[`main.py`](https://github.com/abrie/data-challenge-2014/blob/master/main.py) is where interested readers should begin. It is invoked as follows:
`python main.py -i identifier -q bigquery-id model:model.sql state:state.sql`
- `-i [setId]` This identifies the set. The query results will be stored in a folder named data/[setId]. If no query is specified using `-q`, then the most recent queries in the [setId] folder will be (re)munged.
- `-q [projectId] [name:sql name2:sql2] ...` projectId is a BigQuery project number (ex: 'spark-mark-911'). The [name:sql] entries specify sql files and the id to use when storing the results. Each of the sql files will be sent to BigQuery, and the responses recorded under `data/[setId]/[name]`. The munger will subsequently process the responses to produce `results.json`.
## Use the Scripts
[collect.sh](https://github.com/abrie/data-challenge-2014/blob/master/collect.sh) demonstrates the use of `main.py`. It is the same script used to generate the results used by [this page](http://abrie.github.io/data-challenge-2014). If you wish watch it operate:
`./collect.sh [projectId]` You'll need to specify the projectId obtained from your Google developer console.
[deploy.sh](https://github.com/abrie/data-challenge-2014/blob/master/deploy.sh) generates the presentation pages and writes them to the specified directory. It assumes that `collect.sh` has completed successfully. The generated site should be served through a webserver because the `results.json` files are loaded through Ajax. If you do not have a local webserver then [node http-server](https://github.com/nodeapps/http-server) or Python's SimpleHTTPServer are easy and recommended:
- `./deploy.sh deployed/path/`
- `http-server deployed/path/` or `cd deployed/path && python -m SimpleHTTPServer 8080`
- Navigate to http://localhost:8080
## Citations
- Stijn van Dongen, Graph Clustering by Flow Simulation. PhD thesis, University of Utrecht, May 2000. [link](http://micans.org/mcl/lit/svdthesis.pdf.gz)
## Contact
abrhie@gmail.com
## Addendum
These images show the evolution from very hairball, to less hairball, to combed hairball.

## More Features
Please visit the dev branch: [README.md](https://github.com/abrie/data-challenge-2014/tree/new_features) for additional features developed after submission. The conclusion of this competition shares poetic cohomology with a certain video of a polar bear and a can of condensed milk (video no longer available).