https://github.com/adamouization/corona-virus-insights-dashboard
Coronavirus dashboard visualisations entirely designed in D3.JS
https://github.com/adamouization/corona-virus-insights-dashboard
coronavirus coronavirus-analysis coronavirus-tracking covid-19 covid19 covid19-data d3 d3-visualization d3js d3v5 nodejs
Last synced: 6 months ago
JSON representation
Coronavirus dashboard visualisations entirely designed in D3.JS
- Host: GitHub
- URL: https://github.com/adamouization/corona-virus-insights-dashboard
- Owner: Adamouization
- License: mit
- Created: 2020-03-06T11:16:40.000Z (over 5 years ago)
- Default Branch: master
- Last Pushed: 2024-12-16T14:29:36.000Z (10 months ago)
- Last Synced: 2025-04-11T03:53:06.394Z (6 months ago)
- Topics: coronavirus, coronavirus-analysis, coronavirus-tracking, covid-19, covid19, covid19-data, d3, d3-visualization, d3js, d3v5, nodejs
- Language: SCSS
- Homepage: https://corona-virus-insights.fly.dev/
- Size: 4.3 MB
- Stars: 2
- Watchers: 2
- Forks: 1
- Open Issues: 10
-
Metadata Files:
- Readme: README.md
- License: LICENSE
Awesome Lists containing this project
README
# Coronavirus Insights Dashboard [](http://hits.dwyl.com/Adamouization/Corona-Virus-Insights-Dashboard) [](https://github.com/Adamouization/Corona-Virus-Insights-Dashboard/blob/master/LICENSE)  
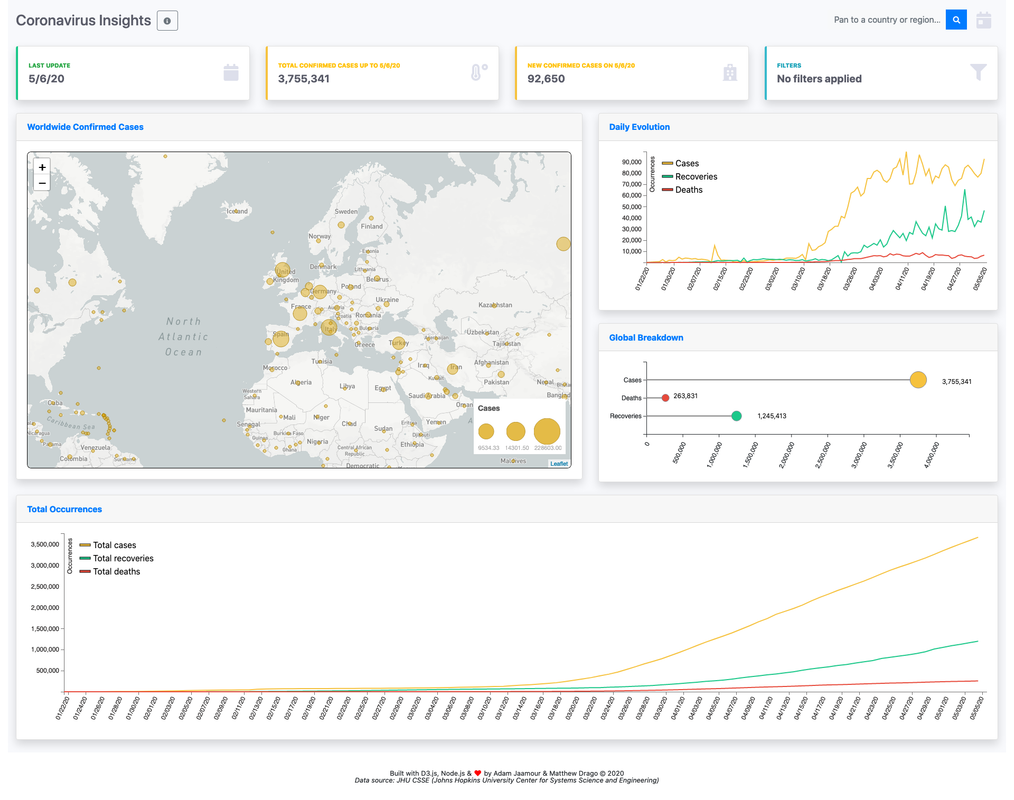
This website aims to provide insights into the 2019 Novel Coronavirus COVID-19 by visualising the Johns Hopkins University Centre for Systems Science and Engineering through the D3.js library. It was developed in the context of a practical for our Information Visualisation module, requiring us to visualise any dataset in D3.JS.
You can visit the website here: [corona-virus-insights.fly.dev](https://corona-virus-insights.fly.dev/)
## Screenshots
## Usage
Clone the project, `cd` into the directory and run the following command:
```bash
npm install && npm start
```
Visit the local web app on the chosen port (`3000` by default) at `http://127.0.0.1:3000/`
## License
* see [LICENSE](path) file.