https://github.com/aexel90/hue_exporter
Philips Hue exporter for prometheus
https://github.com/aexel90/hue_exporter
golang hue hue-api hue-bridge hue-bulbs hue-lights hue-motion-sensor hue-sensors philips philips-hue philips-hue-api philips-hue-bridge philips-hue-bulbs philips-hue-lighting philips-hue-lights philips-hue-switch prometheus prometheus-exporter
Last synced: 10 months ago
JSON representation
Philips Hue exporter for prometheus
- Host: GitHub
- URL: https://github.com/aexel90/hue_exporter
- Owner: aexel90
- License: apache-2.0
- Created: 2020-12-18T19:45:50.000Z (over 5 years ago)
- Default Branch: main
- Last Pushed: 2025-03-18T16:42:56.000Z (about 1 year ago)
- Last Synced: 2025-04-04T14:11:36.416Z (about 1 year ago)
- Topics: golang, hue, hue-api, hue-bridge, hue-bulbs, hue-lights, hue-motion-sensor, hue-sensors, philips, philips-hue, philips-hue-api, philips-hue-bridge, philips-hue-bulbs, philips-hue-lighting, philips-hue-lights, philips-hue-switch, prometheus, prometheus-exporter
- Language: Go
- Homepage:
- Size: 279 KB
- Stars: 21
- Watchers: 2
- Forks: 7
- Open Issues: 2
-
Metadata Files:
- Readme: README.md
- License: LICENSE
Awesome Lists containing this project
README
# Philips Hue exporter for prometheus
This exporter exports some variables from Philips Hue Bridge
(https://www.philips-hue.com)
to prometheus.
## Build
go get github.com/aexel90/hue_exporter/
cd $GOPATH/src/github.com/aexel90/hue_exporter
go install
## Execute
How to create a user for your bridge is described here: https://developers.meethue.com/develop/get-started-2/
Usage:
$GOPATH/bin/hue_exporter -h
Usage of ./hue_exporter:
-collect
Collect all available metrics
-collect-file string
The JSON file where to store collect results
-hue-url string
The URL of the bridge
-listen-address string
The address to listen on for HTTP requests. (default "127.0.0.1:9773")
-metrics-file string
The JSON file with the metric definitions. (default "hue_metrics.json")
-test
Test configured metrics
-username string
The username token having bridge access
## Docker
cp .env.template .env
vi .env
docker-compose up -d --build
## Example execution
### Running within prometheus:
$GOPATH/bin/hue_exporter -hue_url 192.168.xxx.xxx -username ZlEH24zabK2jTpJ... -metrics-file hue_metrics.json
# HELP hue_bridge_info Non-numeric data, value is always 1
# TYPE hue_bridge_info gauge
hue_bridge_info{api_version="...",bridge_id="...",internetservice_internet="...",internetservice_remoteaccess="...",internetservice_swupdate="...",internetservice_time="...",ip_address="...",local_time="...",model_id="...",name="...",sw_update_last_change="...",sw_version="...",zigbee_channel="..."} 1
...
# HELP hue_light_info Non-numeric data, value is always 1
# TYPE hue_light_info gauge
hue_light_info{id="...",manufacturer_name="...",model_id="...",name="...",state_alert="...",state_bri="...",state_color_mode="...",state_ct="...",state_on="...",tate_reachable="...",state_saturation="...",sw_config_id="...",sw_version="...",type="...",unique_id="..."} 1
...
# HELP hue_light_state light status (1=ON, 0=OFF)
# TYPE hue_light_state gauge
hue_light_state{name="..."} 1
...
# HELP hue_sensor_info Non-numeric data, value is always 1
# TYPE hue_sensor_info gauge
hue_sensor_info{config_battery="...",config_on="...",config_reachable="...",id="...",manufacturer_name="...",model_id="...",name="...",state_buttonevent="...",tate_daylight="...",state_lastupdated="...",state_lightlevel="...",state_temperature="...",sw_version="...",type="...",unique_id="..."} 1
...
# HELP hue_sensor_lightlevel light level
# TYPE hue_sensor_lightlevel gauge
hue_sensor_lightlevel{name="..."} 0
...
# HELP hue_sensor_temperature temperature level celsius degree
# TYPE hue_sensor_temperature gauge
hue_sensor_temperature{name="..."} 2016
### Test exporter:
$GOPATH/bin/hue_exporter -hue_url 192.168.xxx.xxx -username ZlEH24zabK2jTpJ... -test -metrics-file hue_metrics.json
### Collect:
$GOPATH/bin/hue_exporter -hue_url 192.168.xxx.xxx -username ZlEH24zabK2jTpJ... -collect -metrics-file hue_metrics.json -collect-file result.json
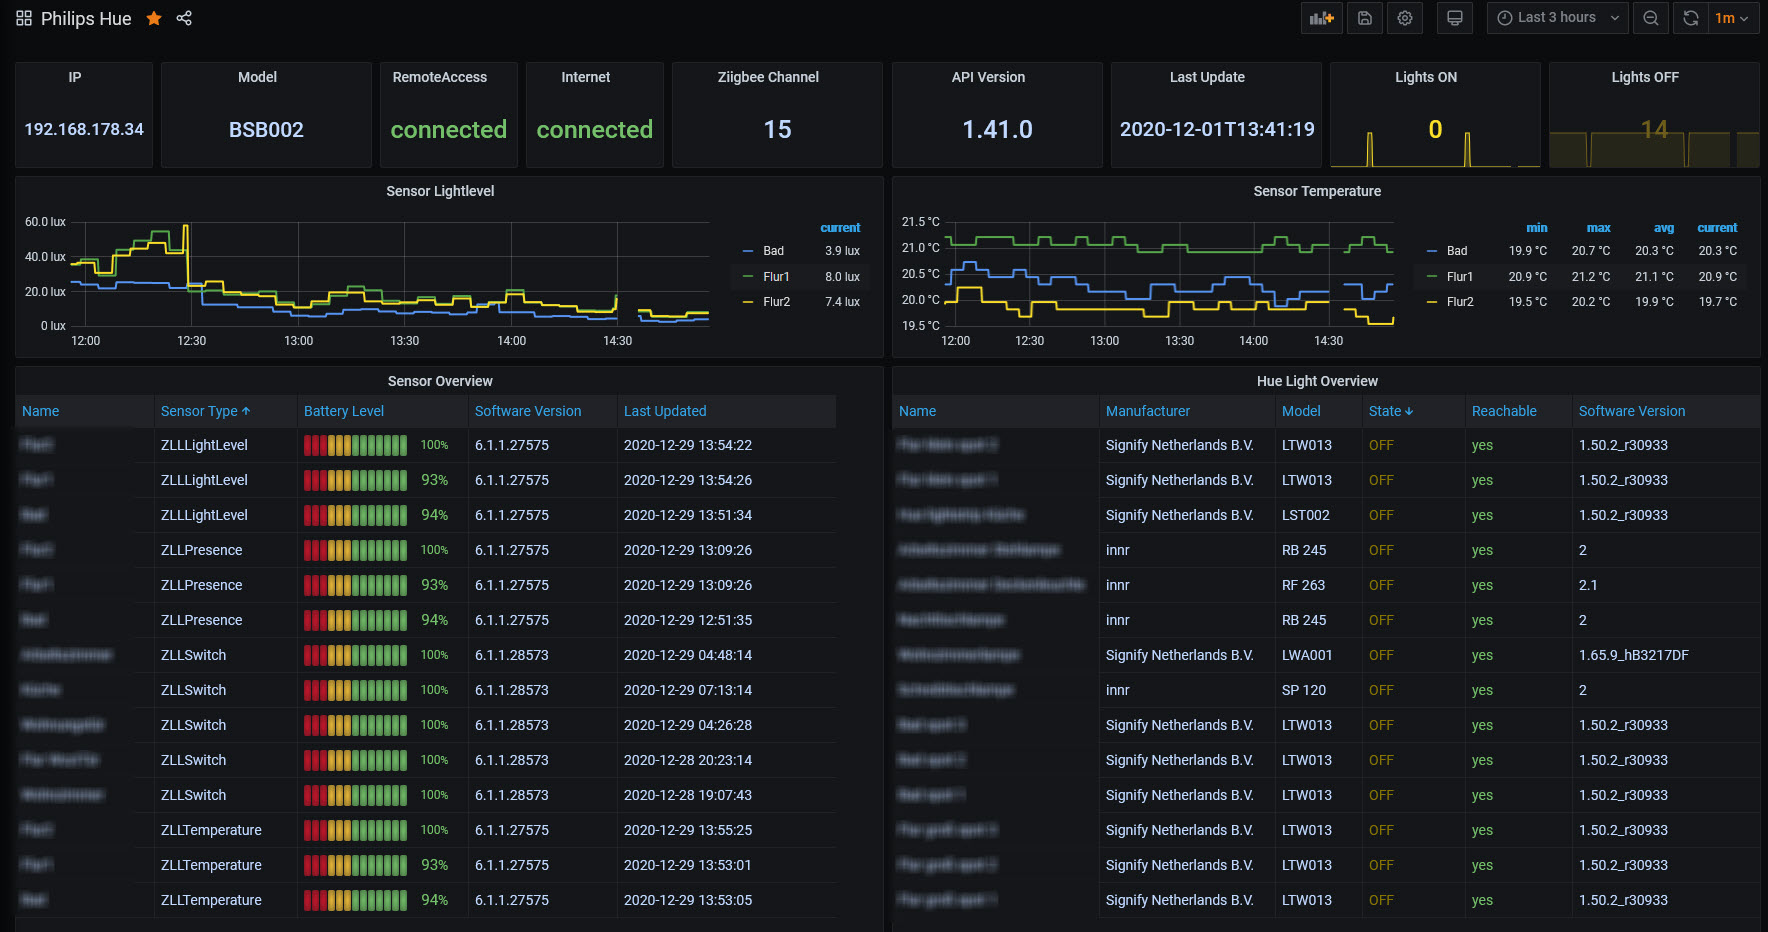
## Grafana Dashboard
Dashboard ID is 13645.
https://grafana.com/grafana/dashboards/13645