https://github.com/ahmedmmahrous/deploy-funnel-chart-with-streamlit
Deploy Funnel Chart with Streamlit
https://github.com/ahmedmmahrous/deploy-funnel-chart-with-streamlit
data-visualization funnel-chart pandas plotly py
Last synced: 17 days ago
JSON representation
Deploy Funnel Chart with Streamlit
- Host: GitHub
- URL: https://github.com/ahmedmmahrous/deploy-funnel-chart-with-streamlit
- Owner: AhmedMMahrous
- Created: 2022-09-26T18:41:31.000Z (over 2 years ago)
- Default Branch: main
- Last Pushed: 2022-09-26T19:59:08.000Z (over 2 years ago)
- Last Synced: 2025-02-17T16:52:07.001Z (3 months ago)
- Topics: data-visualization, funnel-chart, pandas, plotly, py
- Language: Python
- Homepage: https://ahmedmmahrous-deploy-funnel-chart-with-streamlit-app-fvd0jm.streamlitapp.com/
- Size: 3.91 KB
- Stars: 0
- Watchers: 1
- Forks: 0
- Open Issues: 0
-
Metadata Files:
- Readme: README.md
Awesome Lists containing this project
README
Deploy-Funnel-Chart-with-Streamlit
[Link](https://ahmedmmahrous-deploy-funnel-chart-with-streamlit-app-fvd0jm.streamlitapp.com/)
* Funnel charts are often used to represent data in different stages of a business process.
* It’s an important mechanism in Business Intelligence to identify potential problem areas of a process.
* For example, it’s used to observe the revenue or loss in a sales process for each stage.
* A funnel chart has multiple phases and values associated with them.
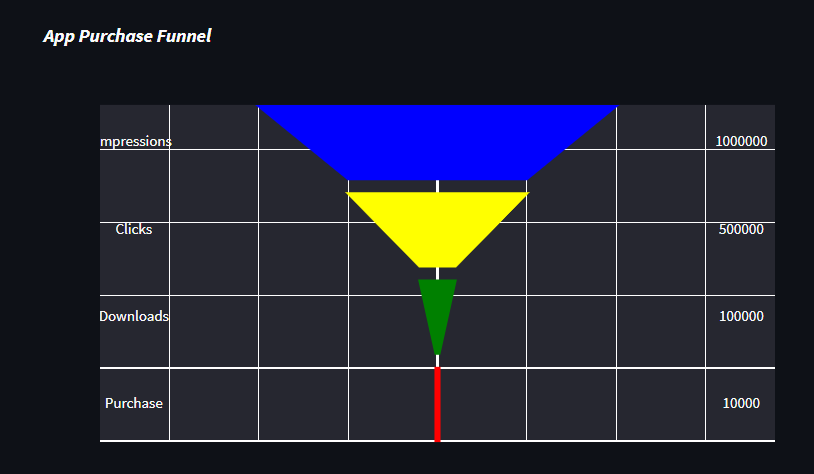
* Here is a table that represents a user flow funnel for a app.
* The column named 'Values' represents the total number of users at that Phase.
| `phases` | `values`|
| ------------- | ------------- |
| Impressions | 1000000 |
| Clicks | 500000 |
| Downloads | 100000 |
| Purchase | 10000 |
[](https://postimg.cc/YjkMy1Xg)